

Video Abstract
We aimed to determine whether rates of peanut (or any) immunoglobulin E–mediated food allergy (IgE-FA) changed following the publication of early peanut introduction guidelines and/or addendum guidelines.
Using electronic health record data from the multistate, primary care–based American Academy of Pediatrics Comparative Effectiveness Research through Collaborative Electronic Reporting (CER2) network, we defined preguidelines, postguidelines, and postaddendum guidelines cohorts (cohort entry during September 1, 2012, to August 31, 2014; September 1, 2015, to August 31, 2017; and February 1, 2017, to January 31, 2019, respectively). We determined the cumulative incidence of IgE-FA and/or atopic dermatitis (AD) in children aged 0–3 years, observed for either at least 1 or 2 years. Diagnosis rates during pre- vs postguidelines periods were compared using logistic regression, Cox proportional hazards modeling, and interrupted time series analysis.
The cumulative incidence and risk of development of peanut IgE-FA (0.79%–0.53%; hazard ratio [HR], 0.65; 95% CI, 0.55–0.77) and any IgE-FA (1.46%–1.02%; HR, 0.69; 95% CI, 0.61–0.78) decreased significantly (P < .0001) from the preguidelines to postguidelines period. Furthermore, the cumulative incidence and risk of development of peanut IgE-FA (0.79%–0.45%; HR, 0.55; 95% CI, 0.46–0.66) and any IgE-FA (1.46%–0.93%; HR, 0.63; 95% CI, 0.55–0.72) decreased significantly (P < .0001) from the preguidelines to postaddendum guidelines period. A decline in IgE-FA diagnosis postguidelines was confirmed in the interrupted time series analysis.
We detected decreased rates of peanut or any IgE-FA in the period following the publication of early introduction guidelines and addendum guidelines. Our results are supportive of the intended effect of these landmark public health recommendations.
What’s Known on This Subject:
The 2015 Learning Early About Peanut Allergy study motivated multiorganization guidelines encouraging early peanut introduction to at-risk children to prevent immunoglobulin E (IgE)–mediated food allergy. Whether this translated to real-world changes in peanut or other food allergy rates has not been clear.
What This Study Adds:
The prevalence of clinician-diagnosed peanut and overall IgE-mediated food allergy in infants decreased following the publication of early peanut introduction guidelines and addendum guidelines. Our findings suggest that the promotion of early food introduction is relevant to food allergy prevention efforts.
Introduction
Immunoglobulin E–mediated food allergy (IgE-FA), the most common cause of anaphylaxis in children, is associated with impaired quality of life, increased risk of allergic comorbidities, malnutrition, and high economic costs.1–3 Peanut is one of the most common causes of IgE-FA, and most children with peanut IgE-FA remain allergic into adulthood.4 Recently, it has been postulated that IgE-FA can be prevented through early-life food antigen exposure in the gut, an immunologically tolerogenic environment. This paradigm is supported by the landmark Learning Early About Peanut Allergy (LEAP) trial, in which infants aged 4 to 11 months with severe atopic dermatitis (AD) and/or egg allergy who regularly ingested peanut experienced 81% reduction in peanut allergy risk by age 5 years, an effect sustained into adolescence.5,6 Following the LEAP trial, multiorganization consensus guidelines emerged, starting with initial guidelines in 20157 for high-risk (ie, severe AD and/or egg allergy) infants and addendum guidelines in 20178 for high-risk and moderate-risk infants, with stratification guided by preemptive food allergy testing. These were followed by more recent (20213) guidelines, which recommended the introduction of peanut, egg, and other major food allergens at age 4 to 6 months, regardless of atopic history or food allergy testing.
In practice, there has been variability in the uptake of early food introduction guidelines, likely because of multifactorial barriers to implementation.9 In survey-based studies, 29% of general pediatricians10 and 65% of allergists11 endorsed full implementation of the 2017 early peanut introduction addendum guidelines, and only 17% of caregivers endorsed introducing peanut before age 7 months following the 2021 guidelines.12 Given the evolving landscape of food allergy prevention efforts, continuous monitoring of IgE-FA epidemiology is prudent. To date, it has been unclear whether rates of peanut, or any, IgE-FA have changed meaningfully after early food introduction guidelines were implemented in the United States. To address this knowledge gap, we compared the rates of clinician-diagnosed IgE-FA during pre- and postguidelines periods using a multisite, electronic health record (EHR)–based pediatric cohort.
Methods
Study Design and Patients
To determine IgE-FA diagnosis patterns in children before and after the publication of early peanut introduction guidelines, we used the American Academy of Pediatrics (AAP) Comparative Effectiveness Research through Collaborative Electronic Reporting (CER2) database, a Health Insurance Portability and Accountability Act–limited EHR database made up of primary care practices within the United States.2 We focused on a subset of CER2 practices that included 31 practices affiliated with an academic health system in the mid-Atlantic region and 17 independently owned private pediatric offices distributed across the United States with continuous data availability across the time period considered (September 1, 2012, to January 31, 2020) (Table S1). We first defined 2 cohorts, requiring the presence of a primary care visit before age 1 year for each cohort: (1) the “preguidelines” cohort, defined by cohort entry between September 1, 2012, and October 31, 2014, preceding the publication of initial guidelines (circa August 20157) and (2) the “postguidelines” cohort, defined by cohort entry between September 1, 2015, and August 31, 2017. Participants were observed for minimally 2 years (Figure 1A) for the development of AD and/or IgE-FA. A second analysis was performed with a 1-year observation window. This analysis included the same children enrolled in the preguidelines and post–initial guidelines cohorts and also allowed for the generation of a third “postaddendum guidelines” cohort, defined by cohort entry between February 1, 2017, and January 31, 2019, subsequent to the publication of early peanut introduction addendum guidelines (circa January 20178) (Figure 1B). Cohort observation times are summarized in Table S2. We abstracted sex and self-reported race and ethnicity, as documented by individual health systems in their respective EHRs. The latter were examined as proxies for nonbiological social and institutional factors that may influence disease outcomes, as prior studies have documented higher burden of allergic disease in children from minoritized racial and ethnic groups.13,14 The category “Unknown” includes children with unknown race, and “Other” is made up of other race designations, such as American Indian and multiracial. The study was approved by the AAP institutional review board and determined to not be human subjects research at the Children’s Hospital of Philadelphia.
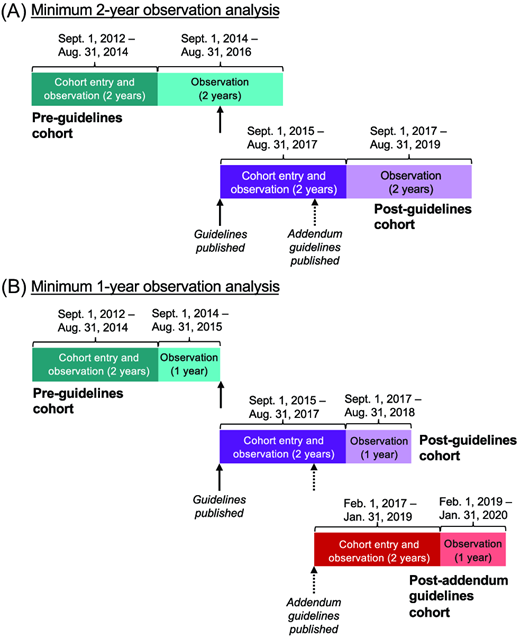
Cohort design schematic. (A) Pre-guidelines and post-guidelines cohorts with 2-year observation period. (B) Pre-guidelines, post-guidelines, and post-addendum guidelines cohorts with 1-year observation period. Dates of cohort entry (dark shade) and/or observation (dark or light shade) are indicated. Dates of guidelines and addendum guidelines publication are indicated with solid and dashed arrows, respectively.
Cohort design schematic. (A) Pre-guidelines and post-guidelines cohorts with 2-year observation period. (B) Pre-guidelines, post-guidelines, and post-addendum guidelines cohorts with 1-year observation period. Dates of cohort entry (dark shade) and/or observation (dark or light shade) are indicated. Dates of guidelines and addendum guidelines publication are indicated with solid and dashed arrows, respectively.
Study Outcomes
We identified children with peanut IgE-FA and 1 or more IgE-FAs, with or without preceding AD. As detailed previously,2 we used corresponding International Classification of Diseases, Ninth Revision or Tenth Revision diagnosis codes and/or Systematized Nomenclature of Medicine codes. For IgE-FA diagnosis, we required patients to have a corresponding diagnosis code, at least 1 FA item in the allergy module, and an epinephrine autoinjector prescription, without a prespecified order. Allergic disease cumulative incidence was determined using R software (version 4.4.2).
Statistical Analyses
First, univariable logistic regression was used to test if allergic outcome frequencies were significantly different in the pre- vs postguidelines periods. Next, we performed Cox proportional hazards modeling adjusted for age at cohort entry, sex, race, and ethnicity to compute the risk of development of allergic disease in the postguidelines vs preguidelines periods. Lastly, we performed interrupted time series analysis,15 as detailed in the Supplemental Methods. Briefly, we examined the monthly percentage of 2-year-olds with IgE-FA between January 1, 2014, and January 1, 2020, and determined the estimated slope change between the postguidelines regression line slope and the counterfactual preguidelines trend line slope.
Results
Cohort demographics (Tables 1 and 2; Tables S3–S6) included age at cohort entry, sex, and self-reported race and ethnicity as proxies for psychosocial factors that might influence disease rates. There were 38 594, 46 680, and 39 594 children in total in the preguidelines, postguidelines, and postaddendum guidelines cohorts, respectively (Figure 1). The mean ages (age range) of children in the 2-year observation analysis were 1.2 (0.3–3.9) and 0.9 (0.3–2) years for the preguidelines and postguidelines cohorts, respectively. In the 1-year observation analysis, they were 1.0 (0–2.9), 0.9 (0–2.7), and 0.8 (0–2.2) years for the preguidelines, postguidelines, and postaddendum guidelines cohorts, respectively. From the pre- to postguidelines periods, among children with IgE-FA, there was significantly (P < .05) increased representation of patients who were aged 0–4 months and white and decreased representation of those who were Black, Asian or Pacific Islander, and Hispanic (Tables 1 and 2).
Demographic Features of Study Cohorts With and Without IgE-FA: Minimum 2-Year Observation
| Preguidelinesa | Postguidelinesb | ||||||||
|---|---|---|---|---|---|---|---|---|---|
| IgE-FA | No IgE-FA | IgE-FA | No IgE-FA | ||||||
| n | % | n | % | n | % | n | % | Pc | |
| Age at cohort entry | |||||||||
| 0–4 months | 711 | 93.0 | 34 869 | 92.0 | 547 | 95.0 | 43 574 | 95.0 | **** |
| 5–8 months | 30 | 4.0 | 1618 | 4.0 | 16 | 3.0 | 1408 | 3.0 | NS |
| 9–12 months | 24 | 3.0 | 1342 | 4.0 | 13 | 2.0 | 1122 | 2.0 | NS |
| Sex | |||||||||
| Male | 469 | 61.0 | 19 341 | 51.0 | 354 | 61.0 | 23 629 | 51.0 | **** |
| Female | 296 | 39.0 | 18 487 | 49.0 | 222 | 39.0 | 22 475 | 49.0 | **** |
| Unknown | 0 | 0.0 | 1 | 0.0 | 0 | 0.0 | 0 | 0.0 | |
| Raced | |||||||||
| White | 439 | 57.0 | 21 941 | 58.0 | 354 | 61.0 | 26 136 | 57.0 | **** |
| Black | 156 | 20.0 | 9362 | 25.0 | 84 | 15.0 | 10 898 | 24.0 | **** |
| Asian or Pacific Islander | 70 | 9.0 | 1609 | 4.0 | 51 | 9.0 | 1955 | 4.0 | *** |
| Other | 28 | 4.0 | 1763 | 5.0 | 32 | 6.0 | 3619 | 8.0 | * |
| Unknown | 72 | 9.0 | 3154 | 8.0 | 55 | 10.0 | 3496 | 8.0 | * |
| Ethnicity | |||||||||
| Non-Hispanic | 713 | 93.0 | 33 067 | 87.0 | 526 | 91.0 | 40 150 | 87.0 | **** |
| Hispanic | 47 | 6.0 | 4125 | 11.0 | 39 | 7.0 | 4417 | 10.0 | NS |
| Other | 5 | 1.0 | 637 | 2.0 | 11 | 2.0 | 1537 | 3.0 | NS |
| Total | 765 | 100.0 | 37 829 | 100.0 | 576 | 100.0 | 46 104 | 100.0 | |
Abbreviations: IgE-FA, immunoglobulin E–mediated food allergy; NS, not significant.
Statistical testing was performed to compare the association of each demographic characteristic with IgE-FA status in the pre- vs postguidelines periods.
Cohort entry between September 1, 2012, and August 31, 2014, and observation until August 31, 2016 (as illustrated in Figure 1A).
Cohort entry between September 1, 2015, and August 31, 2017, and observation until August 31, 2019 (as illustrated in Figure 1A).
“****” represents P < .0001, “***” represents P < .001, and “*” represents P < .05.
The category “Unknown” is composed of those with self-identified unknown race, whereas “Other” includes all other entries including “American Indian or Alaska native,” “Mixed racial group,” and “Race not available.”
Demographic Features of Study Cohorts With and Without IgE-FA: Minimum 1-Year Observation
| Preguidelinesa | Postguidelinesb | Postaddendum Guidelinesc | ||||||||||||
|---|---|---|---|---|---|---|---|---|---|---|---|---|---|---|
| IgE-FA | No IgE-FA | IgE-FA | No IgE-FA | IgE-FA | No IgE-FA | |||||||||
| n | % | n | % | n | % | n | % | Pd | n | % | n | % | Pd | |
| Age at cohort entry | ||||||||||||||
| 0–4 months | 522 | 93.0 | 35 058 | 92.0 | 449 | 94.0 | 43 672 | 95.0 | * | 353 | 96.0 | 37 542 | 96.0 | * |
| 5–8 months | 23 | 4.0 | 1625 | 4.0 | 15 | 3.0 | 1409 | 3.0 | NS | 10 | 3.0 | 945 | 2.0 | NS |
| 9–12 months | 17 | 3.0 | 1349 | 4.0 | 12 | 3.0 | 1123 | 2.0 | NS | 5 | 1.0 | 739 | 2.0 | NS |
| Sex | ||||||||||||||
| Male | 342 | 61.0 | 19 468 | 51.0 | 290 | 61.0 | 23 693 | 51.0 | NS | 224 | 61.0 | 20 227 | 52.0 | ** |
| Female | 220 | 39.0 | 18 563 | 49.0 | 186 | 39.0 | 22 511 | 49.0 | NS | 144 | 39.0 | 18 999 | 48.0 | * |
| Unknown | 0 | 0.0 | 1 | 0.0 | 0 | 0.0 | 0 | 0.0 | 0 | 0.0 | 0 | 0.0 | ||
| Racee | ||||||||||||||
| White | 331 | 59.0 | 22 049 | 58.0 | 291 | 61.0 | 26 199 | 57.0 | * | 241 | 65.0 | 21 318 | 54.0 | NS |
| Black | 101 | 18.0 | 9417 | 25.0 | 70 | 15.0 | 10 912 | 24.0 | NS | 32 | 9.0 | 9286 | 24.0 | * |
| Asian or Pacific Islander | 49 | 9.0 | 1630 | 4.0 | 42 | 9.0 | 1964 | 4.0 | NS | 26 | 7.0 | 1761 | 4.0 | *** |
| Other | 23 | 4.0 | 1768 | 5.0 | 26 | 5.0 | 3625 | 8.0 | * | 30 | 8.0 | 2745 | 7.0 | NS |
| Unknown | 58 | 10.0 | 3168 | 8.0 | 47 | 10.0 | 3504 | 8.0 | NS | 39 | 11.0 | 4116 | 10.0 | * |
| Ethnicity | ||||||||||||||
| Non-Hispanic | 519 | 92.0 | 33 261 | 87.0 | 438 | 92.0 | 40 238 | 87.0 | * | 339 | 92.0 | 34 238 | 87.0 | * |
| Hispanic | 39 | 7.0 | 4133 | 11.0 | 30 | 6.0 | 4426 | 10.0 | NS | 17 | 5.0 | 3732 | 10.0 | *** |
| Other | 4 | 1.0 | 638 | 2.0 | 8 | 2.0 | 1540 | 3.0 | NS | 12 | 3.0 | 1256 | 3.0 | NS |
| Total | 562 | 100.0 | 38 032 | 100.0 | 476 | 100.0 | 46 204 | 100.0 | 368 | 100.0 | 39 226 | 100.0 | ||
Abbreviations: IgE-FA, immunoglobulin E–mediated food allergy; NS, not significant.
Statistical testing was performed to compare the association of each demographic characteristic with IgE-FA status in the pre- vs postguidelines periods.
Cohort entry between September 1, 2012, and August 31, 2014, and observation until August 31, 2015 (as illustrated in Figure 1B).
Cohort entry between September 1, 2015, and August 31, 2017, and observation until August 31, 2018 (as illustrated in Figure 1B).
Cohort entry between February 1, 2017, and January 31, 2019, and observation until January 31, 2020 (as illustrated in Figure 1B).
* represents P < .0001, ** represents P < .001, *** represents P < .01, and **** represents P < .05.
The category “Unknown” is made up of those with self-identified unknown race, whereas “Other” includes all other entries including “American Indian or Alaska native,” “Mixed racial group,” and “Race not available.”
Comparison of the cumulative incidence of IgE-FA before and after the publication of early introduction guidelines revealed significant decreases in the rates of peanut and any IgE-FA (Tables 3 and 4). In the 2-year observation analyses of postinitial guidelines vs preguidelines cohorts (Figure 1A), there were significant decreases in the cumulative incidences of peanut IgE-FA (0.67% vs 0.92%, 27.2% decrease; P < .0001), 1 or more IgE-FAs (1.23% vs 1.98%, 37.9% decrease; P < .0001), and 2 or more IgE-FAs (0.56% vs 0.79%, 29.1% decrease; P < .0001) (Tables 3 and 4). Results were similar in 1-year observation analyses (Figure 1A), with evidence for a further decline in IgE-FA cumulative incidence in the postaddendum guidelines period (Tables 3 and 4). The cumulative incidences of peanut IgE-FA (0.45% vs 0.79%, 43.0% decrease; P < .0001), 1 or more IgE-FAs (0.93% vs 1.46%, 28.6% decrease; P < .0001), and 2 or more IgE-FAs (0.40% vs 0.56%, 28.6% decrease; P < .0001) were significantly lower in the postaddendum guidelines vs preguidelines cohorts (Tables 3 and 4). In subanalyses in children with preceding AD or egg IgE-FA (risk factors for peanut IgE-FA5), there were significantly (P < .05) decreased rates of peanut IgE-FA in children with prior egg IgE-FA but not in children with prior AD (Tables 3 and 4). In the transition from the pre- to postguidelines periods, egg surpassed peanut as the topmost documented food allergen (Table 5 and 6). Although the cumulative incidence of egg allergy did not decrease significantly, the cumulative incidence of allergy to cow’s milk, the third most common documented food allergen, decreased significantly (P < .01) during this transition (Tables 5 and 6).
Cumulative Incidence of IgE-FA or AD in Study Cohorts: Minimum 2-Year Observation
| All Children | Children With Preceding AD | Children With Preceding Egg IgE-FA | ||||||
|---|---|---|---|---|---|---|---|---|
| Peanut IgE-FA | ≥1 IgE-FA | ≥2 IgE-FA | AD | Peanut IgE-FA | ≥1 IgE-FA | ≥2 IgE-FA | Peanut IgE-FA | |
| Preguidelinesa | 0.92% (355) | 1.98% (765) | 0.79% (306) | 13.4% (5157) | 0.38% (145) | 0.58% (225) | 0.23% (90) | 0.12% (46) |
| Postguidelinesb | 0.67% (312) **** | 1.23% (576) **** | 0.56% (263) **** | 19.7% (9219) **** | 0.33% (152) NS | 0.52% (243) NS | 0.26% (121) NS | 0.07% (34) * |
| Relative percent changec | −27.2% | −37.9% | −29.1% | +47.0% | −13.2% | −10.3% | +13.0% | −41.7% |
Abbreviations: AD, atopic dermatitis; IgE-FA, immunoglobulin E–mediated food allergy; NS, not significant.
Statistical testing was performed to compare each allergic outcome in the pre- vs postguidelines periods. All listed cumulative incidences represent the number of patients with the indicated diagnoses (absolute number listed in parentheses) divided by the total number of patients in the cohort during the observation period (as reported in Table 1). “*” represents P < .05 and “****” represents P < .0001.
Cohort entry between September 1, 2012, and August 31, 2014, and observation until August 31, 2016 (as illustrated in Figure 1A).
Cohort entry between September 1, 2015, and August 31, 2017, and observation until August 31, 2019 (as illustrated in Figure 1A).
Percent change relative to preguidelines cohort.
Cumulative Incidence of IgE-FA or AD in Study Cohorts: Minimum 1-Year Observation
| All Children | Children With Preceding AD | Children With Preceding Egg IgE-FA | ||||||
|---|---|---|---|---|---|---|---|---|
| Peanut IgE-FA | ≥1 IgE-FA | ≥2 IgE-FA | AD | Peanut IgE-FA | ≥1 IgE-FA | ≥2 IgE-FA | Peanut IgE-FA | |
| Preguidelinesa | 0.79% (306) | 1.46% (562) | 0.56% (217) | 11.2% (4313) | 0.27% (105) | 0.43% (166) | 0.20% (81) | 0.10% (39) |
| Postguidelinesb | 0.53% (247) **** | 1.02% (476) **** | 0.41% (193) ** | 18.0% (8397) **** | 0.25% (118) NS | 0.43% (199) NS | 0.21% (100) NS | 0.06% (26) * |
| Relative percent changec | −32.9% | −30.1% | −26.8% | +60.7% | −7.4% | 0% | +5% | −40.0% |
| Postaddendum guidelinesd | 0.45% (176) **** | 0.93% (368) **** | 0.40% (157) *** | 19.7% (7816) **** | 0.24% (96) NS | 0.37% (148) NS | 0.20% (83) NS | 0.04% (15) ** |
| Relative percent changec | −43.0% | −36.3% | −28.6% | +75.9% | −11.1% | −14.0% | 0% | −60.0% |
Abbreviations: AD, atopic dermatitis; IgE-FA, immunoglobulin E–mediated food allergy; NS, not significant.
All listed cumulative incidences represent the number of patients with the indicated diagnoses (absolute number listed in parentheses) divided by the total number of those in the cohort during the observation period (as reported in Table 1). Statistical testing was performed to compare each allergic outcome in the pre- vs postguidelines periods. “*” represents P < .05, “**” represents P < .01, “***” represents P < .001, and “****” represents P < .0001.
Cohort entry between September 1, 2012, and August 31, 2014, and observation until August 31, 2015 (as illustrated in Figure 1B).
Cohort entry between September 1, 2015, and August 31, 2017, and observation until August 31, 2018 (as illustrated in Figure 1B).
Percent change relative to preguidelines cohort.
Cohort entry between February 1, 2017, and January 31, 2019, and observation until January 31, 2020 (as illustrated in Figure 1B).
Distribution of Documented Food Allergens in Study Cohorts: Minimum 2-Year Observation
| Preguidelinesa | Postguidelinesb | |||||||
|---|---|---|---|---|---|---|---|---|
| Rank | Food | n | % | Rank | Food | n | % | Pc |
| 1 | Peanut | 355 | 0.920 | 1 | Egg | 326 | 0.698 | NS |
| 2 | Egg | 257 | 0.666 | 2 | Peanut | 312 | 0.668 | **** |
| 3 | Milk | 170 | 0.440 | 3 | Milk | 138 | 0.296 | *** |
| 4 | Tree nut | 62 | 0.161 | 4 | Tree nut | 64 | 0.137 | NS |
| 5 | Shellfish | 49 | 0.127 | 5 | Sesame | 43 | 0.092 | NS |
| 6 | Fish | 44 | 0.114 | 6 | Shellfish | 34 | 0.073 | * |
| 7 | Sesame | 38 | 0.098 | 7 | Cashew | 30 | 0.064 | NS |
| 8 | Soy | 33 | 0.086 | 8 | Soy | 24 | 0.051 | NS |
| 9 | Cashew | 19 | 0.049 | 9 | Fish | 22 | 0.047 | *** |
| 10 | Walnut | 14 | 0.036 | 10 | Wheat | 17 | 0.036 | NS |
| 11 | Wheat | 14 | 0.036 | 11 | Pistachio | 14 | 0.030 | NS |
| 12 | Almond | 7 | 0.018 | 12 | Walnut | 10 | 0.021 | NS |
| 13 | Sunflower | 7 | 0.018 | 13 | Almond | 9 | 0.019 | NS |
| 14 | Hazelnut | 6 | 0.016 | 14 | Sunflower | 8 | 0.017 | NS |
| 15 | Pecan | 6 | 0.016 | 15 | Hazelnut | 4 | 0.009 | NS |
| 16 | Pistachio | 5 | 0.013 | 16 | Mustard | 4 | 0.009 | NS |
| 17 | Mustard | 1 | 0.003 | 17 | Pecan | 3 | 0.006 | NS |
Abbreviation: NS, not significant.
Statistical testing was performed to compare each allergic outcome in the pre- vs postguidelines periods.
Cohort entry between September 1, 2012, and August 31, 2014, and observation until August 31, 2016 (as illustrated in Figure 1A).
Cohort entry between September 1, 2015, and August 31, 2017, and observation until August 31, 2019 (as illustrated in Figure 1A).
“*” represents P < .05, “***” represents P <0.001, and “****” represents P < .0001.
Distribution of Documented Food Allergens in Study Cohorts: Minimum 1-Year Observation
| Preguidelinesa | Postguidelinesb | Postaddendum guidelinesc | |||||||||||
|---|---|---|---|---|---|---|---|---|---|---|---|---|---|
| Rank | Food | n | % | Rank | Food | n | % | Pd | Rank | Food | n | % | Pd |
| 1 | Peanut | 306 | 0.793 | 1 | Egg | 271 | 0.581 | NS | 1 | Egg | 223 | 0.563 | NS |
| 2 | Egg | 233 | 0.604 | 2 | Peanut | 247 | 0.529 | NS | 2 | Peanut | 176 | 0.445 | **** |
| 3 | Milk | 146 | 0.378 | 3 | Milk | 116 | 0.249 | NS | 3 | Milk | 82 | 0.207 | ** |
| 4 | Tree nut | 47 | 0.122 | 4 | Tree nut | 37 | 0.079 | NS | 4 | Tree nut | 39 | 0.098 | NS |
| 5 | Shellfish | 36 | 0.093 | 5 | Sesame | 28 | 0.060 | NS | 5 | Sesame | 24 | 0.061 | NS |
| 6 | Fish | 31 | 0.080 | 6 | Shellfish | 24 | 0.051 | NS | 6 | Cashew | 16 | 0.040 | NS |
| 7 | Soy | 29 | 0.075 | 7 | Soy | 21 | 0.045 | NS | 7 | Soy | 12 | 0.030 | * |
| 8 | Sesame | 22 | 0.057 | 8 | Cashew | 16 | 0.034 | NS | 8 | Shellfish | 10 | 0.025 | ** |
| 9 | Cashew | 14 | 0.036 | 9 | Wheat | 16 | 0.034 | NS | 9 | Wheat | 10 | 0.025 | NS |
| 10 | Wheat | 13 | 0.034 | 10 | Fish | 14 | 0.030 | NS | 10 | Pistachio | 9 | 0.023 | NS |
| 11 | Walnut | 10 | 0.026 | 11 | Almond | 6 | 0.013 | NS | 11 | Fish | 8 | 0.020 | * |
| 12 | Almond | 5 | 0.013 | 12 | Pistachio | 6 | 0.013 | NS | 12 | Almond | 7 | 0.018 | NS |
| 13 | Hazelnut | 5 | 0.013 | 13 | Walnut | 6 | 0.013 | NS | 13 | Sunflower | 5 | 0.013 | NS |
| 14 | Sunflower | 5 | 0.013 | 14 | Sunflower | 4 | 0.009 | NS | 14 | Walnut | 5 | 0.013 | NS |
| 15 | Pecan | 4 | 0.010 | 15 | Mustard | 3 | 0.006 | NS | 15 | Hazelnut | 4 | 0.010 | NS |
| 16 | Pistachio | 4 | 0.010 | 16 | Hazelnut | 2 | 0.004 | NS | 16 | Pecan | 4 | 0.010 | NS |
| 17 | Mustard | 1 | 0.003 | 17 | Pecan | 2 | 0.004 | NS | 17 | Mustard | 1 | 0.003 | NS |
Abbreviation: NS, not significant.
Statistical testing was performed to compare each allergic outcome in the pre- vs postguidelines periods.
Cohort entry between September 1, 2012, and August 31, 2014, and observation until August 31, 2015 (as illustrated in Figure 1B).
Cohort entry between September 1, 2015, and August 31, 2017, and observation until August 31, 2018 (as illustrated in Figure 1B).
Cohort entry between February 1, 2017, and January 31, 2019, and observation until January 31, 2020 (as illustrated in Figure 1B).
“*” represents P < .05; “**” represents P < .01; “****” represents P < .0001.
Next, to quantify the impact of pre- vs postguidelines on the risk of diagnosis of peanut or any IgE-FA (Figure 2) or AD (Figure S1), we performed Cox proportional hazards modeling with adjustment for covariates (cohort entry age, sex, race, and ethnicity) and computed hazard ratios (HRs) (Table S7). We detected significant (P < .0001) reductions in the risk of diagnosis of peanut IgE-FA (HR, 0.65; 95% CI, 0.55–0.77 and 0.55; 95% CI, 0.46–0.66) and any IgE-FA (HR, 0.69; 95% CI, 0.61–0.78 and 0.63; 95% CI, 0.55–0.72) in the preguidelines to postguidelines and preguidelines to postaddendum guidelines periods, respectively (Figure 2; Table S7). During this transition, there was a concurrent, significant (P < .0001) increase in the risk of AD diagnosis (Figure S1; Table S7).
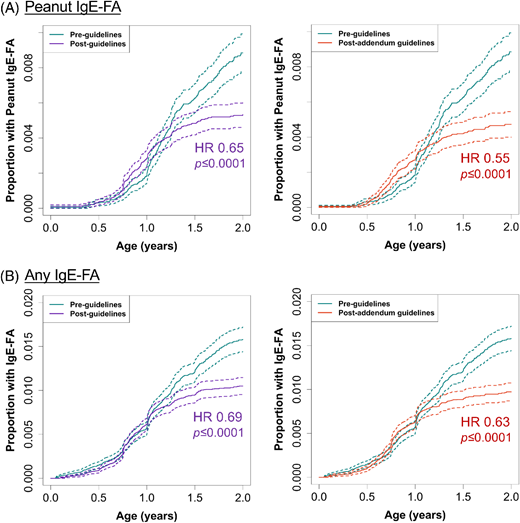
Cox proportional hazards modeling. Proportion of children with diagnosis of (A) peanut IgE-FA or (B) any IgE-FA during the postguidelines (or postaddendum guidelines) vs the preguidelines periods. Results are shown for models adjusted for age at cohort entry, sex, race, and ethnicity. Dashed lines represent 95% CIs.
Cox proportional hazards modeling. Proportion of children with diagnosis of (A) peanut IgE-FA or (B) any IgE-FA during the postguidelines (or postaddendum guidelines) vs the preguidelines periods. Results are shown for models adjusted for age at cohort entry, sex, race, and ethnicity. Dashed lines represent 95% CIs.
Lastly, we performed interrupted time analysis to ascertain whether the publication of early introduction guidelines was associated with a change in the rate of 2-year-old children who were diagnosed with IgE-FA. Using monthly diagnosis data and segmented linear regression, we quantified the slopes of the postguidelines trend line and the counterfactual trend line, an extrapolation of the preguidelines trend line (Table S8). We detected a possible reduction in the rate of peanut IgE-FA diagnosis during the entirety of the postguidelines period, although this difference was not statistically significant (slope change, −0.012; 95% CI, −0.031 to 0.0074; P = .23; Table S8). However, there was a significant reduction in the rate of diagnosis of 1 or more IgE-FAs (slope change, −0.027; 95% CI, −0.051 to −0.0029; P < .05) during the entirety of the postguidelines period (Figure 3) as opposed to exclusively the post–initial guidelines (Figure S2) or postaddendum guidelines (Figure S3) periods.
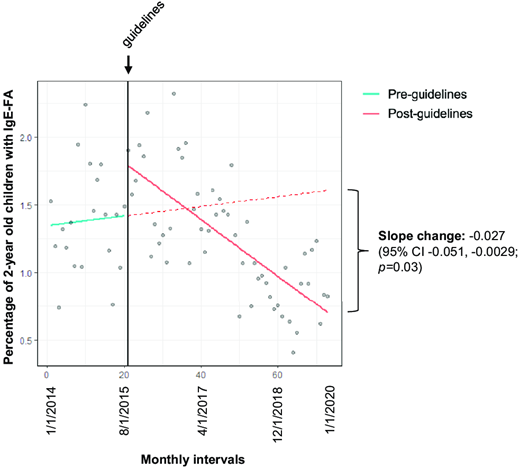
Interrupted time analysis. Monthly percentages of 2-year-old children with IgE-FA diagnosis before and after the publication of initial early introduction guidelines (intervention, vertical black line). The solid teal, dashed red, and solid red lines represent the preintervention, counterfactual, and postintervention trend lines, respectively.
Interrupted time analysis. Monthly percentages of 2-year-old children with IgE-FA diagnosis before and after the publication of initial early introduction guidelines (intervention, vertical black line). The solid teal, dashed red, and solid red lines represent the preintervention, counterfactual, and postintervention trend lines, respectively.
Discussion
There has been considerable evolution in guidelines focused on identifying the optimal time to introduce potentially allergenic foods to children.9 In 2008, the AAP rescinded prior guidance to delay introduction of peanut to at-risk children until age 3 years, as this strategy was not protective against food allergy.16,17 A pivotal paradigm shift occurred when the LEAP trial uncovered the effectiveness of early, sustained ingestion of peanut in protecting against peanut IgE-FA in at-risk (ie, severe AD and/or egg allergy) infants.5 Subsequently, multiorganization consensus guidelines advocated for early peanut introduction in at-risk children.7,8 Although these guidelines included a role for targeted screening (ie, peanut-specific IgE or skin prick test), it has become increasingly apparent that screening is not universally accessible and that the false positive rate of testing translates to unnecessary delays in food introduction and increased medical costs.18,19 As such, in 2021, a panel of experts from premier organizations in allergy and immunology recommended that both peanut and egg be introduced around 6 months of life, without a need for risk stratification or food allergy testing.3 By design and in practice, this important public health intervention has been implemented by general pediatricians during routine well child visits. However, it has not been clear whether the early introduction paradigm shift in the United States has been accompanied by changes in IgE-FA epidemiology.
In this study, we used an EHR-based pediatric cohort to describe the diagnosis patterns of IgE-FA in children aged 0–3 years. We note that this age range is inclusive of the peak time of incidence of peanut (15 months) and any (13 months) IgE-FA, as previously identified within the pediatric CER2 network.2 As the early introduction guidelines and addendum guidelines were published between 2015 and 2017, it is currently not possible to assess their impact on IgE-FA rates across the entirety of childhood (ie, aged 0–18 years). Suggesting that overall food allergy rates have remained similar in the pre- and postguidelines periods, in the National Health Interview Survey, the prevalences of parent-reported food allergy in children younger than 18 years were 5.6% and 5.8% in 2012 and 2021, respectively.20,21 Accordingly, we focused on a younger population more likely to reveal a change if guidelines had an impact on food allergy rates.
Our EHR-based approach complements survey-based approaches, which can be used to construct nationally representative cohorts yet may be affected by reporting bias.22 Here, we used clinician-entered diagnostic data within a subset of AAP CER2 practices23 for which data were continuously available throughout the time period of interest. Our results revealed significantly decreased rates of peanut and any IgE-FA in the postguidelines period as compared with the preguidelines period. We note the importance of accurately specifying the intervention point in analyses like interrupted time series because of factors such as delayed uptake. To this end, in addition to considering 2 contiguous time periods, our analyses also compared IgE-FA diagnosis patterns between the preguidelines period and the period following publication of the addendum guidelines, a nuanced update of the initial early introduction guidelines. The 16-month gap between these periods effectively served as a “washout” period that enabled us to consider the possibility of delayed uptake of initial guidelines.
Of note, the decreases in peanut and IgE-FA cumulative incidence that we detected were statistically significant regardless of AD diagnosis. This finding aligns with recent de-emphasis of risk stratification in encouraging early introduction of peanut, egg, and other potentially allergenic foods.3 Nevertheless, AD is a recognized IgE-FA risk factor and initiation point for the allergic march, as impairment of the skin barrier facilitates allergic sensitization. The fact that the postguidelines cohorts had increased representation of very young (0–4 months) infants and those with AD diagnosis suggests that early recognition of AD as a risk factor may have contributed to the observed decline in IgE-FA rates. As the differences in IgE-FA rates were not significantly different in subanalyses of children with preceding AD diagnosis, the possibility exists that food allergy prevention efforts could be further prioritized in this population. Interestingly, in the postguidelines periods we detected a significant reduction in the cumulative incidence of milk IgE-FA but not egg IgE-FA. These results suggest that early introduction practices may be variably applied to specific foods, underscoring the need to track the evolving landscape of early food introduction patterns.
There has been interest in studying the effects of early introduction guidelines on food allergy on an international level. In a single-center center study in Canada, implementation of early introduction guidelines was associated with a significant decrease in new-onset anaphylaxis in children aged 2 years or younger.24 In Australia, changes to infant feeding guidelines in 2007 and 2015 coincided with a slowing in the year-on-year rate of food-related anaphylaxis in children aged 1–14 years, although food-related anaphylaxis admission rates still increased in all age groups overall.25 However, despite the increase in early peanut introduction in Australia, a nonsignificant (0.5%) absolute reduction in peanut allergy prevalence was observed in a recent cross-sectional study.26 Similarly, following the revision of early introduction guidelines in Sweden, introduction of peanut, egg, and other potentially allergenic foods during the first year of life increased; however, no difference in the prevalence of self-reported IgE-FA was observed in children up to age 18 months in the postguidelines period.27 These modest effects highlight the importance of continued study of infant feeding practices and food allergy patterns as well as the value of examining EHR-based diagnostic information alongside self-reported data.
Because socioeconomic disparities are known to adversely impact allergic outcomes in children from minoritized racial and ethnic groups,14 we examined self-reported racial and ethnic characteristics as proxies for social and environmental factors that may impact disease outcomes. In the transition from the pre- to postguidelines periods, we noted decreased proportions of food-allergic children who were Black, Asian or Pacific Islander, and Hispanic. It is unclear whether these reflect differences in feeding practices among different demographic groups and/or other factors that may have been disproportionately affected by access to care. We note that, overall, our cohorts included a higher proportion of self-identified Black children (24%-25% vs 14%) and a lower proportion of self-identified Hispanic children (10%-11% vs 26%) as compared with US census data.28 As such, our cohort is not nationally representative, although it is inclusive of demographic groups that have not been universally included in prior research studies. We note that in our Cox proportional hazards models our results were comparable whether or not we adjusted for these demographic covariates.
Several study limitations warrant consideration. First, we were unable to elicit information about actual infant and toddler feeding patterns, such as when specific foods were introduced and the amounts and frequencies of ingestion following initial introduction. Indeed, previous studies have highlighted that both early introduction and sustained ingestion are important factors that promote the development of protection against food allergy.5,29 We also note that our study does not capture food allergy patterns in the time period following the liberalized 2021 early introduction guidelines,3 although 1 strength of the dates selected is that consideration of the potential disruptive effects of the COVID-19 pandemic were not necessary. As predisposition to allergy reflects a complex interplay of environmental and genetic factors,30 we cannot rule out roles for additional, nondietary factors in influencing food allergy rates over time. Further, although our diagnostic criteria required the presence of diagnosis codes, epinephrine prescription, and food allergen documentation, we did not consider other clinical data, such as food allergy testing or oral food challenges. Lastly, our study includes a subset of CER2 health systems and, as such, the generalizability of our findings to outside health systems is not fully clear.
In summary, using multistate clinical and diagnostic EHR data, we observed significant declines in the cumulative incidence of peanut and any IgE-FA following the publication of early introduction guidelines in 2016, with further decline in these rates after the publication of addendum guidelines in 2017, regardless of preceding AD diagnosis. Our study is one of the first to detect a significant trend toward reduced IgE-FA diagnosis in the United States following the evidence-based paradigm shift toward early food introduction as a means of preventing food allergy. Although significantly reduced, the percent reduction in peanut IgE-FA in our study was lower than that observed in the LEAP trial.5 This is consistent with recent survey-based studies that demonstrate clinician variability in recommending early introduction10,11 and suggests an opportunity to strengthen such efforts in the real-world setting. Our findings are relevant to caregivers of infants, providers of pediatric primary care, and allergists. Furthermore, they are supportive of efforts to increase education and advocacy related to early food introduction practices, which currently vary across different stakeholders.9–11 Future studies should not only monitor IgE-FA epidemiology longitudinally but also delineate the specific feeding practices of families; these may help characterize the timing, frequency, and dose of foods associated with optimal protection against food allergy in children.
Drs Gabryszewski and Hill developed the study, performed data analysis, drafted the initial manuscript, and reviewed and revised the manuscript. Ms Dudley, Drs Faerber, Grundmeier, Spergel, and Fiks were involved in the study design, data collection and analysis, and review and revision of the manuscript. All authors approved the final manuscript as submitted and agree to be accountable for all aspects of the work.
CONFLICT OF INTEREST DISCLOSURES: The authors have no conflicts of interest relevant to this article to disclose.
FUNDING: This work was supported by the National Institutes of Health (NIH) (grants T32HD043021 and K08AI182477 to Dr Gabryszewski) and the Food Allergy Fund (to Dr Hill). Allergy research in the Hill Laboratory is also supported by the NIH (grant R01HL162715 to Dr Hill), the Hartwell Foundation, the American Academy of Allergy Asthma and Immunology, the American Partnership for Eosinophilic Disorders, and the Children’s Hospital of Philadelphia Research Institute. Additional infrastructure funding was provided by the American Academy of Pediatrics and the Health Resources and Services Administration (HRSA) of the US Department of Health and Human Services (HHS) under UA6MC15585 - National Research Network to Improve Children’s Health and U5DMC39344 - Pediatric Research Network Program. The contents are those of the authors and do not necessarily represent the official views of, nor an endorsement, by the NIH, HRSA/HHS, or US Government. None of the funding sources had a role in the design or conduct of the study.
COMPANION PAPER: A companion to this article can be found online at www.pediatrics.org/cgi/doi/10.1542/peds.2025-072593.


Comments