
SlavkoSereda/iStock via Getty Images
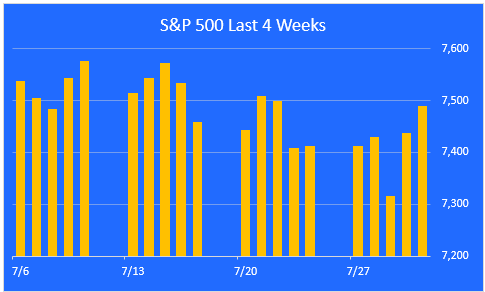
It was a relatively strong week for equities, except for Wednesday’s Fed-induced selloff. Tech was hot, especially the Mag 7 stocks. That’s an example of what we are looking for in these weekly recaps. We’re here to examine, with charts and tables, which assets, sectors, industries, groups, and stocks were falling along with the market, and which were going against the grain and rising in spite of the selling. As is our custom, we begin with a snapshot of the past 4 weeks.
S&P 500 Last 4 Weeks
Looking at the last 5 bars on this chart shows that it was an up week except for Wednesday. The strongest day was Thursday, when investors dutifully bought the dip that was caused by the Fed’s decision to hold rates steady.
author compilation
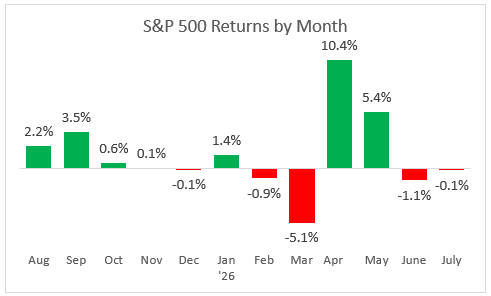
Zoom out to twelve months
July is now history, and it ended with a loss of 0.1%. It would have been a good time to take the month off. You wouldn’t have missed much.
author compilation
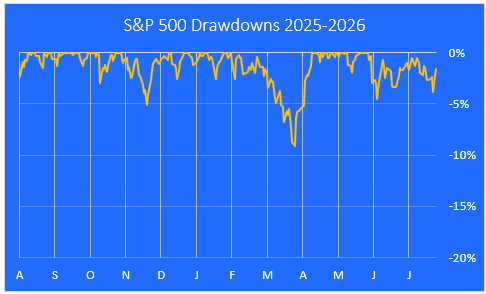
S&P 500 drawdowns
After last week’s 1% gain, we are now 1.6% below our last all-time closing high. This past week, the dip buyers showed up. The market hasn’t been down more than 5% since March.
author compilation
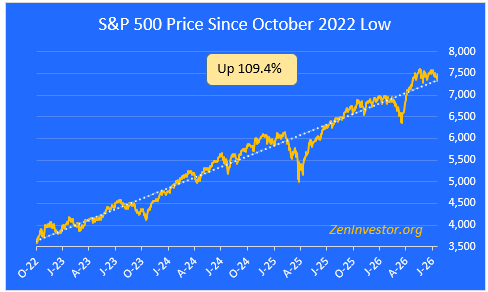
A look at the bull run since 2022.
We are up 109.4% since the bottom of the 2022 bear market. As the market continues to trade sideways, we are getting closer to the long-term regression line.
ZenInvestor.org
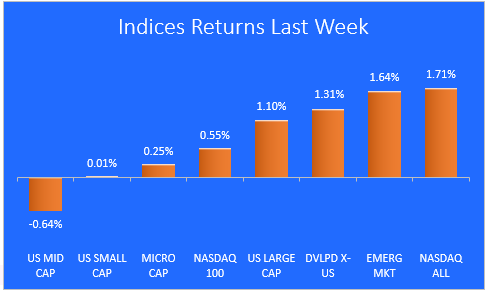
Major index performance last week
With the strong rally from the Magnificent 7 stocks last week, the Nasdaq index was leading the pack. Interesting to me was the performance of the Nasdaq 100, which underperformed the S&P 500 large-cap index. Small, mid, and micro-caps also underperformed.
author compilation
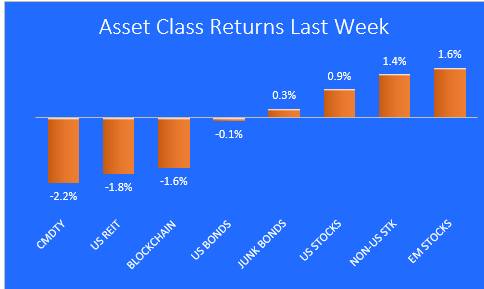
Major asset class performance last week
After taking a couple of weeks off, the non-US markets returned to lead the list of asset classes I track with this chart. Commodities, which had been hot, became a source of funds last week.
Author compilation
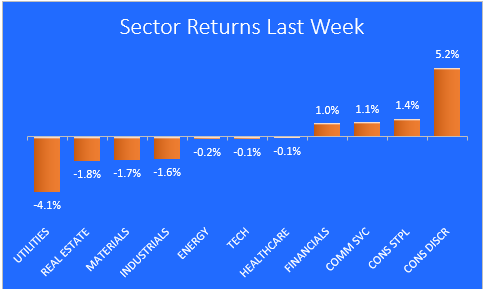
Equity sector performance last week
Consumer Discretionary—a group that has been quiet all year—has suddenly come to life, leading all equity sectors last week. It could just be noise, but it’s worth keeping an eye on the sector.
author compilation
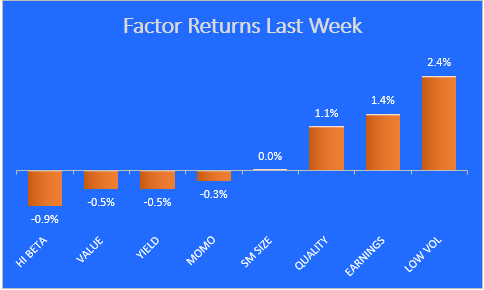
Factor returns last week
Low-volatility stocks were in favor last week, which doesn’t exactly fit for a risk-on market. High beta stocks were sold off, and that is another counterintuitive move.
author compilation
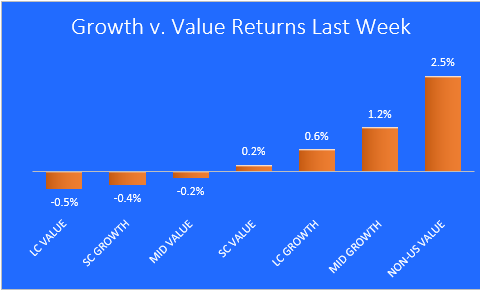
Growth vs. Value returns last week
The clear leader among the growth vs. value race was the non-US value category. Prior to last week, it was non-US growth that was outperforming.
author compilation
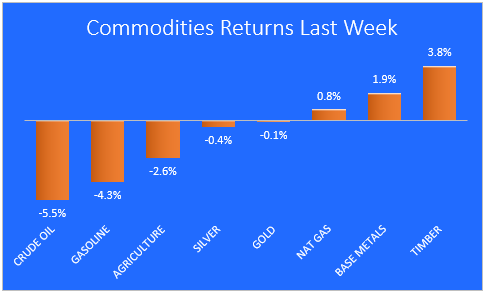
Commodity returns last week
Timber led the way higher in the commodities group, as home construction picked up slightly.
author compilation
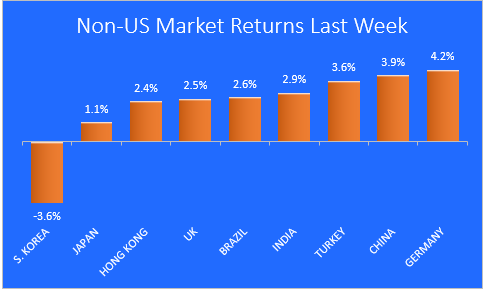
Non-U.S. markets last week
Germany led the major countries last week, while S. Korea continued its recent selloff.
author compilation
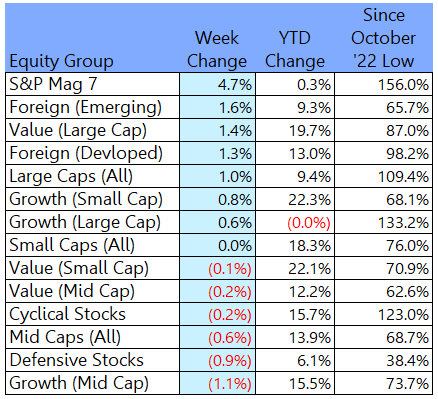
Equity group performance last week
Here we can see how strong the Mag 7 cohort was last week.
author compilation
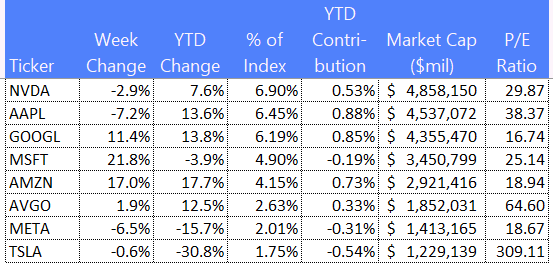
The S&P Mag 7+
Alphabet (GOOG) (GOOGL) delivered a blowout earnings report that decisively beat Wall Street expectations, driven almost entirely by AI-powered growth in Google Cloud and renewed strength in their search business. Meta Platforms (META) sold off on weaker numbers and forward guidance.
Author compilation
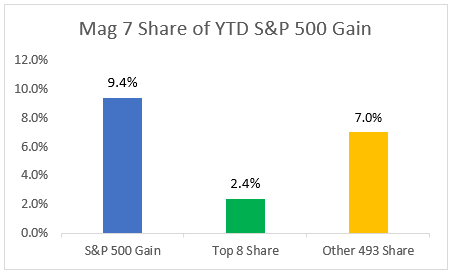
The S&P Top 7+ Share of Gains.
Even with last week’s surge, the Mag 7 is still behind the other 493 stocks in the S&P 500 on a year-to-date basis.
Author compilation
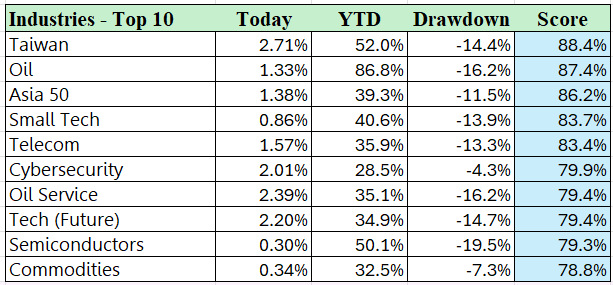
The ten best-performing ETFs
For this table, I use a different approach. I assign a weighting to each of the three performance numbers (the middle three columns in the chart below) and come up with a blended score. In order for an ETF to make this list, it must have a combination of all three factors—today's performance (lowest weighting), YTD performance (highest weighting), and the drawdown from the ETF's 52-week high (the tiebreaker).
Author compilation
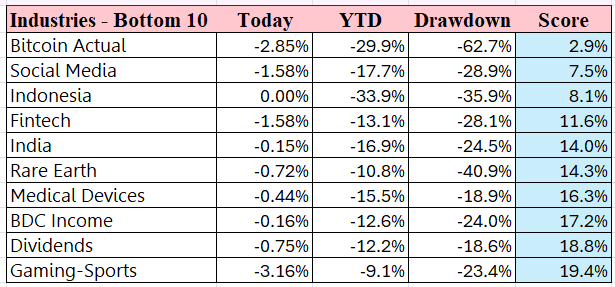
The ten worst-performing ETFs
Bitcoin continues to struggle, remaining in last place among the ETFs that I track.
Author compilation
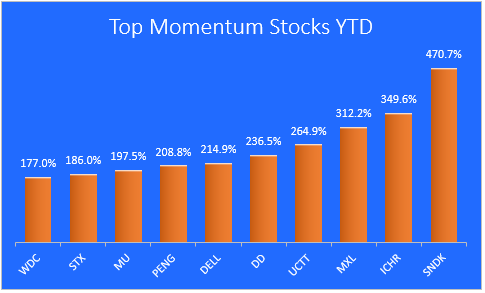
The ten best-performing momentum stocks YTD
Two new names have muscled their way into the top 10 momentum stock list—Iridium Communications (IRDM) and Corcept Therapeutics (CORT). The #1 momentum stock for much of the year, Sandisk (SNDK), is now in a bear market. In fact, 7 of the 10 stocks in this chart are in bear markets.
Author compilation
Final thoughts
It was a strong week—up 4 out of 5 days and gaining 1% for the week. The Mag 7 led a tech rebound that included software and hardware. It was good to see Consumer Discretionary moving sharply higher because that supports the narrative of a market that is broadening out beyond just the Magnificent 7.
The fighting in the Middle East tapered off somewhat last week, which allowed oil and gas prices to come down. But the main event was the Fed’s decision to leave rates untouched this month. The market didn’t like that, perhaps because investors are more concerned about bringing inflation down than Chair Warsh seems to be.
To recap the YTD action, investors were:
- Buying Nasdaq stocks and selling small and mid-caps
- Buying non-US stocks and selling commodities and REITs
- Buying big tech and selling energy
- Buying low volatility and selling high beta
- Buying value and selling growth
- Buying timber and selling crude oil
- Buying Germany and selling S. Korea
- Buying Microsoft (MSFT) and selling Alphabet


