

Sundry Photography/iStock Editorial via Getty Images
By Khaveen Jey, CFA, FMVA, Portfolio Manager @ Khaveen Investments & Nicholas Tan, Investment Research Analyst @ Khaveen Investments
In our previous analysis of Palo Alto (PANW) vs. Fortinet (FTNT), we determined that Fortinet was the better cybersecurity company based on revenue breakdown and performance, profitability, and valuation. Recently, both Palo Alto and Fortinet exceeded our previous price targets. Additionally, as of 9 July, we also found that Palo Alto (78%) and Fortinet (102%) stock prices have increased significantly YTD, with one of the reasons possibly due to AI-related cybersecurity threat developments.
In terms of a higher price target for Palo Alto, Morgan Stanley (MS) “noted that frontier AI is compressing attack timelines and increasing the importance of automated, identity-based detection and response, which is likely to accelerate spending.” According to SoSafe, "87% of organisations across the globe report AI-driven cyberattacks in the last year", highlighting a growth opportunity for cybersecurity companies to protect against AI-driven threats, such as Palo Alto and Fortinet.
UBS (UBS) also reported that the cybersecurity market is expected to grow by 12.5% this year, supported by AI-related cybersecurity attacks. Due to Palo Alto and Fortinet's large increases in stock price and the growth potential for protecting against AI-related cybersecurity threats, we evaluate which company is better positioned to capture the emerging AI cybersecurity opportunity.
We first analyze which company has the most justifiable valuation ratios. We then evaluate which company has the better security portfolio to protect against AI. We lastly assess which company is building a stronger AI security position through acquisitions and development partnerships.
Fortinet's Valuation Ratios More Justifiable Than Palo Alto's
P/S
Seeking Alpha, Company Data, Khaveen Investments
* Q2 2026 TTM is ending on 22 June 2026
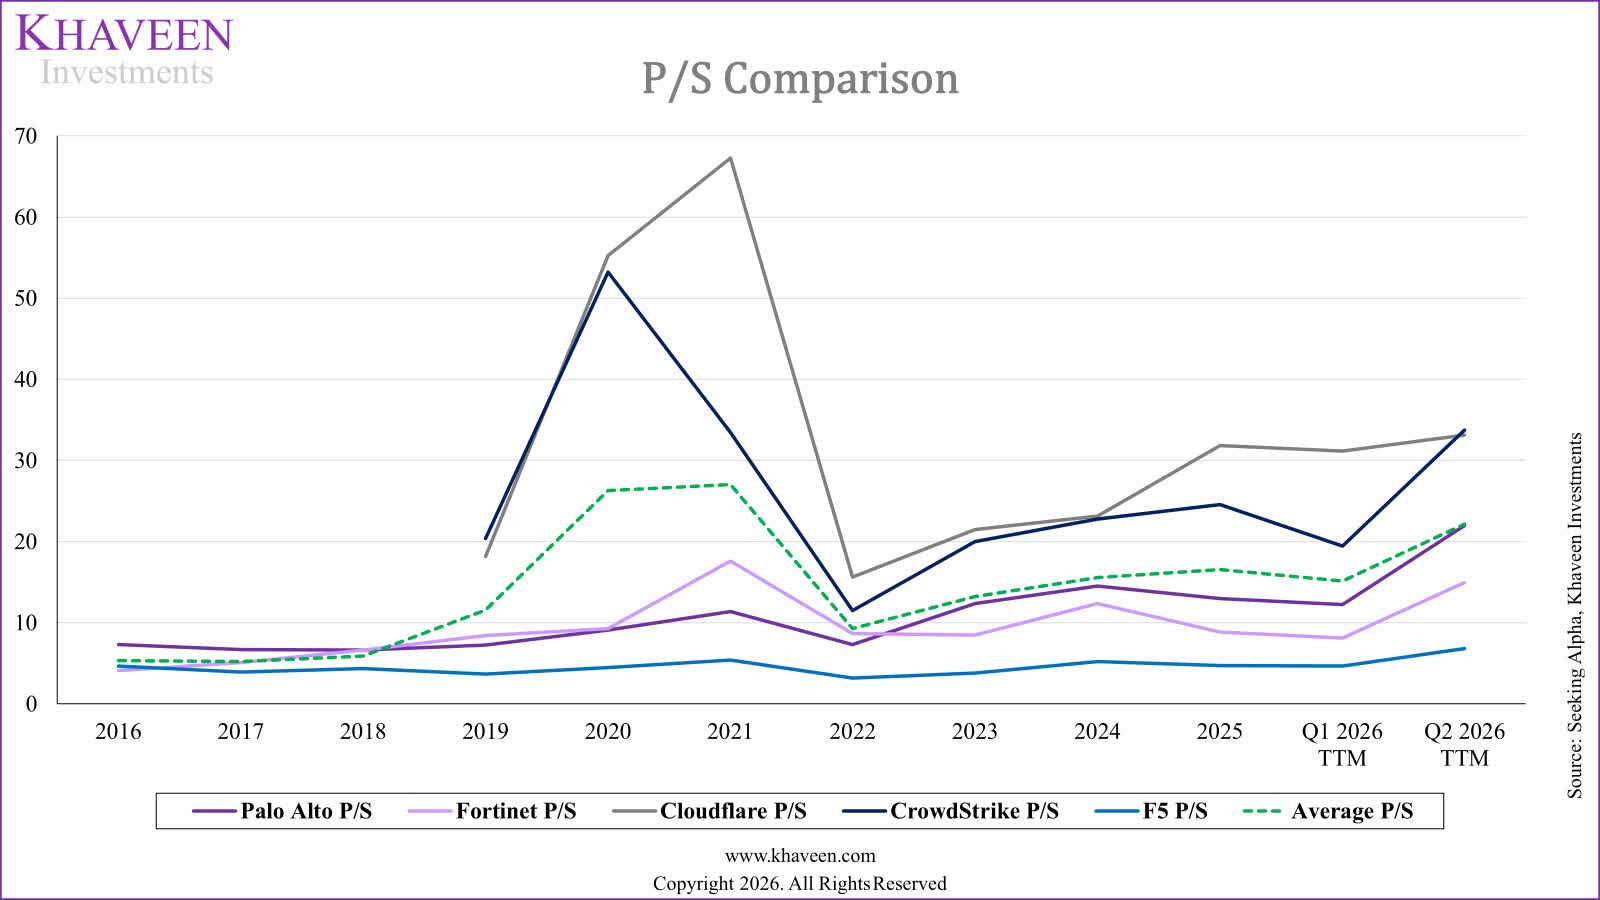
To analyze which company has more justifiable valuation ratios, we compile Palo Alto's and Fortinet's P/S ratios alongside the top cybersecurity companies' P/S ratios. Based on the chart above, both Palo Alto and Fortinet P/S initially increased from 2016 to 2021, before declining in 2022. Palo Alto and Fortinet P/S then climbed from 2022 to 2024, declined slightly to Q1 2026 TTM, and then grew in Q2 2026 TTM.
Similar to other companies, the industry P/S also climbed in Q2 2026 TTM. We also see that from 2019 to Q2 2026 TTM, both Palo Alto and Fortinet P/S were lower than the average P/S, which can indicate that both companies are priced cheaper than the industry average. Noticeably, between 2023 and Q2 2026 TTM, Palo Alto's P/S is higher than Fortinet's P/S
Both Palo Alto's and Fortinet's P/S declined slightly in Q1 2026 TTM, which we previously highlighted in our analysis of HubSpot (HUBS), as this could be related to AI fears, whereby AI could potentially replace cybersecurity companies' software. In relation to the cybersecurity stocks' decline in March 2026, Goldman Sachs (GS) reported that “new agentic AI tools for software development in recent months have fueled concerns that AI could in turn “eat” software, triggering a sharp re-rating of the software sector as well as other sectors vulnerable to AI disruption.”
After the decline, we see that both Palo Alto and Fortinet's P/S suddenly increased in Q2 2026 TTM, which could be related to potential cybersecurity threats from AI. As indicated above, Morgan Stanley indicated that AI was increasing potential cybersecurity threats. Palo Alto also highlighted that "the latest advancements at the AI frontier have increased the level of urgency around cybersecurity", while in Fortinet's Q1 2026 earnings transcript, they reported that “AI is expanding the attack surface and increasing performance requirements, which is driving higher and more durable security spend across networking, SASE, and security operations.”
Using AI for cyberattacks can make it more difficult to detect potential threats, such as through fake AI identities and adaptive malware. CrowdStrike (CRWD) also reported an “89% increase in attacks by AI-enabled adversaries”, highlighting the growth in AI-related cyberattacks. We thus believe the increase in concerns and issues regarding AI-related cybersecurity threats could be a reason for the higher stock prices in Q2 2026 TTM.
Seeking Alpha, Company Data, Khaveen Investments
* Q2 2026 TTM is ending on 22 June 2026
* Financials are ending the calendar year
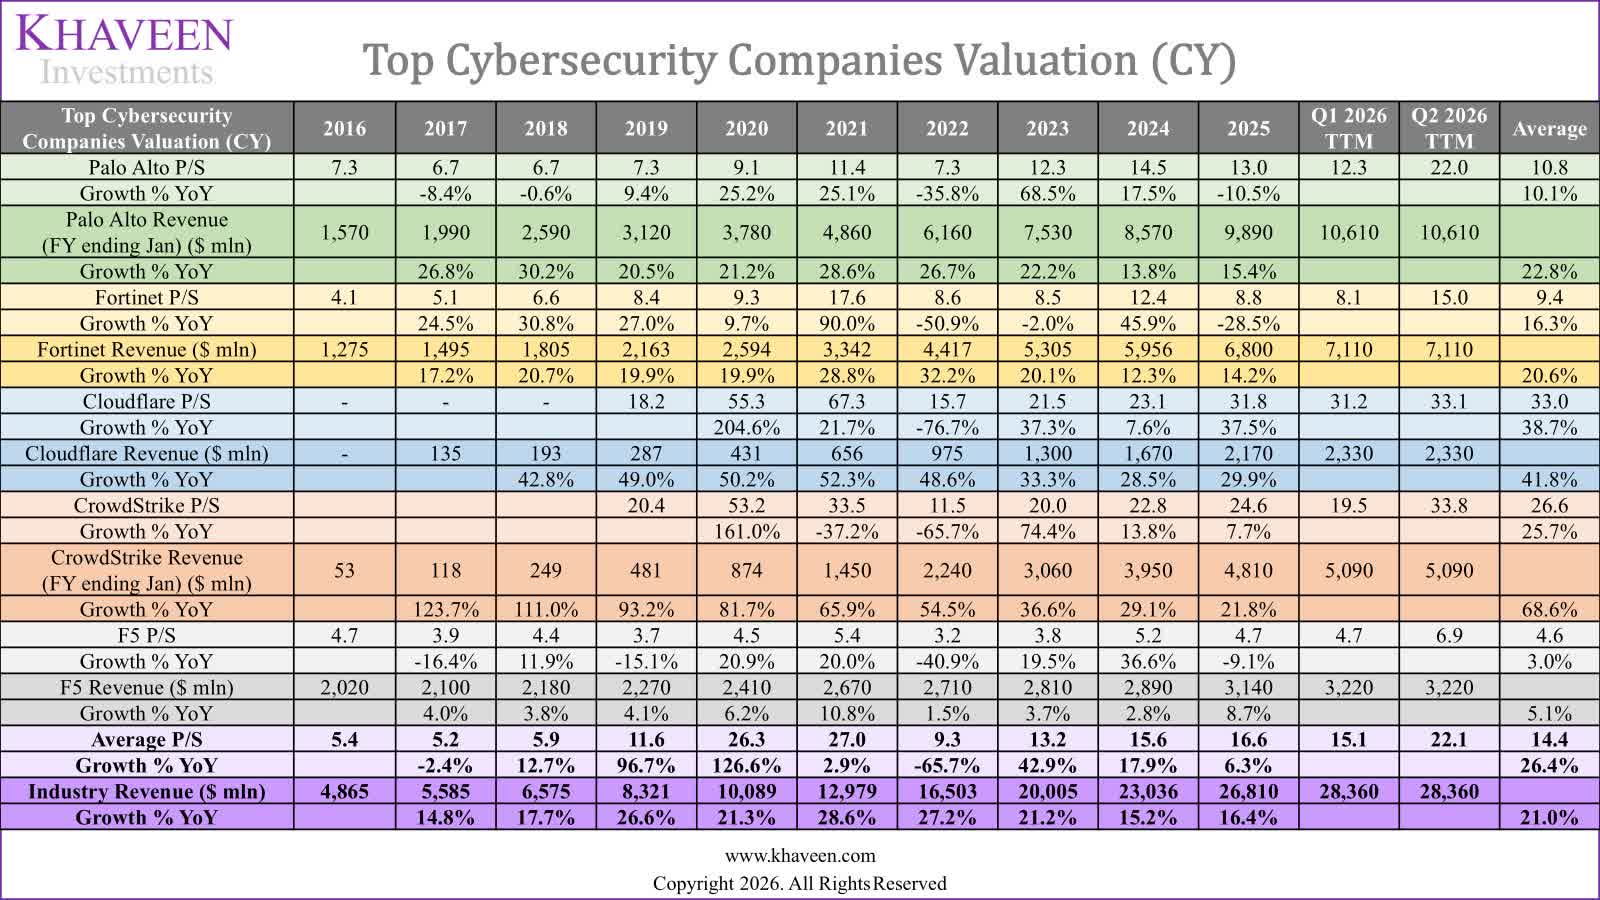
We further compile Palo Alto's and Fortinet's revenue to compare against their P/S ratio and determine whether Palo Alto's or Fortinet's P/S is more justified. We see that despite both Palo Alto (22.8%) and Fortinet having similar revenue growth rates (20.6%), Palo Alto's P/S (10.1%) is growing more slowly than Fortinet's P/S (16.3%). This means that there could be other reasons apart from revenue growth that can explain the difference in P/S growth, which we will examine in the following point.
Apart from that, Palo Alto's P/S and Fortinet's P/S have lower P/S growth than the industry (26.4%) despite having relatively similar revenue growth to the industry (21.0%). This can indicate that both Palo Alto and Fortinet's lower P/S growth is not explained by revenue growth, since their revenue growth is similar to the industry's.
As such, the P/S growth difference could come from other factors. In Q2 2026 TTM, Fortinet's P/S (15.0) is also 32% lower than Palo Alto's (22.0) despite similar historical revenue growth, which could indicate there is more potential upside to Fortinet's stock than Palo Alto's and that Fortinet's is more justifiable, since both companies have relatively similar revenue growth rates.
P/E
Seeking Alpha, Company Data, Khaveen Investments
* Q2 2026 TTM is ending on 22 June 2026
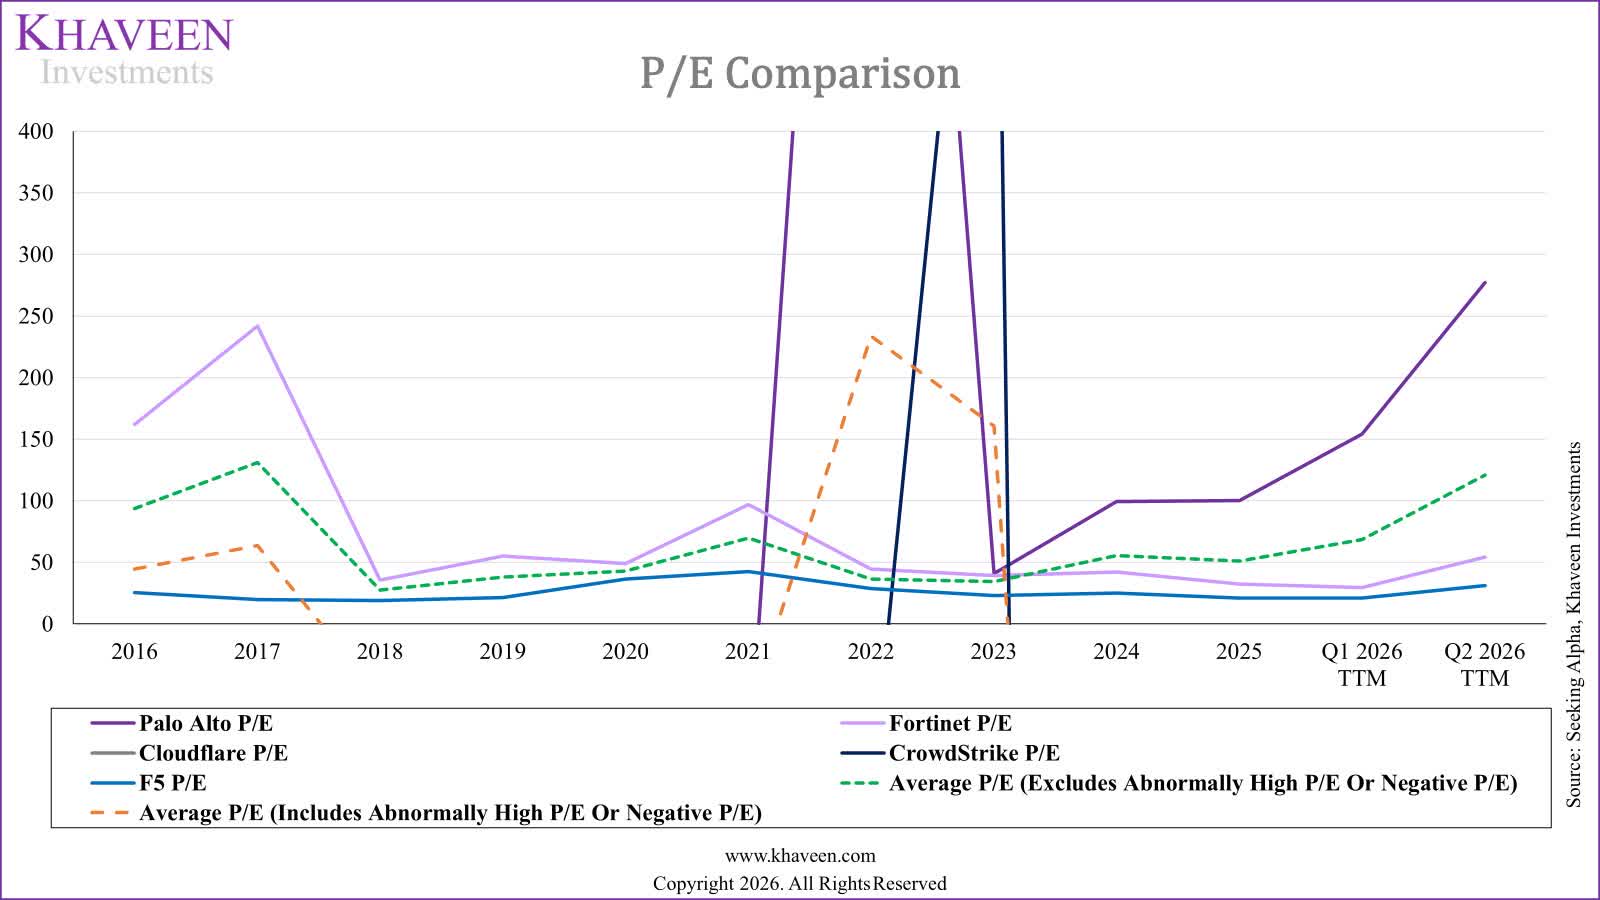
After evaluating P/S ratios, we further compile Palo Alto's and Fortinet's P/E ratios alongside those of the top cybersecurity companies for comparison. Based on the chart above, Palo Alto's P/E from 2022 to Q2 2026 TTM was above the average P/E (excluding abnormally high P/E or negative P/E), whereas Fortinet's P/E was below the average between 2024 and Q2 2026 TTM.
Importantly, while Fortinet's P/E is lower than the average P/E (excluding abnormally high P/E or negative P/E), and Palo Alto's P/E is higher, Fortinet's P/E and Palo Alto's P/E are difficult to compare against the industry average P/E that includes abnormally high P/E or negative P/E, as the industry's average P/E (including abnormally high P/E or negative P/E) is negative in years such as from 2018 to 2021 and also from 2024 to Q2 2026 TTM. The industry's average P/E (including abnormally high P/E or negative P/E) is also much more volatile than the industry's average that excludes abnormally high P/E or negative P/E, which makes it difficult to analyze against Palo Alto's and Fortinet's P/E.
Compared to their respective P/S, both companies' P/E ratios were also much more volatile. Additionally, both companies' P/E ratios climbed in Q2 2026, with Palo Alto's rising much higher than Fortinet's.
Seeking Alpha, Company Data, Khaveen Investments
* Q2 2026 TTM is ending on 22 June 2026
* Financials are ending the calendar year
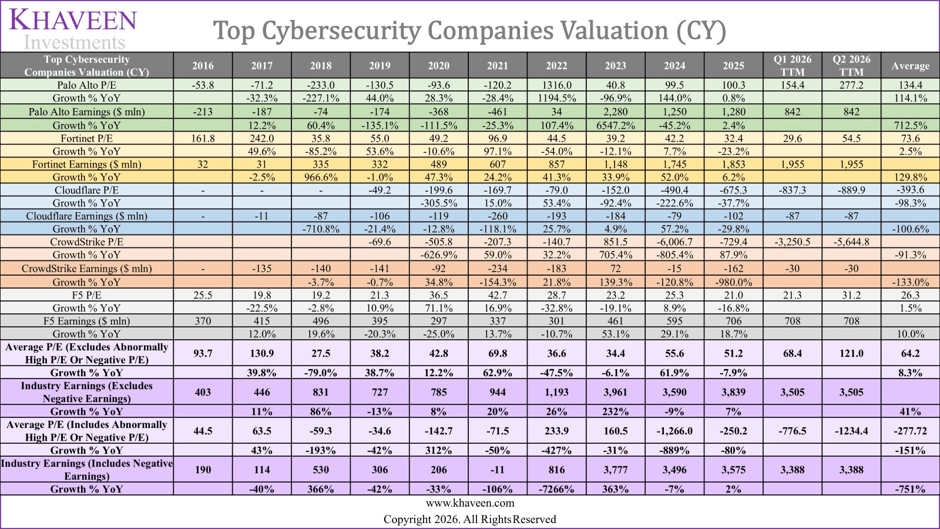
We then compile the net earnings of the top cybersecurity companies to determine whether Palo Alto's and Fortinet's P/E ratios are more reasonable than each other's and the industry average. Based on the table above, we find that it is difficult to compare the P/E growth trends between Palo Alto's P/E growth (114.1%) and Fortinet's P/E growth (2.5%). This is mainly because both companies' P/E growth is quite volatile, which skews the average growth.
Comparing the raw earnings increase rather than the growth % YoY, we see that Fortinet's earnings have grown from $32 million in 2016 to $1.85 billion in 2025, whereas Palo Alto's earnings climbed from -$213 million to $1.28 billion across the same period. This indicates that Fortinet's earnings have increased more than Palo Alto's earnings.
Importantly, in Q2 2026 TTM, Fortinet's P/E (54.5) is 80% lower than Palo Alto's (277.2), despite having much higher earnings than Palo Alto, indicating that Fortinet's P/E could be much more reasonable than Palo Alto's P/E. This is because Fortinet's lower P/E ratios can show Fortinet trades at a cheaper multiple than Palo Alto. Additionally, Fortinet's P/E in Q2 2026 TTM is lower than the industry average P/E that excludes abnormally high P/E or negative P/E, while Palo Alto's P/E is higher.
However, similar to the issue in P/S, we find it difficult to compare both of their P/E against the average industry P/E that includes abnormally high P/E or negative P/E, mainly because Cloudflare's and CrowdStrike's negative earnings distort their own respective P/E. In relation to P/S, Fortinet's strong earnings growth could also be a reason that Fortinet's P/S has outpaced Palo Alto's P/S despite both companies having similar revenue growth rates.
P/FCF
Seeking Alpha, Company Data, Khaveen Investments
* Q2 2026 TTM is ending on 22 June 2026
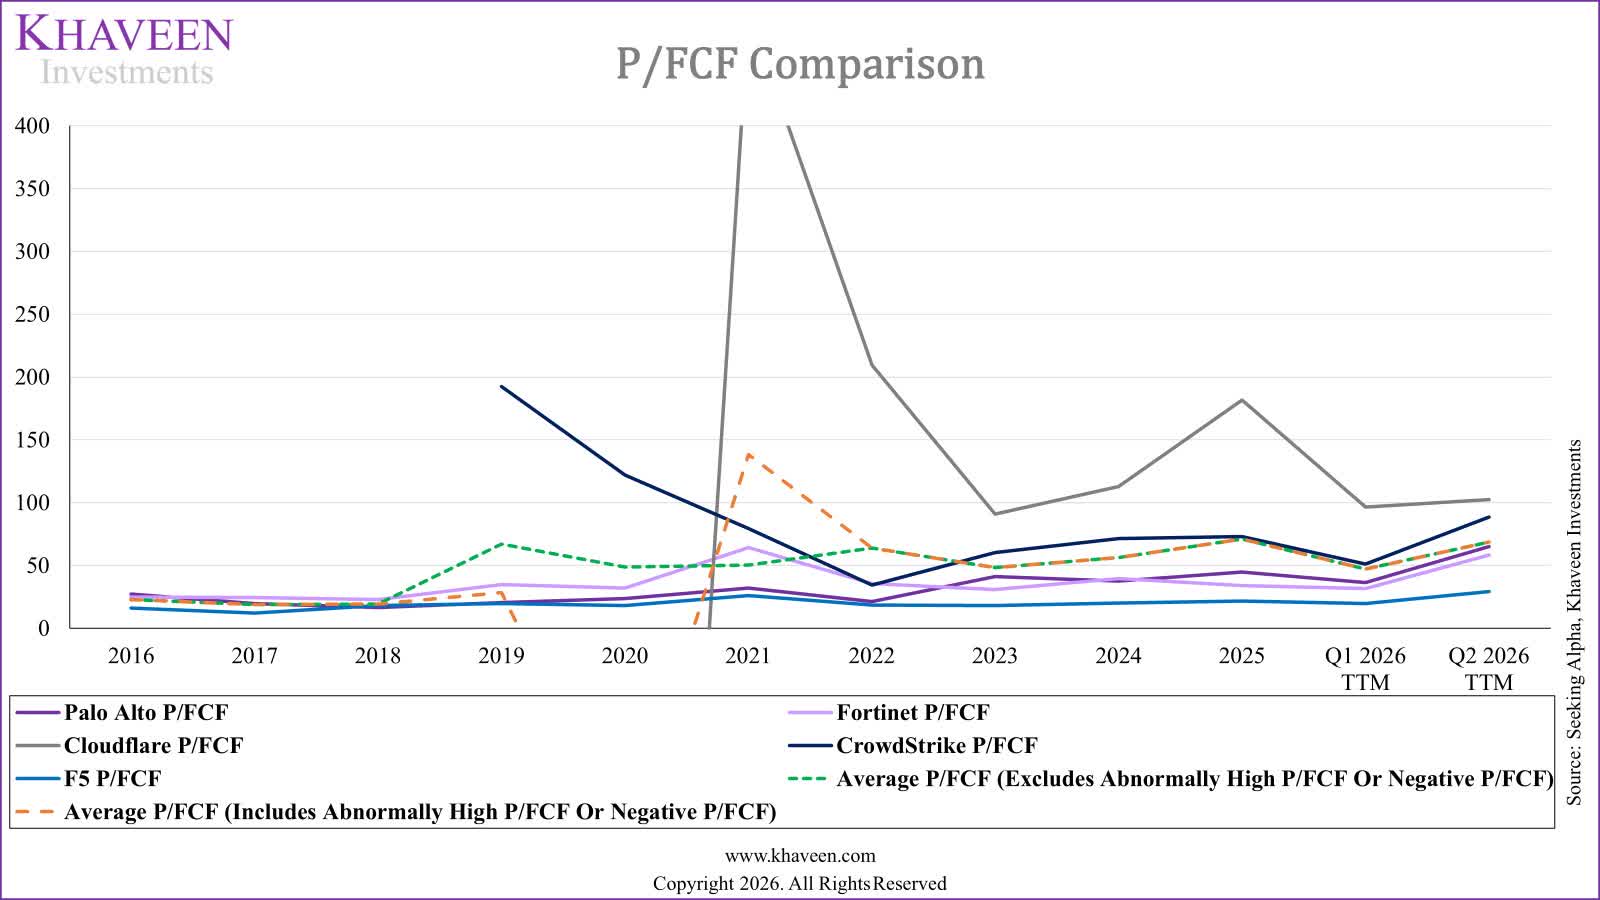
We then compile both Palo Alto's and Fortinet's alongside the top cybersecurity companies' P/FCF to compare them against each other. We first find that the top companies' P/FCF are less volatile than P/E but more volatile than P/S. Between 2023 and Q2 2026 TTM, both Palo Alto and Fortinet's P/FCF have trended alongside each other. From 2023 onwards, both companies' P/FCF have also been lower than the industry P/FCF, which could potentially suggest both companies trade at cheaper multiples than the industry average. However, to better analyze whether this could be the case, we then compare both companies' FCF growth against the industry growth.
Seeking Alpha, Company Data, Khaveen Investments
* Q2 2026 TTM is ending on 22 June 2026
* Financials are ending the calendar year
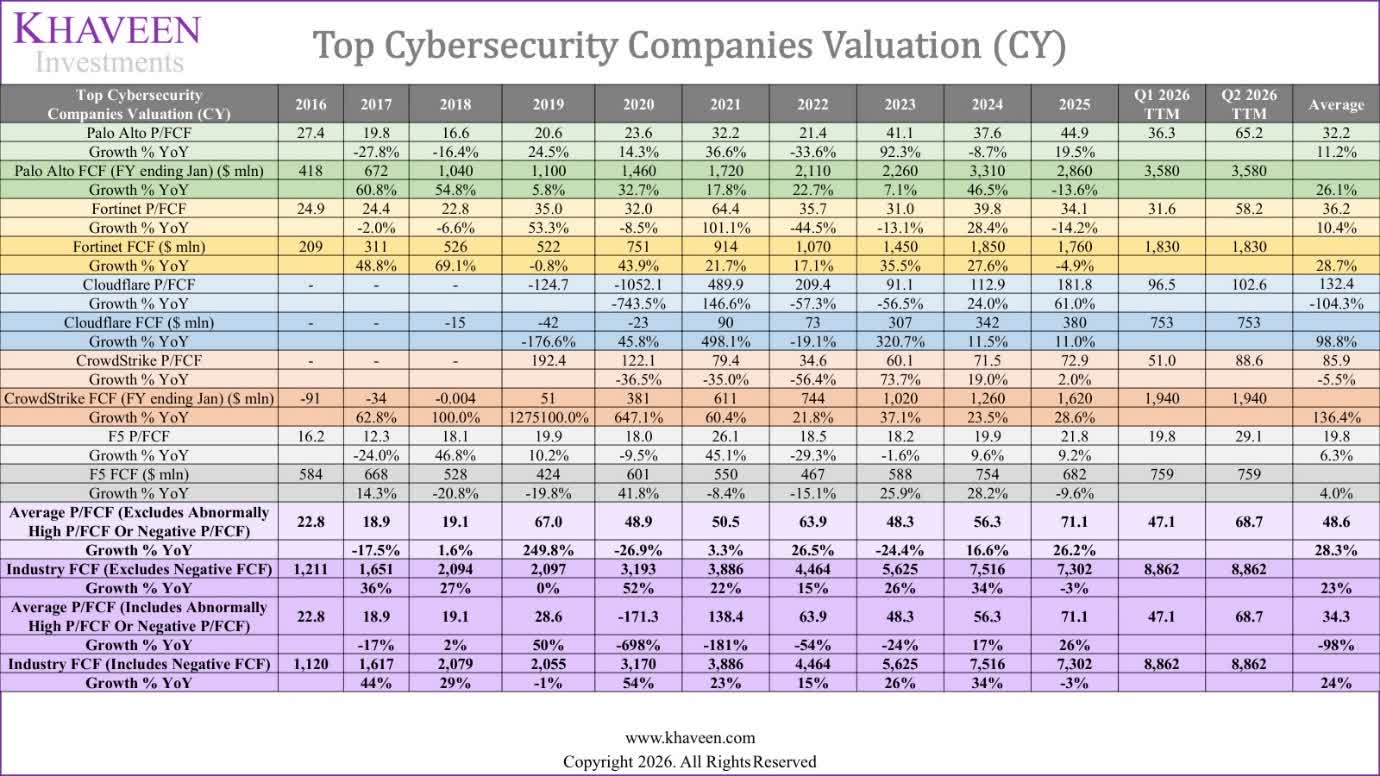
We also compiled both Palo Alto's and Fortinet's alongside the top cybersecurity companies' FCF to determine whether Palo Alto's or Fortinet's P/FCF is more justified. Based on the table above, Fortinet's P/FCF growth (10.4%) is relatively similar to Palo Alto's P/FCF growth (11.2%), with both having similar FCF growth (28.7% and 26.1%). Both Palo Alto's P/FCF and Fortinet's P/FCF growth are slower than the industry average P/FCF that excludes abnormally high P/FCF or negative P/FCF (28.3%), but their FCF growth is faster than the industry's FCF that excludes negative P/FCF (23.1%).
In Q2 2026 TTM, both companies' P/FCF was also lower than the industry average, which included or excluded negative P/FCF and abnormally high P/FCF, suggesting that both stocks could be cheaper than the industry based on P/FCF. Importantly, we find that Palo Alto's P/FCF (65.2) is 12% higher than Fortinet's P/FCF (58.2) for Q2 2026 TTM, which indicates Fortinet is slightly cheaper than Palo Alto on this multiple.
Khaveen Investments
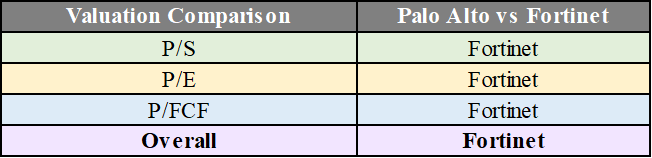
Overall, we determine that Fortinet's valuation ratios are more justifiable than Palo Alto's. We assessed that Fortinet's P/S is more justifiable than Palo Alto's, as, despite similar revenue growth, Fortinet's Q2 2026 TTM P/S is 32% lower than Palo Alto's. Fortinet's P/E is also more justifiable than Palo Alto's, as earnings have grown more than Palo Alto's over the same period, and Fortinet's P/E is also 80% lower than Palo Alto's. Apart from that, Fortinet's P/FCF is also lower and more justifiable than Palo Alto's, as Fortinet's P/FCF is lower despite relatively similar growth.
Fortinet's Stronger Than Palo Alto In Product Breadth, Network Security, And Competitive Metrics But Weaker In Patents
Product Breadth
Company Data, Khaveen Investments
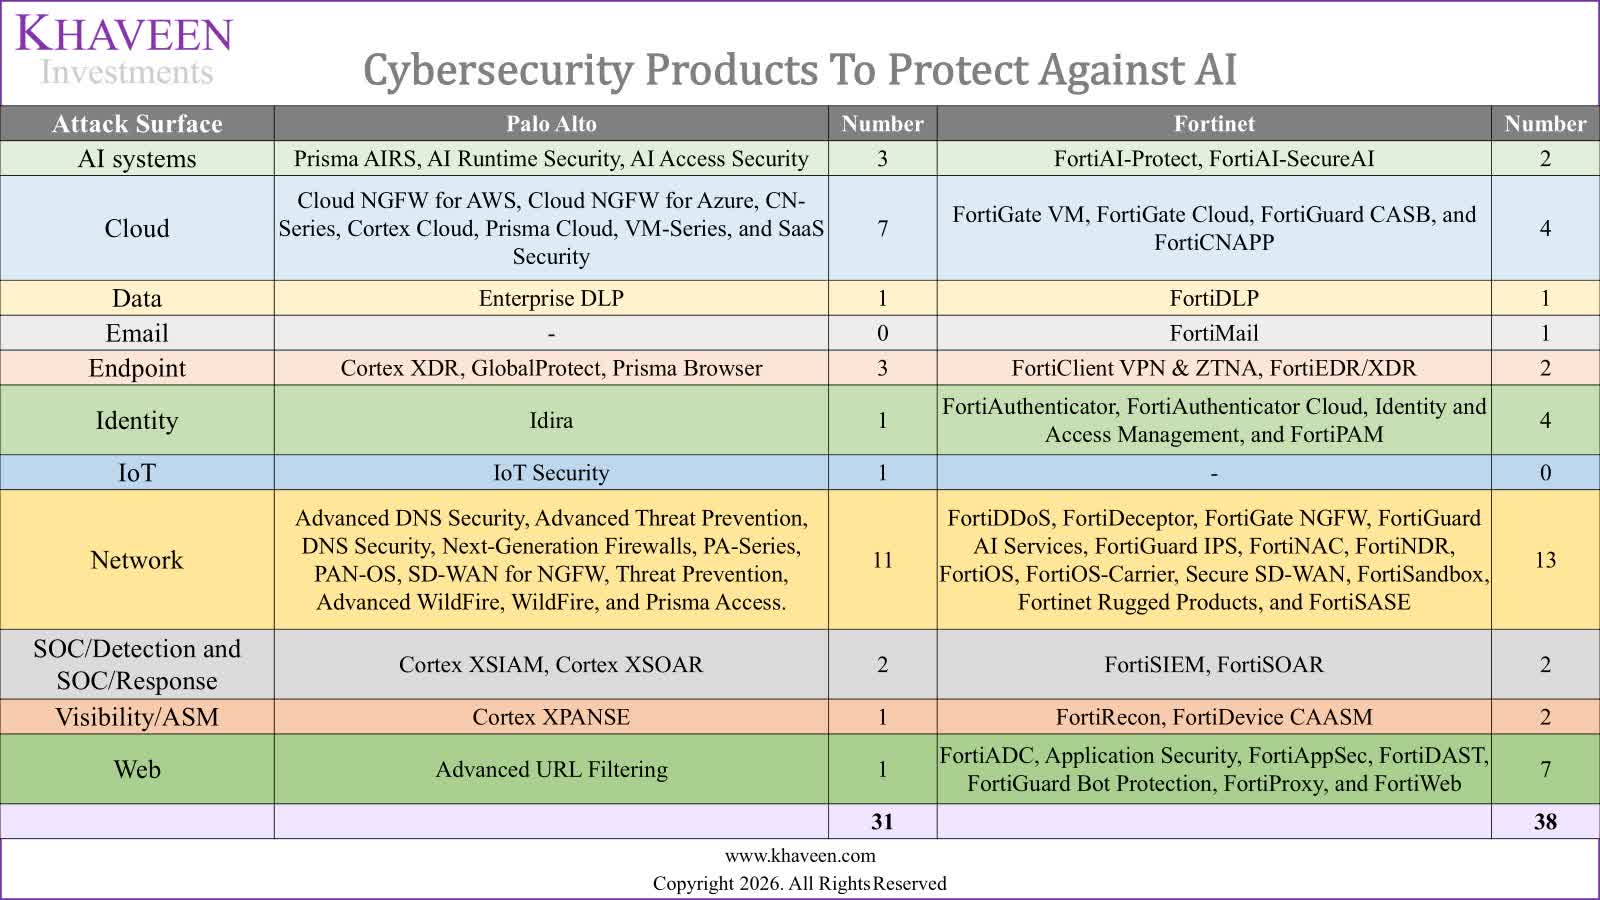
After determining that Fortinet's valuation ratios are more justifiable than Palo Alto's, we then compare their product breadth that protects against AI-related cybersecurity threats. Based on the table above, Palo Alto (31) has less product breadth than Fortinet (38), which shows that Fortinet can tackle a broader range of AI-related cybersecurity threats. Palo Alto also does not have any dedicated products for Email, as compared to Fortinet.
Palo Alto also has products in IoT (1 vs. 0) and more products in Endpoint (3 vs. 2), Cloud (7 vs. 4), and AI systems (3 vs. 2) than Fortinet, which can indicate that Palo Alto can serve customers in these areas more comprehensively. In other areas, Palo Alto has either the same number of products as or fewer products than Fortinet.
Network Security
Company Data, Khaveen Investments
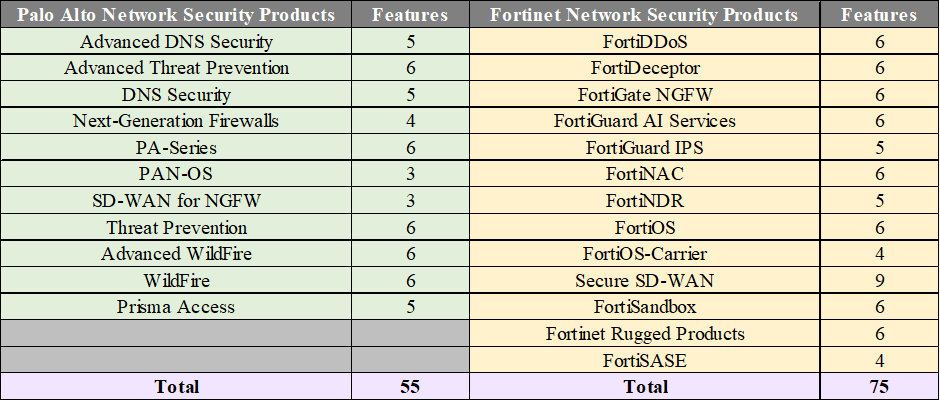
Since both companies have the highest number of products in network security, and as we highlighted in our previous analysis, both companies are market leaders in network security. We thus compile both companies' network security product features to better analyze which network security portfolio is more comprehensive in terms of features. We see that Fortinet (75) has 36% more features in network security than Palo Alto (55), meaning that Fortinet can serve customers' needs in network security more comprehensively than Palo Alto.
In terms of direct product comparison, Fortinet's FortiGate NGFW has 3 more features than Palo Alto's Next-Generation Firewalls. Fortinet's FortiOS and Secure SD-WAN also have more features than PAN-OS and SD-WAN for NGFW, whereas Palo Alto's WildFire and Advanced WildFire (12 total), as well as Prisma Access, have more features than FortiSandbox and FortiSASE.
Competitive Metrics
Cyber Ratings, Company Data, Khaveen Investments
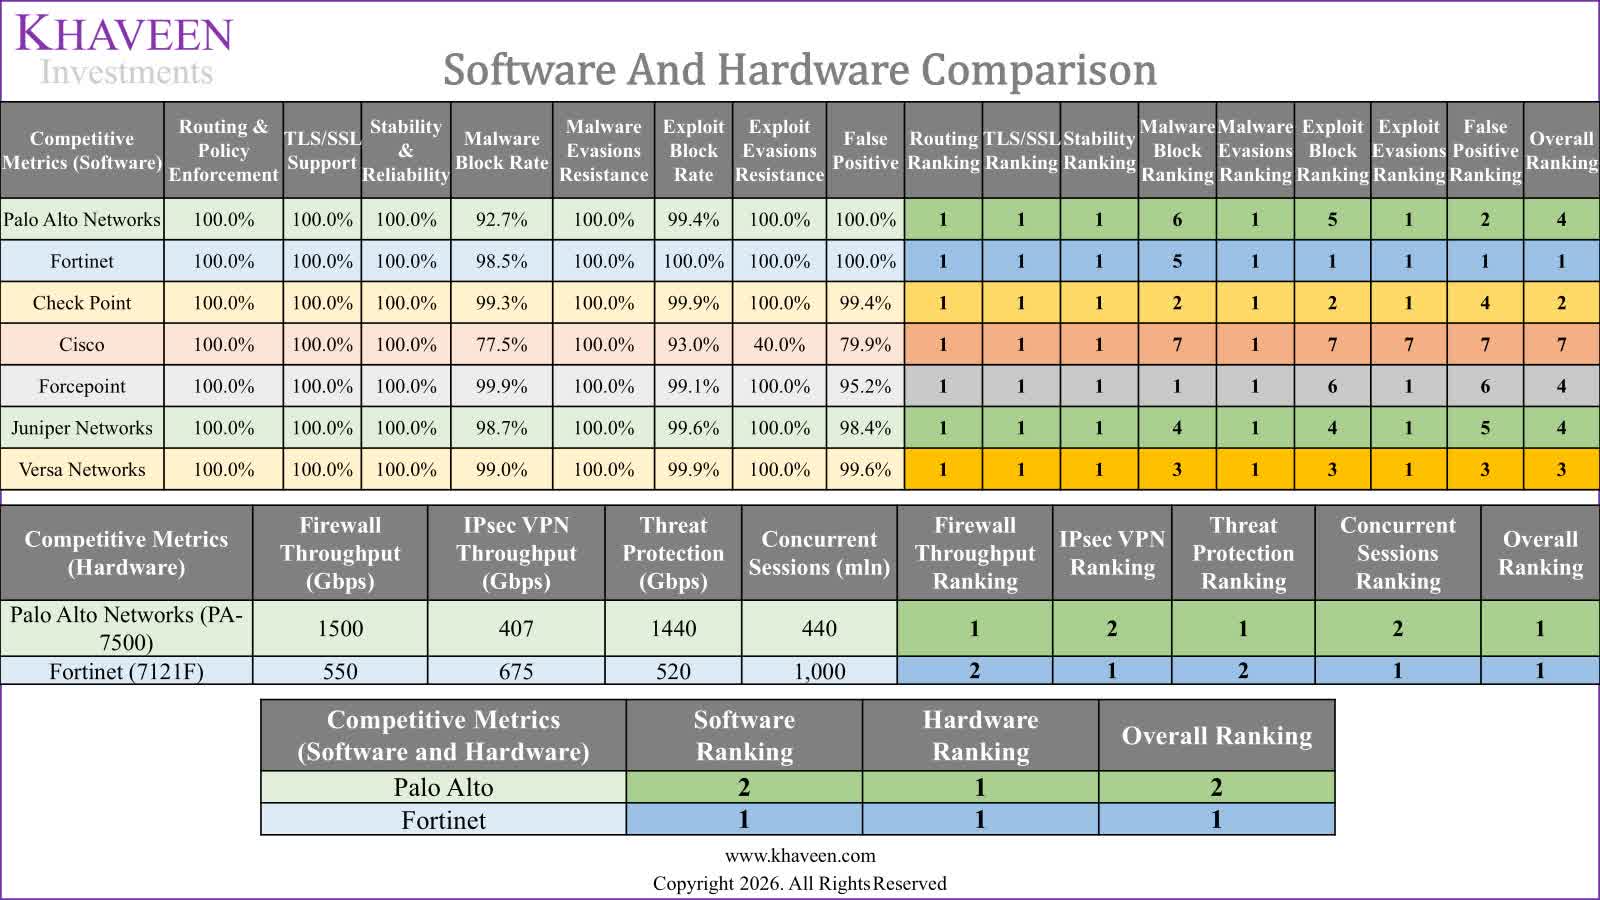
After examining product breadth, we compile and compare both companies' Enterprise Firewall (software) and Next-Generation Firewall (NGFW) hardware competitive metrics to determine which company is more competitive.
Based on the table above, Fortinet's software ranks best overall, with the highest ranking in all metrics except for Malware Block (5th), whereas Palo Alto's software (4th) ranks worse than Fortinet's. In hardware, both companies are tied, with Palo Alto being better in Firewall Throughput and Threat Protection, and Fortinet being better in IPsec VPN and concurrent sessions. Across software and hardware, Fortinet is better overall than Palo Alto, mainly due to a higher software ranking.
Fortinet ranks best for exploit block ranking and is one of the reasons that Fortinet's software ranking is better than Palo Alto's (exploit block ranking, 5th). According to Fortinet, Fortinet indicated that its internal research team (FortiGuard Labs) had “860+ zero-day vulnerability discoveries attributed to the team – more than the next several competitors combined”, which means that Fortinet's internal research team could be the reason that Fortinet can discover more exploits than its competitors. After discovering the exploits, Fortinet then applies virtual patching to protect against these cybersecurity threats. As such, Fortinet's internal research team could be the reason for Fortinet's high exploit-block ranking.
AI-Patents
Crimson Insights
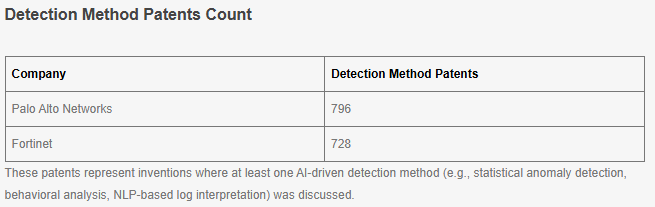
We then compile both companies' patents that specifically use AI to protect against cybersecurity threats. Based on the table above, Palo Alto (796) has 9% more AI-driven detection method patents than Fortinet (728), which means Palo Alto has more technological patents that use AI to protect against cybersecurity threats. This contrasts with their low number of products, as we have seen above, and it could be that Palo Alto uses more AI-detection patents for their products than Fortinet.
Crimson Insights
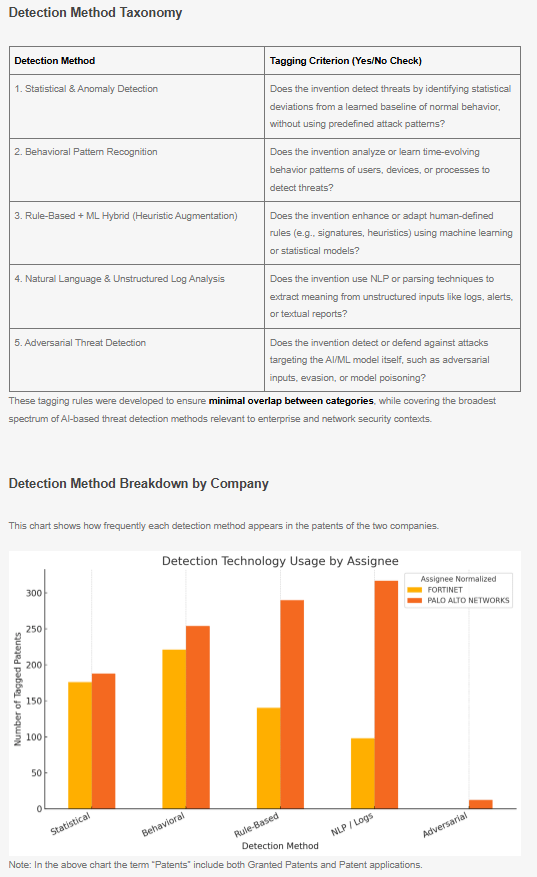
The AI-related patents are then categorized into Statistical, Behavioral, Rule-Based, Natural Language Processing (NLP) / Logs, and Adversarial. Based on the chart above, Palo Alto has a larger number of patents across all the detection technology usage breakdowns, with the biggest difference being in Rule-Based and NLP / Logs. This means that Palo Alto's patents are more comprehensive than Fortinet's.
Palo Alto also has Adversarial AI-driven detection patents, while Fortinet does not. This could potentially suggest that Palo Alto's patents can detect and defend against cybersecurity threats impacting AI models, while Fortinet is unable to.
However, this does not align with the current product breakdown, whereby Fortinet has a product (FortiAI-SecureAI) that should have patents for protecting LLMs. The main reason for this is that patents have 18 months before being published publicly, and so our source, which shows patented data from April 9, 2025, likely did not show FortiAI-SecureAI's (released April 8, 2025) patent, as the software could have been built within the 18 months before April 2025.
Non-AI Patents
Crimson Insights, Khaveen Investments
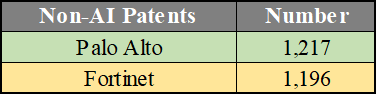
We also compile non-AI patents to compare both companies' patents. Based on the table above, Palo Alto has a slightly higher number of non-AI patents than Fortinet (1.8% higher), which indicates that Palo Alto's non-AI patents are more extensive than Fortinet's. We thus determine that, in terms of non-AI patents, Palo Alto edges out Fortinet.
Khaveen Investments
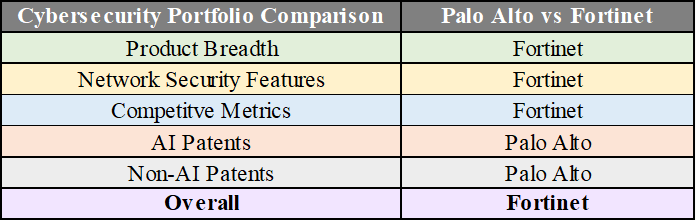
We determine that Fortinet has a more competitive cybersecurity portfolio to protect against AI-related cybersecurity threats, as Fortinet has a wider product breadth and more network security features than Palo Alto. Fortinet is also more competitive in terms of product metrics, mainly due to its higher software ranking. In contrast to product breadth, we determine that Palo Alto has a higher number of AI patents and non-AI patents than Fortinet, which could mean that Palo Alto's products have more patents despite a smaller product breadth.
Palo Alto With Larger AI-Related Acquisitions And Partnerships
Acquisitions
Company Data, Khaveen Investments
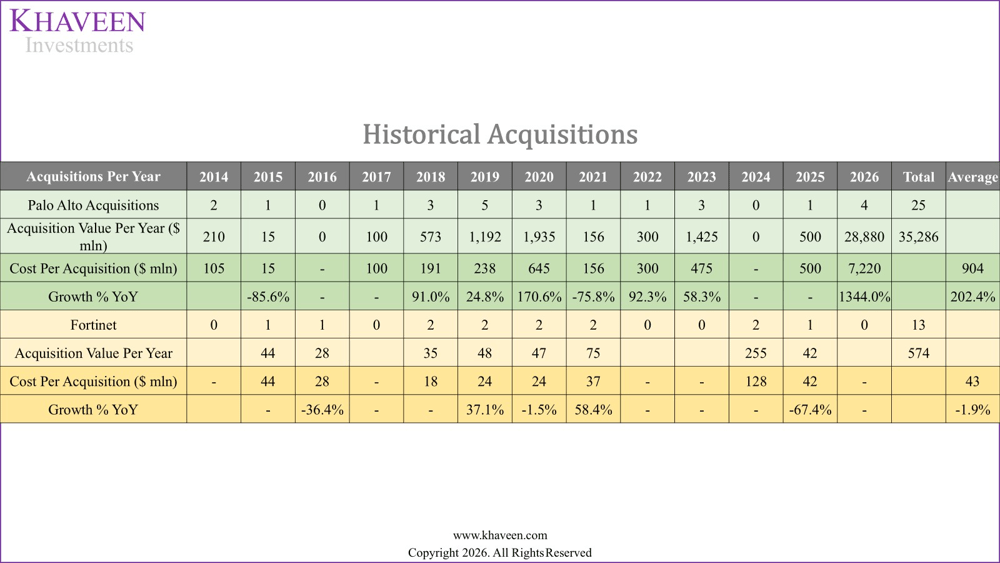
We compile both Palo Alto's and Fortinet's acquisitions to compare them against each other. From 2014 to 2026, Palo Alto (25) has nearly double Fortinet's acquisitions (13), with a 6,047% higher total acquisition cost than Fortinet. Palo Alto's cost per acquisition was also around 2,002% higher than Fortinet's, which shows that Palo Alto's average acquisition cost was much higher than Fortinet's.
Company Data, Khaveen Investments
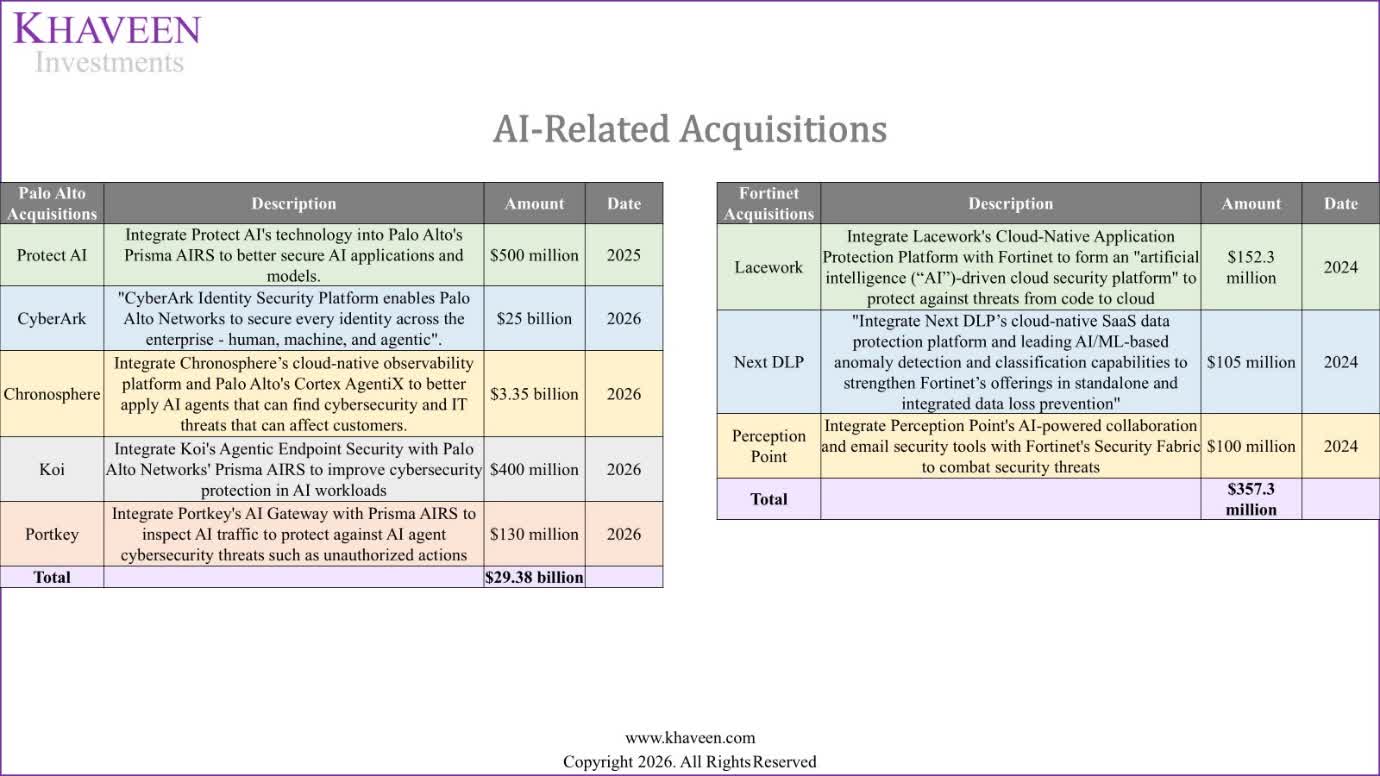
We further broke down their acquisitions into those that use AI-driven technologies to detect and protect against cybersecurity threats, to determine which company has more strategic acquisitions for improving AI security. Both companies have just started to buy AI cybersecurity companies (as early as 2024), which could suggest a shift in acquisition focus to AI. To add on, Palo Alto acquired more AI companies with a larger total amount than Fortinet.
In February 2026, Palo Alto completed its acquisition of CyberArk ($25 billion), which would enable Palo Alto to improve their ability to control what machine identities and AI agents are allowed to access. According to Palo Alto, machine identities outnumber human identities by 109 to 1, which highlights the importance of cybersecurity for machine identities. One reason that Palo Alto acquired CyberArk was that, before acquiring CyberArk, Palo Alto had no dedicated identity security product. After acquiring CyberArk and CyberArk's identity security product, Palo Alto unveiled the acquired identity product as Idira (announced 12 May 2026), enabling Palo Alto to compete with Fortinet in this area.
Palo Alto also acquired Chronosphere ($3.35 billion), whereby Chronosphere Telemetry Pipeline can be used to “filter low-value noise to reduce data volumes by 30% or more and has been shown to require 20x less infrastructure than legacy alternatives.” This can help customers' security operations to be more efficient. Furthermore, the planned integration of Chronosphere with Palo Alto can help customers to improve their usage of AI agents to automatically identify and resolve security issues. On the other hand, Fortinet's acquisition of Lacework increased its product portfolio, as Lacework's technology was used to build FortiCNAPP and improve Fortinet's product breadth competitiveness.
We also find that all of Fortinet's AI-related acquisitions happened in 2024, whereas most of Palo Alto's AI-related acquisitions were completed in 2026. The difference in timing could explain why Palo Alto's acquisitions and acquired technology that could have improved Palo Alto's software metric ranking in our second point did not, as our source data (Cyber Ratings) only had data until November 2025. This means that Palo Alto has not acquired or integrated the technology into its software.
Partnerships
Company Data, Khaveen Investments
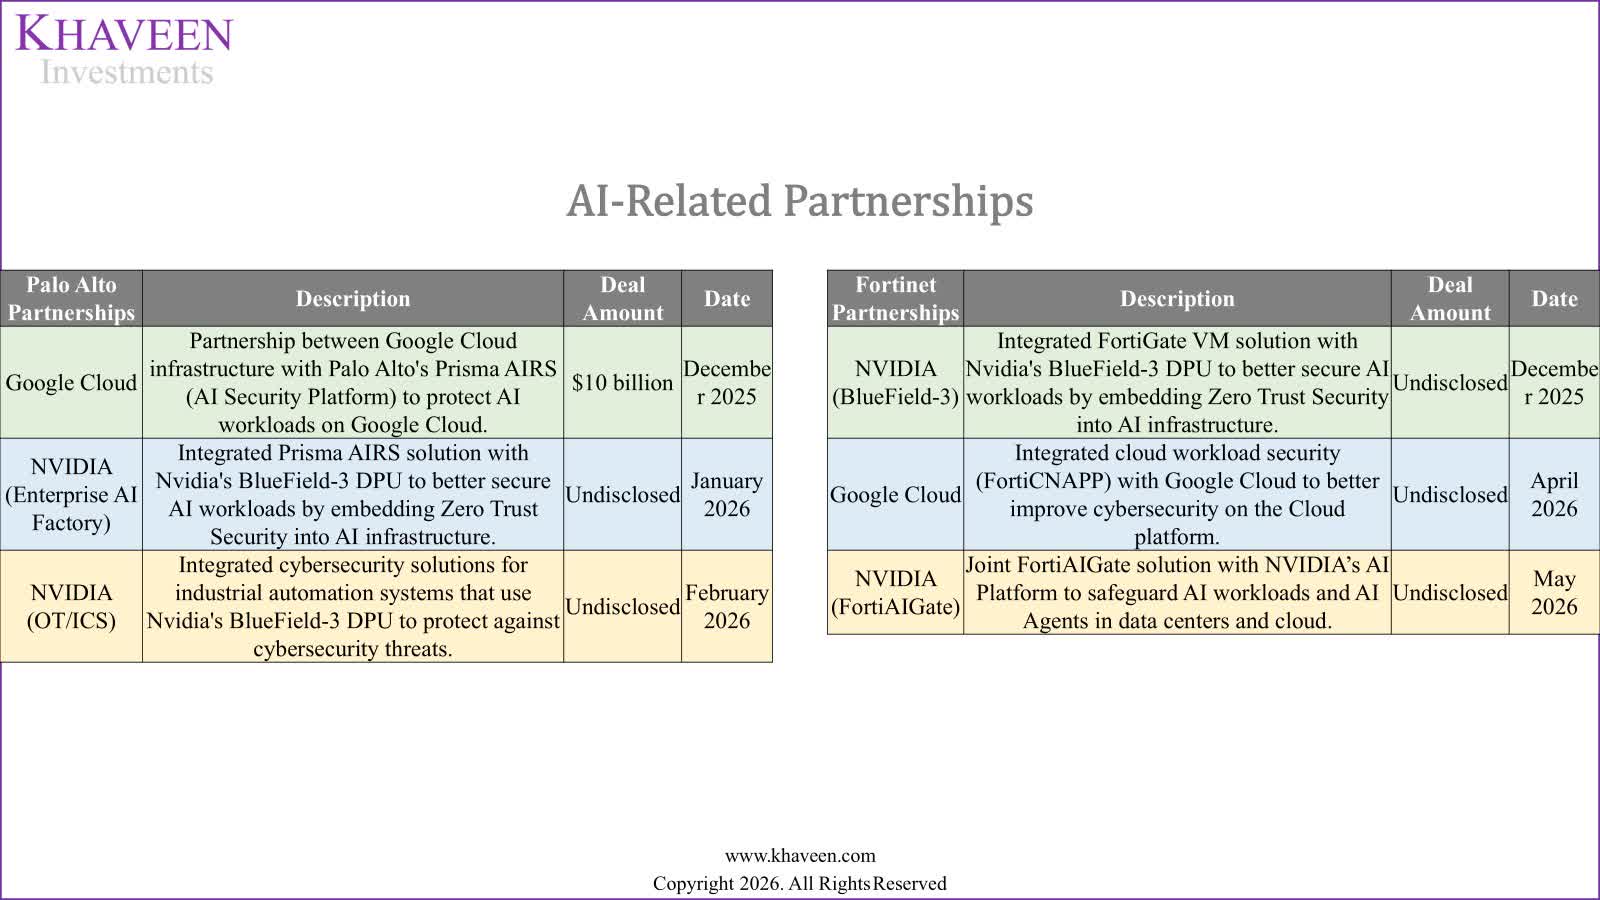
We lastly compile both companies' partnerships for developing cybersecurity to protect against AI-related cybersecurity threats so we can determine which company has better partnerships for protection against these threats. We find that both companies have partnered with the same companies, which are Google (GOOGL)(GOOG) and Nvidia (NVDA), with both integrating their solutions with Google Cloud and Nvidia.
According to Reuters and Palo Alto, Palo Alto is reportedly paying $10 billion to Google Cloud so that Palo Alto can better protect customers' AI workloads on Google Cloud and enable customers to reduce “integration challenges and operational friction that can slow down security teams.” The partnership is also expected to increase new AI-related services for Palo Alto, which should increase Palo Alto's capabilities to protect against cyberattacks for its customers.
Khaveen Investments
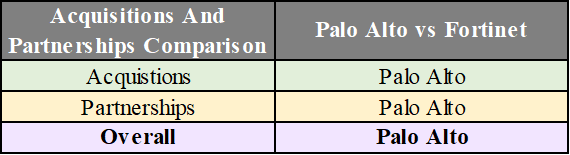
Overall, we determine that Palo Alto is better in terms of acquisitions and partnerships. This is because Palo Alto has a higher number of acquisitions than Fortinet, with significantly larger acquisitions. We further expect Palo Alto's recent AI-related and much larger acquisitions, such as CyberArk and Chronosphere, compared to Fortinet, to improve Palo Alto's future software capabilities and enable Palo Alto to have better AI cybersecurity software to protect against potential cyber threats.
In contrast, Fortinet's AI acquisitions are much smaller in size and have already happened. We further determine that Palo Alto has better partnerships for developing AI-related software to protect against AI-related cybersecurity threats, due to Palo Alto's $10 billion partnership with Google.
Risk: AI Competition With Check Point
We believe one risk that could negatively affect both Palo Alto and Fortinet is competition with Check Point (CHKP). As shown above, Check Point is ranked 2nd overall for our competitive metric table, meaning that Check Point is quite competitive for cybersecurity. As of 4Q 2024, Check Point also has the 4th largest market share for security appliances, while Fortinet (19.0%) and Palo Alto (18.7%) hold the 1st and 2nd largest market shares.
In June 2026, Check Point extended “Workforce AI Security into its MSP ecosystem, enabling MSPs to discover AI usage and govern employee interactions with AI tools”, which improves Check Point's competitiveness. To add on, Check Point also announced a new Managed Service Provider (MSP) platform with a new support team and integrations with AI security, such as Workforce AI. Check Point also announced an integration with Amazon's (AMZN) Bedrock AgentCore, which increases Check Point's ability to meet customer needs in Agentic AI.
Valuation
Khaveen Investments
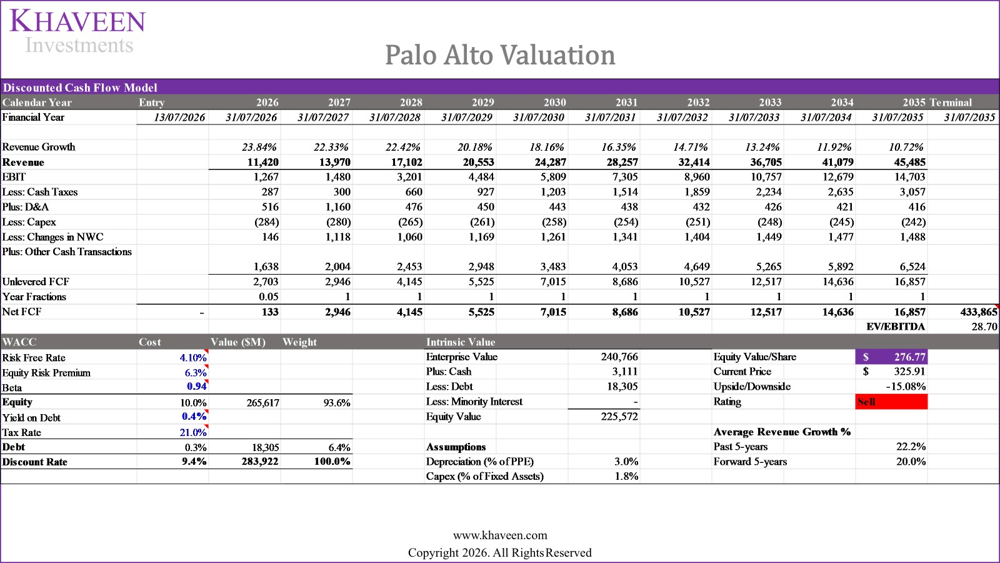
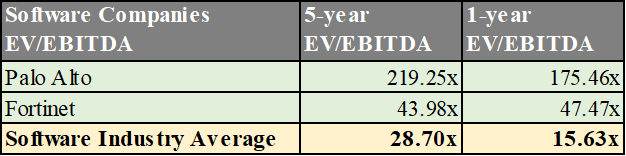
Based on our valuation of Palo Alto using a DCF model, incorporating our revenue projections at a 5-year forward average of around 20.0%, a discount rate of 9.4% reflecting the company's WACC, and a terminal value based on the top Software companies' average EV/EBITDA multiples of 28.70x, our model indicates a downside of 15.08%.
Khaveen Investments
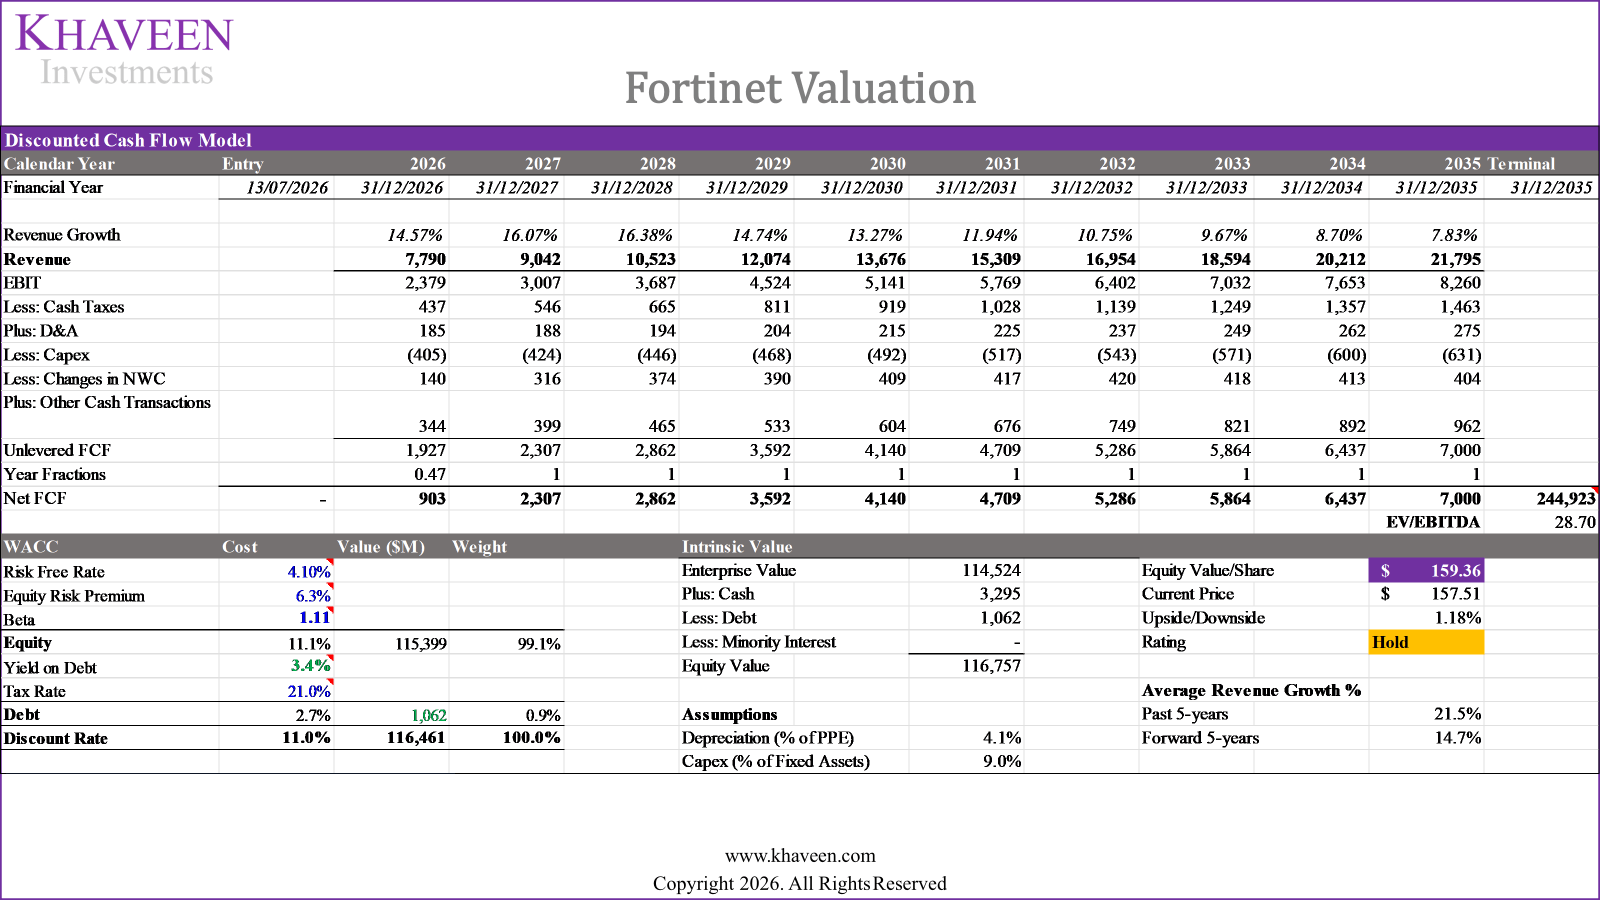
Based on our valuation of Fortinet using a DCF model, incorporating our revenue projections at a 5-year forward average of around 14.7%, a discount rate of 11.0% reflecting the company's WACC, and a terminal value based on the top Software companies' average EV/EBITDA multiples of 28.70x, our model indicates an upside of 1.18%.
Seeking Alpha, GuruFocus, Khaveen Investments
While we highlighted above that Palo Alto's and Fortinet's P/FCF were lower than the industry average P/FCF that excluded abnormally high or negative FCF in Q2 2026 TTM, or that Fortinet's P/E was lower than the industry average P/E that excluded abnormally high or negative earnings in Q2 2026 TTM, which could have suggested that their stock was undervalued against the cybersecurity industry average. When we compare Palo Alto's and Fortinet's EV/EBITDA against the top software companies' average EV/EBITDA rather than the top cybersecurity companies', Palo Alto's and Fortinet's EV/EBITDA are higher than the average, with Palo Alto's EV/EBITDA being significantly higher.
This can explain why, despite valuation ratios being lower than the cybersecurity industry average (which excluded abnormally high or negative FCF in Q2 2026 TTM), these companies have low upside or downside. This is because Palo Alto and Fortinet's EV/EBITDA valuation ratios are more expensive than those of the top software companies. Hence, when we use the top software companies' EV/EBITDA for our DCF valuation, this would result in lower upside for these companies and can explain our lower upside.
We also used the software companies' average EV/EBITDA for our valuation rather than the average of the cybersecurity companies to take into account more companies for our valuation.
Verdict
Khaveen Investments
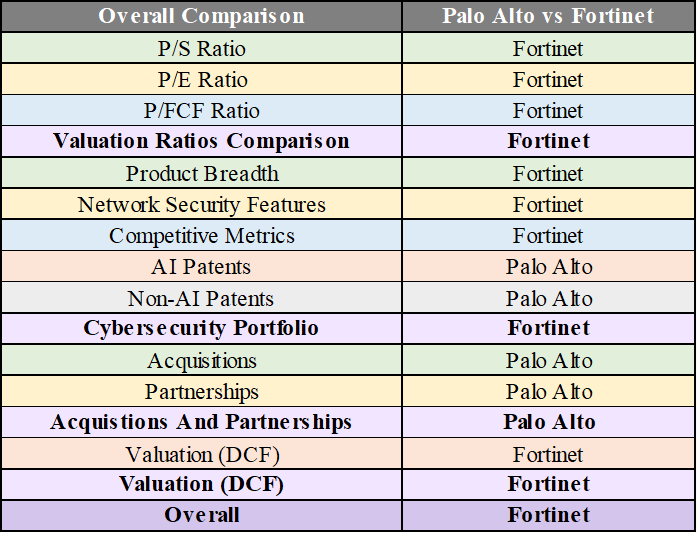
Overall, we determine that Fortinet is the better cybersecurity company and is more favorably positioned to capture the emerging AI cybersecurity opportunity. Fortinet's valuation ratios are much more justifiable than Palo Alto's, as despite similar growth rates in revenue and FCF, Fortinet's Q2 2026 TTM P/S and P/FCF are much lower, showing it is priced more reasonably than Palo Alto. Fortinet is also better in terms of DCF valuation, as Fortinet still has upside, although only marginally.
Furthermore, Fortinet has a more competitive cybersecurity portfolio with a much wider product breadth, a larger number of network security features, and better competitive metrics, while Palo is more competitive in terms of AI patents and non-AI patents. In comparison, Palo Alto is much better in terms of AI-related acquisitions and partnerships, due to Palo Alto's large AI-related acquisitions, such as Chronosphere and CyberArk. We find that Fortinet is better overall, winning in 3 of the 4 categories and 7 out of the 11 subcategories. Based on our DCF valuation, we rate Palo Alto as a Sell with a price target of $276.77, and we rate Fortinet as a Hold with a price target of $159.36.


