

Technology
The 100 Websites That Rule the Internet


The 100 Websites That Rule the Internet
For the full-size version of this giant infographic click here.
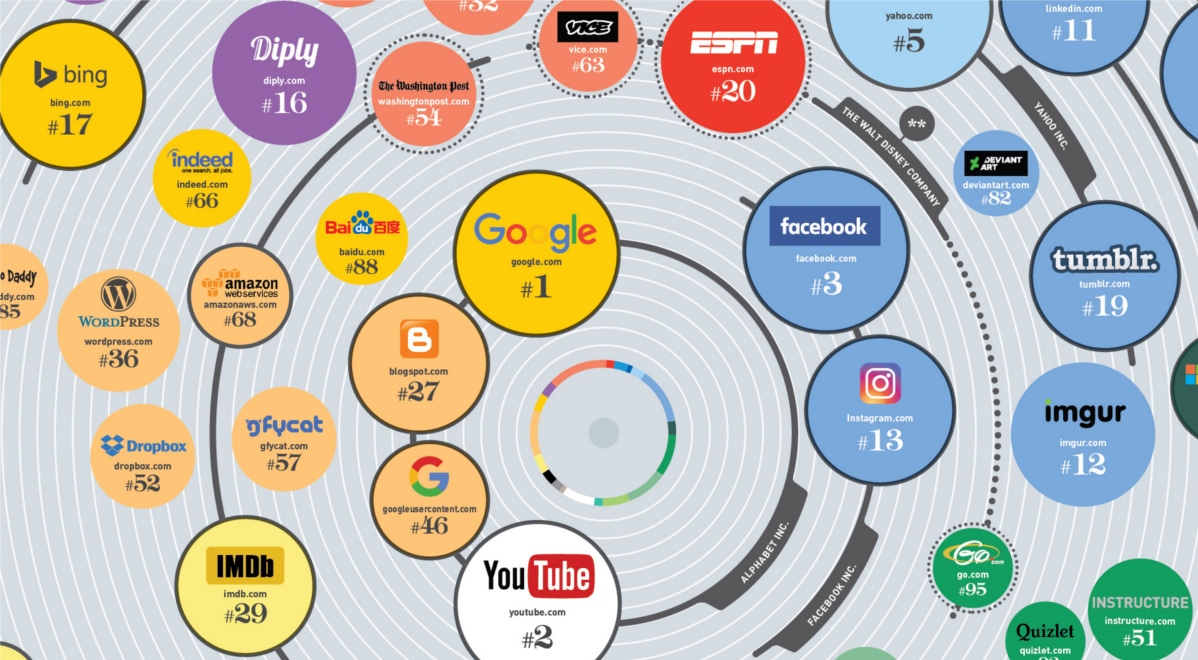
There are over 1.1 billion websites on the internet, but the vast majority of all traffic actually goes to a very select list of them. Google.com, for example, has an astounding 28 billion visits per month. The next closest is also a Google-owned property, Youtube.com, which brings in 20.5 billion visits.
Today’s infographic comes to us from Vodien, and it lists the 100 highest ranking websites in the U.S. by traffic, according to website analytics company Alexa.
The information is grouped by company – for example, you can see that Google controls four sites in the Top 100 (Google, Youtube, Blogger, and Google User Content), while Verizon owns the Huffington Post and AOL.com (they will also control Yahoo and Tumblr when that deal closes in Q2). The data is also sorted by industry, so sites in a similar category are grouped in the same color.
A Steep Dropoff
The dropoff from #1 to #100 is significant. Google.com has 28 billion visits, but a website like Citi.com (ranked #98) only has 53 million visits a month. That’s a 500x difference!
Meanwhile, a website like ours (Visualcapitalist.com) gets one million visits per month, and is ranked #33,000 in the United States – a 50x difference from Citi. Further down the trail – there are literally millions of tiny websites that get thousands or just hundreds of visits per month, and some that don’t get any love at all.
The whole distribution is quite fascinating, and it is clear that the spoils go overwhelmingly to the very top of the food chain. However, that also means that there is an entire world of millions of websites out there that almost no one (except Google’s crawler) has ever seen.


Technology
Ranked: The Most and Least Expensive Internet in the World
Internet costs range from just $3 a month in some countries to $374 in others. Here’s how geography shapes what people pay to get online.


Ranked: The Most and Least Expensive Internet in the World
See visuals like this from many other data creators on our Voronoi app. Download it for free on iOS or Android and discover incredible data-driven charts from a variety of trusted sources.
Key Takeaways
- Internet prices vary dramatically worldwide, ranging from $2.61 per month in Iran to nearly $374 in Wallis and Futuna.
- Island nations and territories account for 18 of the world’s 25 most expensive broadband markets.
- Some of the world’s cheapest broadband markets, including Romania and Vietnam, also rank among the fastest for internet speeds.
The cost of getting online varies far more than many people realize. In some countries, a fixed broadband subscription costs just a few dollars per month, while in others it can exceed $300.
Using data from Broadband Genie, this graphic compares the world’s most and least expensive broadband markets based on average monthly subscription prices in U.S. dollars.
The results reveal a gap of more than 140-fold between the cheapest and most expensive markets. Geography is a major factor, with remote islands heavily represented among the world’s costliest places to access the internet.
The World’s Most Expensive Internet Markets
Wallis and Futuna leads the ranking by a wide margin, followed by Turkmenistan and Turks and Caicos. More broadly, geographic isolation stands out as a key pattern, with 18 of the world’s 25 most expensive broadband markets being island nations or territories.
Many of the world’s most expensive broadband markets have small populations and limited competition. In remote island territories, infrastructure costs must be spread across relatively few subscribers, helping explain why internet bills can be significantly higher.
| Rank | Country | Average Monthly Cost of Fixed Broadband 2026 (USD) |
|---|---|---|
| 1 | 🇼🇫 Wallis and Futuna | $373.88 |
| 2 | 🇹🇲 Turkmenistan | $286.24 |
| 3 | 🇹🇨 Turks and Caicos | $252.00 |
| 4 | 🇧🇱 Saint Barthélemy | $207.26 |
| 5 | 🇸🇿 Eswatini | $193.31 |
| 6 | 🇸🇾 Syria | $189.92 |
| 7 | 🇧🇮 Burundi | $186.46 |
| 8 | 🇰🇲 Comoros | $175.12 |
| 9 | 🇰🇾 Cayman Islands | $167.39 |
| 10 | 🇻🇬 British Virgin Islands | $155.00 |
| 11 | 🇧🇲 Bermuda | $150.00 |
| 12 | 🇨🇬 Congo | $136.54 |
| 13 | 🇸🇨 Seychelles | $134.30 |
| 14 | 🇹🇱 Timor-Leste | $124.50 |
| 15 | 🇨🇼 Curaçao | $121.96 |
| 16 | 🇻🇺 Vanuatu | $117.38 |
| 17 | 🇬🇺 Guam | $115.00 |
| 18 | 🇫🇰 Falkland Islands | $112.73 |
| 19 | 🇬🇱 Greenland | $111.45 |
| 20 | 🇻🇮 U.S. Virgin Islands | $110.00 |
| 21 | 🇦🇮 Anguilla | $108.29 |
| 22 | 🇲🇿 Mozambique | $108.22 |
| 23 | 🇦🇪 UAE | $105.92 |
| 24 | 🇮🇸 Iceland | $105.08 |
| 25 | 🇲🇵 Northern Mariana Islands | $104.99 |
| 167 | 🇺🇸 U.S. | $80.00 |
Broadband prices vary widely even as internet access becomes increasingly common worldwide. The share of the global population online has risen from 43% in 2015 to 68% in 2025, making affordability an increasingly important part of digital access.
In the U.S., rising competition has helped drive broadband prices lower. Since 2014, the price of popular broadband plans has fallen by roughly two-thirds, while internet speeds have doubled.
Where Internet Access Is Cheapest
At the other end of the ranking, several countries offer broadband for only a few dollars per month when converted into U.S. dollars.
Iran ranks as the least expensive market, driven by a collapsing rial and government subsidies. Ukraine, Ethiopia, and Bangladesh follow. Ukraine had roughly 1,500 internet service providers before the war, with some apartment buildings having more than a dozen providers competing for customers.
| Rank | Country | Average Monthly Cost of Fixed Broadband 2026 (USD) |
|---|---|---|
| 1 | 🇮🇷 Iran | $2.61 |
| 2 | 🇺🇦 Ukraine | $5.35 |
| 3 | 🇪🇹 Ethiopia | $6.46 |
| 4 | 🇧🇩 Bangladesh | $7.38 |
| 5 | 🇲🇳 Mongolia | $7.41 |
| 6 | 🇪🇬 Egypt | $7.91 |
| 7 | 🇷🇴 Romania | $8.19 |
| 8 | 🇮🇳 India | $8.82 |
| 9 | 🇳🇵 Nepal | $9.22 |
| 10 | 🇷🇺 Russia | $9.71 |
| 11 | 🇻🇳 Vietnam | $10.24 |
| 12 | 🇮🇩 Indonesia | $10.66 |
| 13 | 🇺🇿 Uzbekistan | $12.03 |
| 14 | 🇰🇬 Kyrgyzstan | $13.95 |
| 15 | 🇱🇧 Lebanon | $14.23 |
| 16 | 🇨🇳 China | $14.30 |
| 17 | 🇱🇾 Libya | $14.68 |
| 18 | 🇬🇪 Georgia | $14.87 |
| 19 | 🇰🇿 Kazakhstan | $15.23 |
| 20 | 🇲🇩 Moldova | $15.66 |
| 21 | 🇧🇾 Belarus | $15.66 |
| 22 | 🇵🇰 Pakistan | $15.96 |
| 23 | 🇵🇬 Papua New Guinea | $17.30 |
| 24 | 🇱🇹 Lithuania | $17.75 |
| 25 | 🇹🇷 Türkiye | $17.76 |
Cheap internet does not necessarily mean lower-quality service. Romania and Vietnam rank among the world’s least expensive broadband markets while also placing among the global leaders in fixed broadband speeds.
This suggests that market competition and network investment can sometimes deliver both affordability and performance.
The contrast is striking: broadband in Wallis and Futuna costs roughly 143 times more than the average subscription in Iran, the world’s cheapest market.
The Geography of Digital Infrastructure
The internet is often described as borderless, but the rankings tell a different story.
Submarine cables carry roughly 99% of global internet traffic, creating the physical backbone of the online world. Countries located farther from major network routes often face higher infrastructure costs, which can ultimately be reflected in consumer prices.
As digital services become increasingly central to work, education, entertainment, and communication, broadband affordability is emerging as an important part of economic accessibility.
Learn More on the Voronoi App 
To learn more about this topic, check out this graphic on the cost of living around the world in 2026.
Business
Ranked: SpaceX vs. The Largest Public Space Companies
Fresh off the largest IPO in history, SpaceX is worth $2.46 trillion, which is about 10 times every other public space company combined.


Ranked: SpaceX vs. The Largest Public Space Companies
See visuals like this from many other data creators on our Voronoi app. Download it for free on iOS or Android and discover incredible data-driven charts from a variety of trusted sources.
Key Takeaways
- SpaceX’s $2.46 trillion market cap is larger than the combined value of the next 20 biggest public space companies, which together are worth about $235 billion.
- Rocket Lab ranks a distant second at $68.6 billion, while no other pure-play space company is worth more than $35 billion.
- SpaceX’s post-IPO surge has turned a once-private industry leader into one of the world’s most valuable companies.
The space industry has never seen a company this dominant.
Following its Nasdaq debut, SpaceX reached a market capitalization of $2.46 trillion. That makes it worth roughly 10.5 times more than the next 20 largest publicly traded pure-play space companies combined.
This graphic compares SpaceX against every public space company worth at least $1 billion, illustrating just how much the industry’s center of gravity has shifted toward a single firm.
The data comes from CompaniesMarketCap and reflects market capitalizations as of June 15, 2026. Diversified aerospace and defense companies such as Boeing and Lockheed Martin are excluded.
SpaceX Dwarfs the Entire Public Space Industry
The gap between SpaceX and the rest of the industry is difficult to overstate.
At $2.46 trillion, SpaceX is worth more than the next 20 largest public pure-play space companies combined by roughly $2.2 trillion. Put differently, investors value SpaceX at more than 10 times the rest of the listed space sector.
The data table below shows the largest public pure-play companies in the space industry with a market capitalization over $1 billion:
Outside of SpaceX, the industry’s scale drops dramatically. Rocket Lab is the second-largest pure-play space company at $68.6 billion, meaning SpaceX is worth nearly 36 Rocket Labs. AST SpaceMobile and EchoStar follow at roughly $34 billion each, highlighting how concentrated investor value has become in a single company.
The roster spans the full space economy: satellite communications, rocket launch, Earth observation, and lunar and in-orbit services.
It is also overwhelmingly American, with U.S. firms claiming most of the top 20 and the rest split among China, Japan, Canada, and Europe.
The Largest IPO in History and a New Trillionaire
SpaceX’s dominance reflects what no rival can match: a reusable rocket fleet that flies more orbital missions than any other operator, paired with Starlink, the largest satellite-internet constellation in operation. The result is a single company that towers over a sector otherwise filled with specialized, single-digit-billion-dollar players.
SpaceX’s debut wasn’t just big for the space sector: it was the largest IPO ever recorded. The company priced its shares at $135 on June 12, raising roughly $75 billion and eclipsing Saudi Aramco’s $25.6 billion record from 2019. That initial price valued SpaceX at about $1.77 trillion; three days later, the stock was trading near $178, lifting its market cap to $2.46 trillion.
The listing also crystallized a milestone of its own. By revaluing Elon Musk’s roughly 42% SpaceX stake on the open market, it pushed his net worth past $1 trillion and made him the world’s first trillionaire.
SpaceX’s Valuation Bakes In Big Expectations
SpaceX’s price tag assumes enormous future growth. At $2.46 trillion, the company trades at roughly 130 times its 2025 revenue of $18.7 billion, a year in which it posted a $4.9 billion net loss.
The engine behind that optimism is Starlink. The satellite-internet business generated 61% of SpaceX’s 2025 revenue and earned a $4.4 billion operating profit, even as the company overall ran a $2.6 billion operating loss.
For now, investors are betting that Starlink’s growth and SpaceX’s launch dominance will eventually justify a valuation larger than most of the world’s biggest companies.
Learn More on the Voronoi App
To learn more about SpaceX, check out this visualization on its growing number of rocket launches on Voronoi.
-

 Uranium4 weeks ago
Ranked: Who Controls the World’s Uranium Supply?
-
 Geopolitics4 days ago
Ranked: How 45 Countries View America
-
Culture3 weeks ago
Ranked: The Hardest Languages for English Speakers to Learn
-
Energy2 weeks ago
Ranked: Where Electricity Costs the Most and Least
-
 Public Opinion3 days ago
Ranked: The World’s Most and Least Liked Countries
-
 Misc2 days ago
Ranked: The Countries That Brew the Most Beer
-
Money5 days ago
Ranked: The World’s Top Billionaire Cities in 2026
-
Housing1 week ago
Mapped: The Salary Needed to Afford Rent Across America


