

Race Realism: The Biological Reality
by Zoltanous
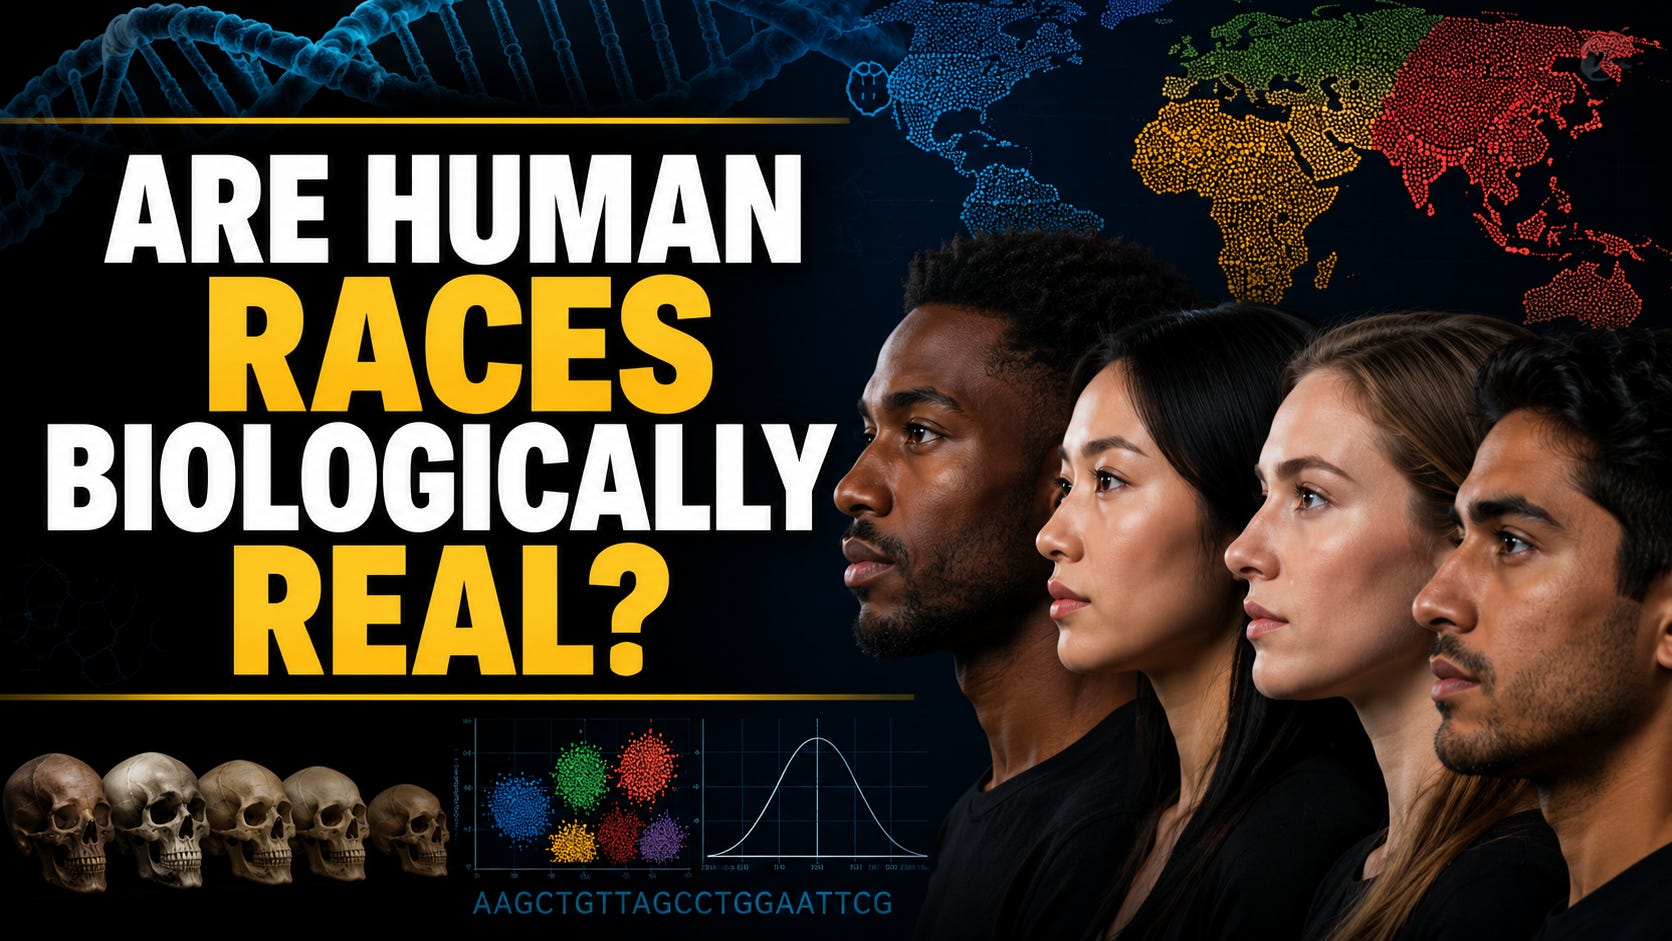
Race realism is the scientific position that human continental ancestry groups, traditionally termed races, represent real biological categories. These categories arise from evolutionary divergence, genetic clustering, and average differences in heritable traits, including morphology, brain structure, and cognitive ability. The position draws on replicated findings across population genetics, behavioral genetics, psychometrics, forensic anthropology, and medicine. It does not claim discrete non-overlapping types or that individuals are uniform within groups; instead, it recognizes fuzzy boundaries with substantial overlap while documenting systematic average differences shaped by ancestry.
Human genetic variation clusters by continental ancestry when analyzed multivariately. Single-locus statistics showing most variation within populations do not preclude classification because correlations across loci contain the key information.
“In popular articles that play down the genetical differences among human populations, it is often stated that about 85% of the total genetical variation is due to individual differences within populations and only 15% to differences between populations or ethnic groups.”
“This conclusion, due to R.C. Lewontin in 1972, is unwarranted because the argument ignores the fact that most of the information that distinguishes populations is hidden in the correlation structure of the data and not simply in the variation of the individual factors.”
— A. W. F. Edwards, Human genetic diversity: Lewontin’s fallacy
The implication of Lewontin’s fallacy is that the statistic was used to suggest racial categories lack biological meaning and that individuals from different groups are more genetically similar to one another than to members of their own group on average, yet this does not follow once correlated variation across loci is considered; multivariate analysis permits reliable classification of individuals to ancestral clusters, preserving the utility of population structure in science and medicine.
Rosenberg applied STRUCTURE algorithms to global microsatellite data and recovered major clusters corresponding to sub-Saharan Africa, Europe/West Asia, East Asia, Oceania, and the Americas at K=5 or 6. These clusters align with traditional racial categories and reflect phylogenetic history rather than arbitrary social assignment. In U.S. samples, self-identified race and ethnicity predict genetic ancestry with high accuracy using sufficient markers. Ancestry informative markers and forensic DNA panels distinguish continental origins at the individual level with low error rates. These patterns persist in ancient DNA and modern genomes, confirming deep evolutionary fact.
Medical applications further demonstrate biological reality. Allele frequencies differ systematically by ancestry and predict disease susceptibility and treatment response. APOL1 risk variants occur at much higher frequency in African-ancestry populations and strongly elevate kidney disease risk. Cystic fibrosis carrier rates are far lower in African-ancestry groups. Warfarin dosing algorithms and certain antihypertensive responses require ancestry adjustment for optimal safety and efficacy. FDA labeling has incorporated race-specific indications where data warranted. These clinical realities arise from population genetic differences, not social constructs.
Polygenic scores provide a modern genomic method for quantifying cumulative genetic influence on complex traits. Large genome-wide association studies genotype hundreds of thousands to millions of individuals for millions of single-nucleotide polymorphisms. Researchers test each SNP for statistical association with a phenotype such as educational attainment as a proxy for cognitive ability or direct intelligence measures. Effect sizes are estimated, typically via linear regression or mixed models accounting for population structure. A polygenic score for a new individual is then calculated as the sum across SNPs of the number of effect alleles multiplied by the effect size weight, often standardized. This aggregates thousands of small-effect variants into a single score that captures a portion of trait variance.
Polygenic scores derived from educational attainment and intelligence genome-wide association studies show mean differences across ancestry groups that align directionally with observed phenotypic gaps. In admixed U.S. populations, these scores correlate with cognitive outcomes and with proportions of European versus African ancestry in multiple analyses, even after statistical controls for some environmental variables.
“Intelligence-associated Polygenic Scores Predict g, Independent of Ancestry, Parental Educational Levels, and Color among Hispanics in comparison to European, European-African, and African Americans.”
— Bryan J. Pesta, John G. R. Fuerst, Davide Piffer, and Emil O. W. Kirkegaard, Intelligence-associated Polygenic Scores Predict g, Independent of Ancestry, Parental Educational Levels, and Color among Hispanics in comparison to European, European-African, and African Americans
Methodology includes training on discovery samples, often European-ancestry biased due to available large cohorts, followed by validation in target samples. Linkage disequilibrium decay and allele frequency differences reduce predictive accuracy when porting European-derived polygenic scores to more distant ancestries such as sub-Saharan African. However, within admixed populations or with ancestry-adjusted models, polygenic scores retain utility and reveal patterns consistent with partial genetic contribution to group differences. Studies using within-family designs or less biased effect sizes continue to test selection signals and between-group implications. These methods complement twin and adoption heritability estimates by directly indexing realized genetic propensity rather than inferring it from relatedness. Additional analyses confirm that polygenic scores for cognitive and educational traits exhibit inter-correlations with genetic ancestry and phenotypic measures in admixed American populations, supporting the interpretation that ancestry tracks genetic contributions to observed differences.
Continental ancestry groups exhibit average differences in cranial and postcranial skeletal morphology resulting from genetic and evolutionary factors. Forensic anthropologists estimate ancestry from remains using metric and non-metric traits analyzed through multivariate statistics and machine learning. Modern methods achieve high classification accuracy, artificial neural networks, support vector machines, and random forests applied to cranial morphometric and morphoscopic data yield mean accuracies around 85%, with artificial neural networks reaching 87.9% in some validations. Combining cranial and postcranial traits improves accuracy by more than 10% over either alone; random forest models on combined data have reached nearly 89.6%. Software such as AncesTrees, trained on craniometric data typically comprising 23 measurements, demonstrates strong generalization capacity when tested on independent samples. Specific bone elements such as vertebrae or the talus in targeted populations have produced accuracies of 80 to 95.5%.
While early single-formula approaches from the 1960s and 1970s showed limitations when applied to certain independent samples, contemporary validated protocols using larger reference databases and advanced statistics reliably recover continental ancestry. These methods succeed because population differences in average morphology are real and diagnostically informative. Geometric morphometrics and spatial analysis further confirm that craniofacial variation tracks ancestral population structure. Validation studies on identified forensic cases show that ancestry estimates from skeletal remains correctly align with social race or self-identified ancestry in approximately 90% of resolved instances when continental-level categories are applied. Mixed or atypical cases increase error, yet the underlying biological signal remains strong enough for routine operational use in medicolegal identification. This reliability demonstrates that skeletal form reflects genetic ancestry and developmental history shaped by population divergence.
“The overall accuracy rate of ancestry estimation was 90.9%.”
— Accuracy Rates of Ancestry Estimation by Forensic Anthropologists Using Identified Forensic Cases
Standardized intelligence tests reveal average differences across ancestry groups that are highly stable on g-loaded measures. The Black-White gap in the United States has centered near one standard deviation, approximately 15 points, for decades on the most predictive batteries, with East Asian averages modestly above European ones. These differences are not uniform across all cognitive tasks; they are larger on more highly g-loaded subtests, consistent with a general factor influence. Heritability of intelligence within populations is moderate to high in adulthood and does not differ substantially across U.S. racial and ethnic groups.
“We found that White, Black, and Hispanic heritabilities were consistently moderate to high, and that these heritabilities did not differ across groups.”
— Bryan J. Pesta, John G. R. Fuerst, Davide Piffer, and Emil O. W. Kirkegaard, Racial and ethnic group differences in the heritability of intelligence: A systematic review and meta-analysis
This equivalence undercuts claims that environmental variance or lower heritability in one group fully explains mean differences. Transracial adoption studies equalize early rearing environment and provide direct tests. In the Minnesota Transracial Adoption Study follow-up, corrected IQ scores at age 17 demonstrated clear patterns by biological ancestry: adopted children with two Black biological parents averaged 83.7; adopted children with one White and one Black biological parent averaged 93.2; non-adopted children with two White biological parents averaged 105.5; and adopted children with two White biological parents averaged 101.5. The gap between children with two Black biological parents and White groups remained substantial, approximately 17 to 22 points, despite placement in advantaged upper-middle-class White homes from early life. Mixed-ancestry individuals scored intermediate, producing a pattern consistent with genetic admixture effects. Purely environmental models predicting near-complete closure under enriched conditions do not account for the persistent differential or the admixture gradient.
“The new evidence reviewed here points to some genetic component in Black–White differences in mean IQ.”
— J. Philippe Rushton and Arthur R. Jensen, Thirty years of research on race differences in cognitive ability
Regression to the mean further supports genetic influence on group distributions.
“Regression would explain why Black children born to high IQ, wealthy Black parents have test scores 2 to 4 points lower than do White children born to low IQ, poor White parents.”
— J. Philippe Rushton and Arthur R. Jensen, Thirty years of research on race differences in cognitive ability
Polygenic scores add genomic corroboration. Polygenic scores derived from large genome-wide association studies aggregate small-effect variants and show mean differences across ancestry groups aligning with phenotypic gaps. In admixed samples, polygenic scores correlate with cognitive measures and ancestry proportions. While European-biased discovery samples introduce portability challenges due to linkage disequilibrium decay, especially for more distant African ancestry, directional consistency and within-admixed correlations persist across studies. This methodology bridges classical behavioral genetics with molecular data, confirming that a portion of between-group variance traces to realized genetic differences rather than solely environmental confounding.
Brain size differences parallel cognitive patterns and show ancestry variation. Autopsy data have indicated roughly 100-gram average differences between U.S. White and Black samples. Endocranial volume analyses of thousands of skulls worldwide found East Asians and Europeans averaging 1,389 cubic centimeters versus 1,268 cubic centimeters for Africans. U.S. Army personnel data, corrected for body size, showed Asian and European Americans at 1,398 cubic centimeters versus 1,359 cubic centimeters for African Americans. MRI studies have confirmed smaller average brain volumes in individuals of African and Caribbean background compared with European background. Brain size correlates approximately 0.40 with intelligence across individuals and groups; head circumference in childhood predicts later IQ within racial groups as well.
“The correlation between brain size and cognitive ability is approximately .40.”
— J. Philippe Rushton and Arthur R. Jensen, Thirty years of research on race differences in cognitive ability
Some analyses of standardization samples reported narrowing of several points between the 1970s and early 2000s on certain tests. However, comprehensive evaluations that include additional datasets and apply consistent methodology find far smaller or negligible convergence on the most g-loaded measures. Rushton and Jensen calculated that the best estimate of Black-White convergence over the past 100 years is between 0 and 3.44 IQ points, a maximum effect size of 0.23 standard deviations, well within the range predicted by high heritability for the g difference. Subsequent analyses confirmed limited gains. On the specific IQ tests examined in one prominent 2006 analysis, mean Black gains were only about 2.1 points, or 14%, when excluded datasets showing small, nil, or negative changes were restored and trend projections were not overstated. National Assessment of Educational Progress long-term trend data for 17-year-olds show Black-White gaps that narrowed modestly in some subjects and periods but stabilized or remained substantial; gains were smaller or absent at older ages and on mathematics in several cohorts. Adult and highly g-loaded batteries have exhibited greater stability around 0.8 to 1.1 standard deviations. Environmental improvements such as nutrition, schooling access, and reduced lead exposure have raised absolute scores across groups via the Flynn effect, yet differential gaps on core cognitive measures have not closed dramatically or uniformly. The residual gap continues to predict outcome disparities.
“Racial-group differences in IQ appear early. For example, the Black and the White 3 year-old children in the standardization sample of the Stanford–Binet IV show a 1 standard deviation mean difference after being matched on gender, birth order, and maternal education.”
“Genetic theory predicts that the children of Black parents of IQ 115 will regress toward the Black IQ average of 85, whereas children of White parents of IQ 115 will regress toward the White IQ average of 100.”
— J. Philippe Rushton and Arthur R. Jensen, Thirty years of research on race differences in cognitive ability
Socioeconomic status, schooling quality, family structure, and historical events such as slavery and segregation contribute to disparities and merit serious attention. However, these factors fail to account for the complete dataset when tested rigorously. Transracial adoption equalizes many measured environmental variables yet leaves large gaps. Socioeconomic controls in observational data reduce but do not eliminate differences on g-loaded outcomes. International patterns show ancestry-group averages clustering consistently across diverse modern environments: sub-Saharan African and diaspora estimates remain lower than European or East Asian ones on standardized assessments, even in nations with varying development levels. Global compilations document these distributions; within-country immigrant and adoption data often reproduce similar rank orders.
Behavioral outcomes beyond cognition show parallel ancestry patterns with high heritability. Antisocial behavior and criminal involvement exhibit substantial genetic influence in twin and adoption studies. Official arrest statistics and National Crime Victimization Survey offender identifications converge on overrepresentation in violent crime categories for certain ancestry groups, inconsistent with pure reporting bias explanations. These patterns align with cognitive ability distributions and life-history traits that show average differences by ancestry. Evolutionary considerations provide a coherent model, ancestral environments differed systematically in climate, pathogen load, resource predictability, and social complexity across continents. Selection pressures favored different trait optima on average, including cognitive demands for planning, impulse control, and technical innovation in colder or more variable settings. Resulting genetic divergences in allele frequencies and polygenic scores match observed phenotypic distributions without requiring identical environments today.
Admixture studies examine individuals with varying degrees of ancestry from different continental populations. The Minnesota Transracial Adoption Study data at adolescence show that individuals with two Black biological parents averaged 83.7 IQ, while those with one White and one Black biological parent averaged 93.2, and White groups averaged over 100. This gradient is consistent with partial genetic influence from ancestry proportions rather than a null correlation between European ancestry and cognitive performance. Other admixture analyses using skin color or genetic markers have sometimes reported small positive correlations with cognitive or socioeconomic outcomes in African-American samples, aligning with the broader pattern of intermediate scores in mixed-ancestry individuals. Claims of no correlation in one specific analysis do not overturn the converging evidence from means, regression, and genomic data across multiple studies.
Multiple disciplines yield consistent signals. Population genetics recovers continental clusters and functional allele frequency differences. Polygenic score methodology aggregates SNP effects from genome-wide association studies and reveals directional group differences plus ancestry correlations in admixed samples. Forensic anthropology recovers those clusters from skeletal morphology with high accuracy, 85 to 90% or higher in validated machine-learning and combined-trait protocols, using metric, non-metric, and geometric morphometric approaches. Psychometrics documents g-loaded ability gaps, equivalent within-group heritability, admixture gradients in adoption and genetic data, brain size correlations, and regression patterns. Medical genetics shows ancestry-specific risks and responses. No single environmental variable or historical event accounts for this multi-method convergence; models invoking only culture or discrimination must selectively discount or reinterpret large bodies of replicated data.
Race realism therefore describes observable biological reality grounded in evolutionary history and measurable genetic variation. Average group differences in heritable traits exist alongside vast individual variation and overlap. Understanding these patterns advances accurate science in genetics, medicine, forensics, and social outcomes rather than obscuring them. Policy and individual assessment benefit from recognizing both environmental malleability and biological substrates rather than assuming complete environmental determinism. The evidence from genetics, polygenic methodology, morphology, cognition, and medicine collectively establishes continental ancestry groups as biologically meaningful categories with partial genetic influence on trait distributions.


Thoughts on Stephen Goulds the mismeasure of man?