
THE CURATED ORBIT: Independent Scientists Just Recovered the Signal NASA Filtered Out.
7,578 observations vs. 782. A sideways force equal to the radial one. A reversal at perihelion. And a nucleus nobody can measure.
DATE: MARCH 5, 2026
SUBJECT: FORENSIC ANALYSIS OF ARXIV:2603.00782v1 // NON-GRAVITATIONAL ACCELERATION OF 3I/ATLAS
CROSS-REF: [THE SILENT EDIT] | [THE HEARTBEAT] | [THE IGNITION SEQUENCE] | [CONFIRMED: THE TESS CONTINGENCY] | [THE SUPPRESSION GRADIENT] | [THE GHOST COMA] | [MASTER OBJECT PROFILE]
CLEARANCE: PUBLIC
DATA CONFIDENCE: VERIFIED DATA (publicly reproducible orbital mechanics, three independent statistical methods)
THE PATTERN
In The Silent Edit, we documented how NASA’s CNEOS database was quietly altered within 24 hours of Loeb’s paper. A single velocity sign was flipped, mathematically forcing an interstellar meteor back into a Solar System origin. No press release. No correction notice. Caught only because Loeb had archived the original through the Wayback Machine.
In CONFIRMED: The TESS Contingency, we documented how the Hubble team flagged anomalous frames where their physics model couldn’t handle the tail’s behavior. Instead of investigating what physical property was generating the anomalous scatter, they labeled it an error and excluded it. We wrote: “You don’t flag the anomaly as the error. The anomaly is the finding.”
In The Suppression Gradient, we mapped the full architecture: classify at the intelligence level, blind the civilian instruments, scrub the databases, gate the journals, and process whatever data does get released through methodologies that could remove the signal independent researchers are looking for.
We described five layers.
This paper found Layer 6.
THE PAPER
On February 28, a team of three researchers posted a new analysis to arXiv. Federico Spada from the Leibniz Institute for Astrophysics in Potsdam. Luke Dones from the Southwest Research Institute in Boulder, Colorado. Malgorzata Krolikowska from the Polish Academy of Sciences, one of the most published orbital dynamicists in the world, with decades of work tracking how comets move through the solar system.
These are the people whose entire career is measuring what pushes objects through space. Not theorists. Not commentators.
Orbit fitters.
They take thousands of position measurements, feed them into gravitational models, and extract the forces that the gravity alone can’t explain.
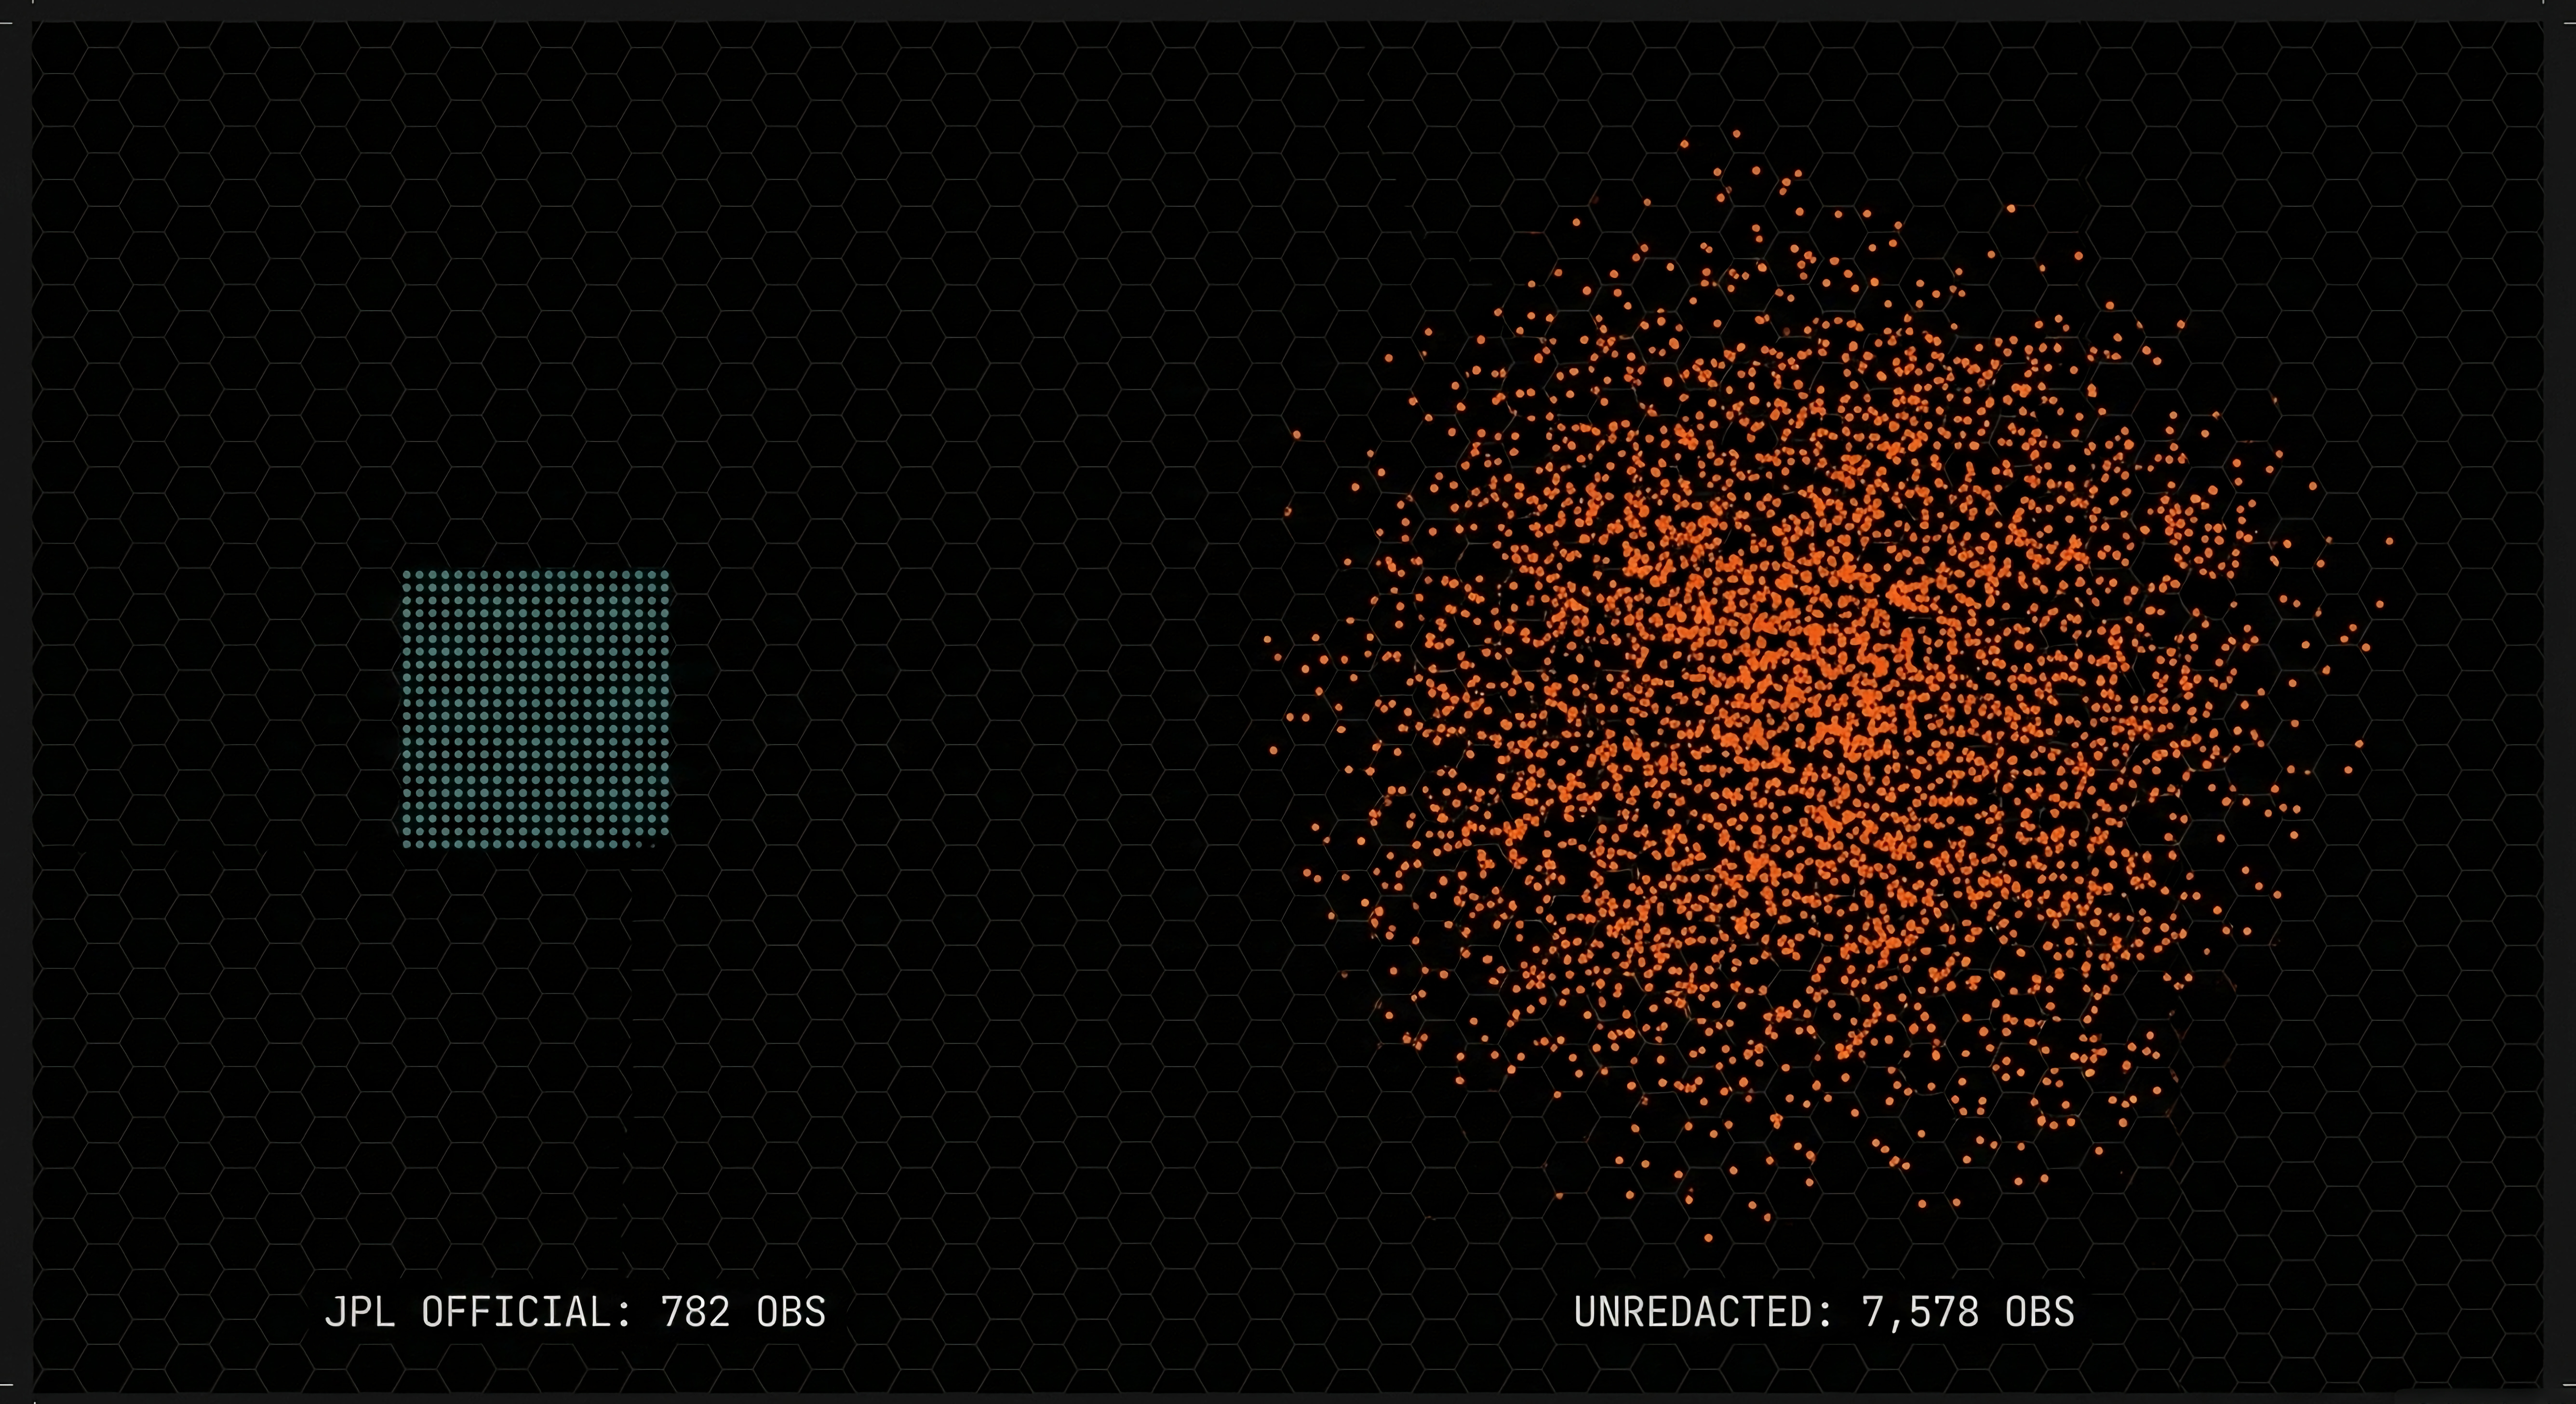
They took every publicly available observation of 3I/ATLAS -- 7,578 usable data points spanning from the TESS pre-discovery images in May 2025 through February 19, 2026 -- and ran them through multiple models, multiple uncertainty methods, and multiple stress tests.
Then they compared their results to NASA JPL’s.
THE MISSING DATA
NASA’s JPL maintains the official orbital data for 3I/ATLAS. It is the number that goes into NASA press releases, the number that feeds into the Horizons ephemeris system and powers most space tracking software, the number that every journalist cites when they write “the object’s trajectory is consistent with a comet.”
NASA used 782 observations.
This team used 7,578.
The authors describe JPL’s approach with careful, academic language. They note that JPL’s dataset underwent “significant vetting and/or pre-processing.” They observe that the two solutions agree on some parameters and diverge sharply on others.
They do not use the word “curation.” They do not need to.
When you remove 90% of the available data, you are making choices about what the answer is allowed to be. And those choices have consequences.
The biggest consequence is what happens to the sideways force.
THE HIDDEN ENGINE
To understand what this paper found, you need to understand how scientists measure the push on a comet.
Gravity is predictable. If you know where the Sun is, where the planets are, and where the object is, you can calculate exactly where it should be tomorrow. When the object isn’t where gravity says it should be, the difference is called “non-gravitational acceleration”. Something other than gravity is doing the pushing.
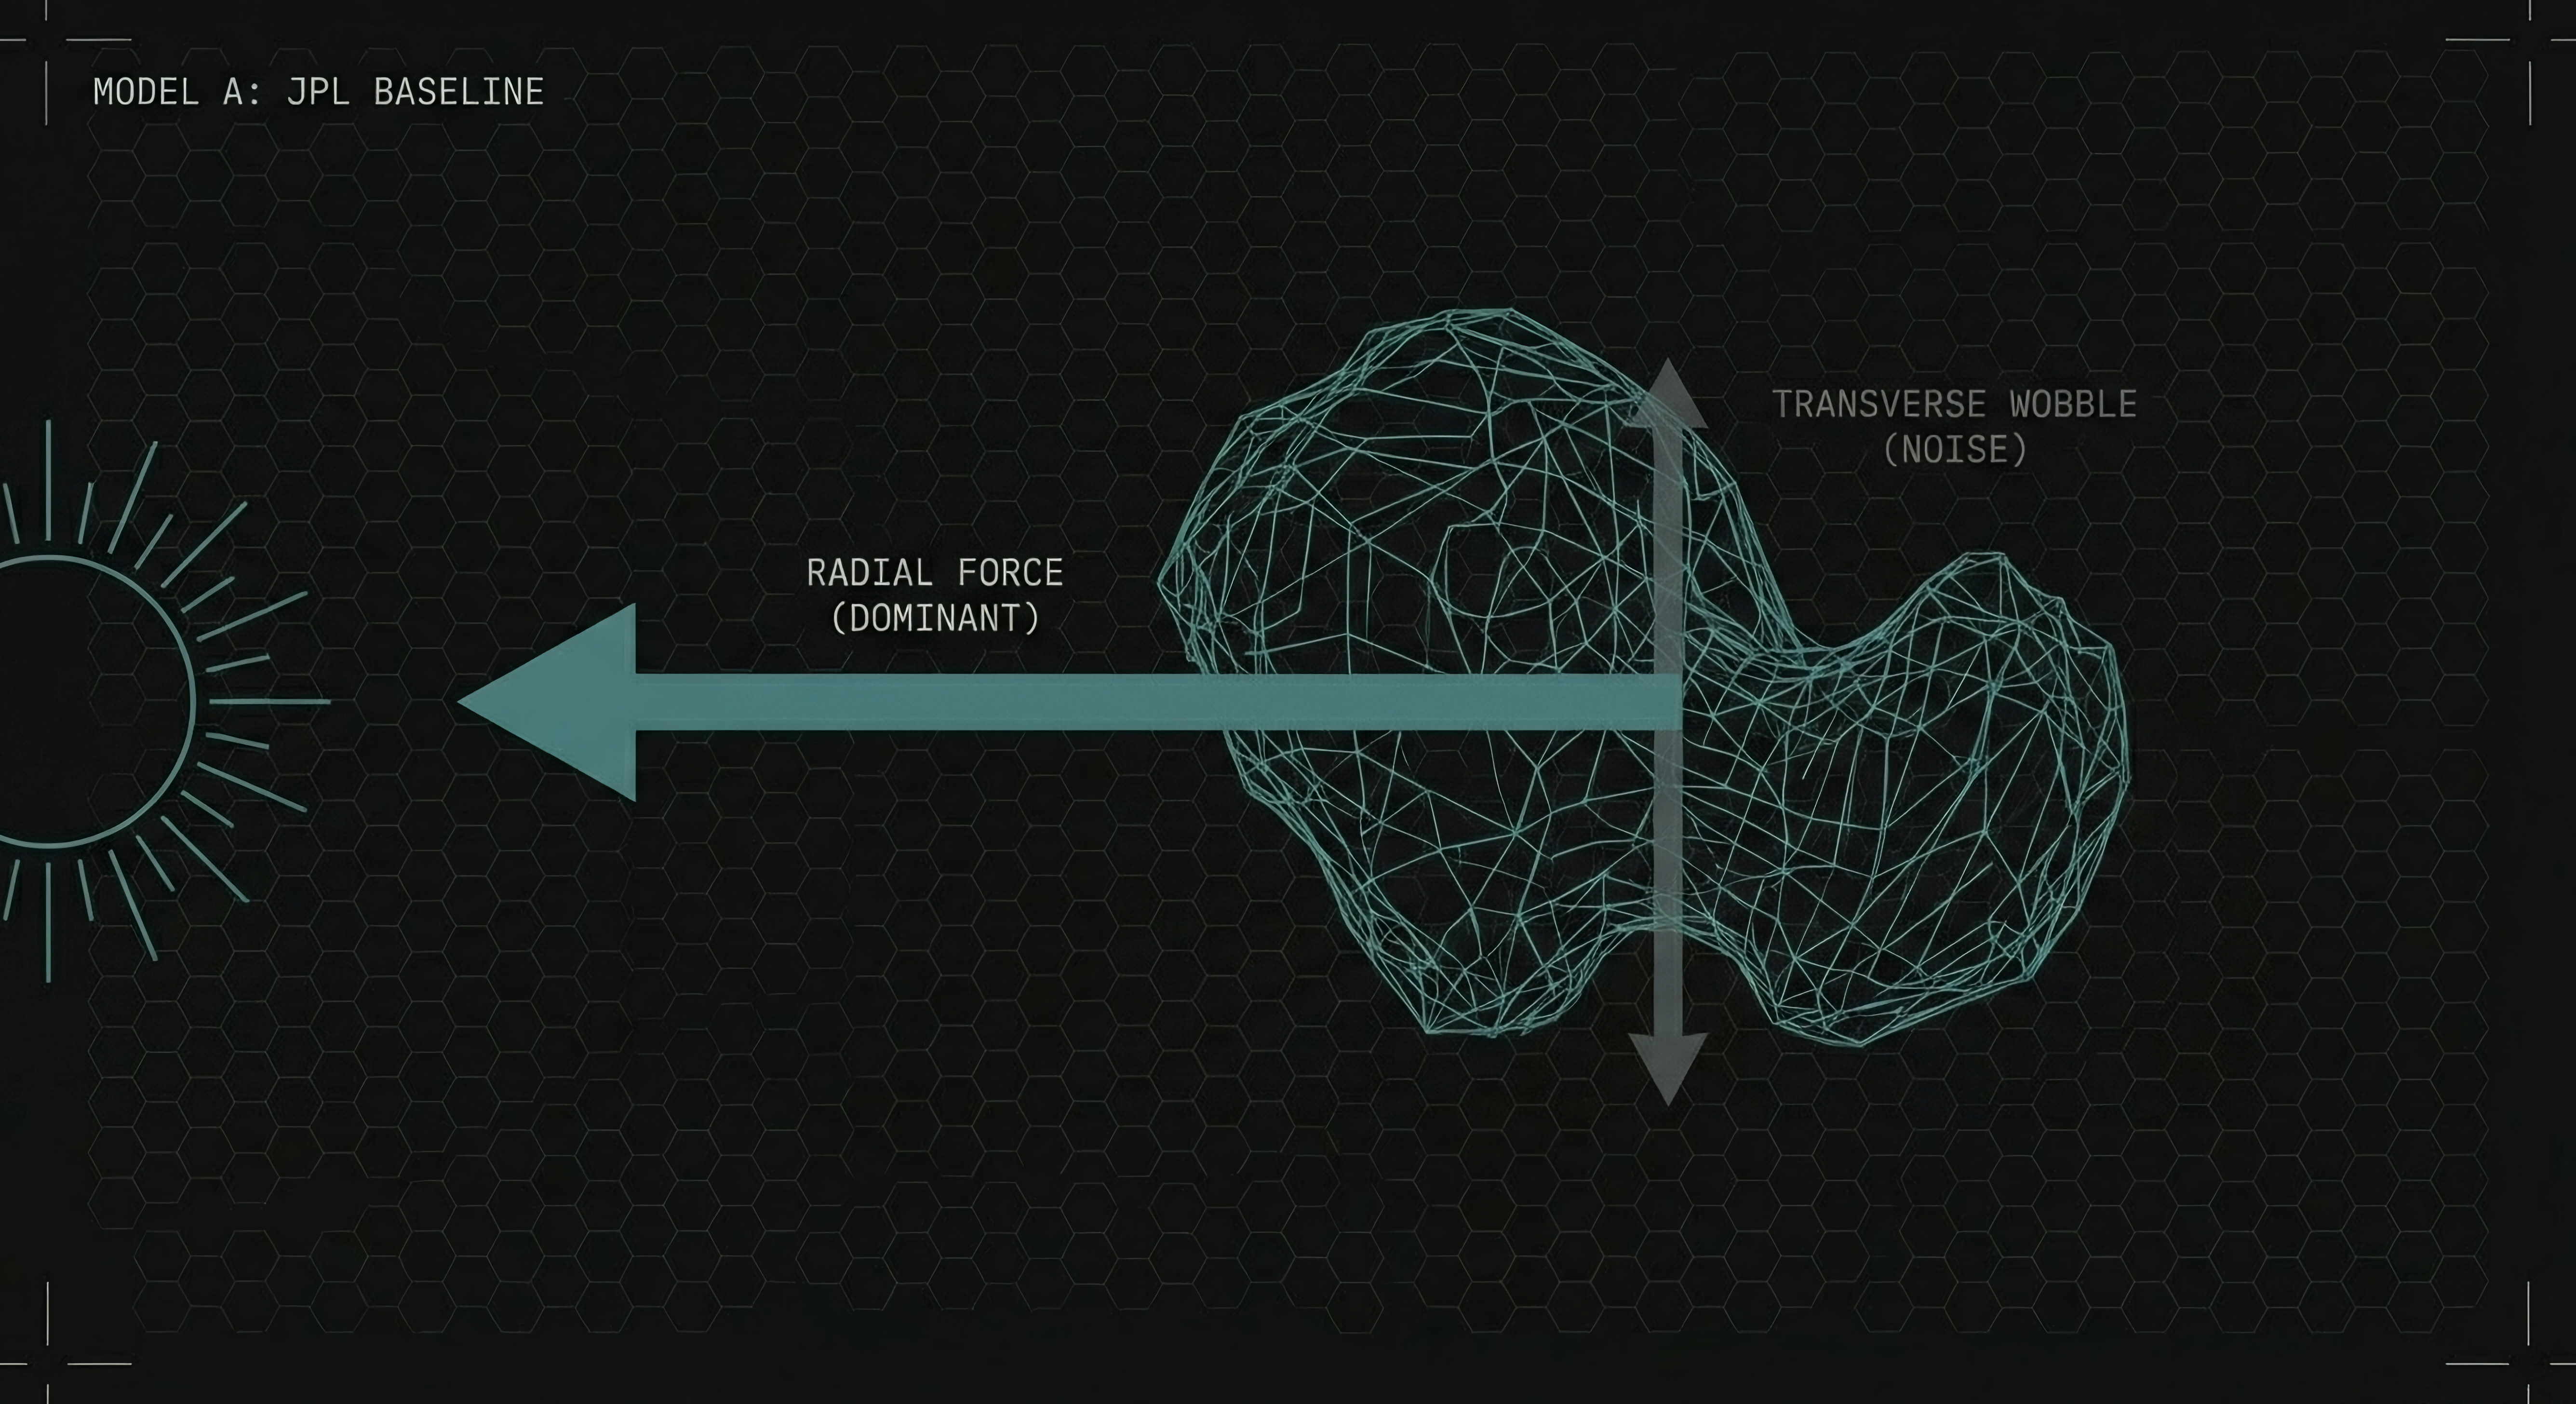
That push gets broken into three directions. Radial: toward or away from the Sun. Transverse: sideways through the orbit. And normal: up or down out of the orbital plane.
On a standard comet, the picture is simple. Sunlight heats the dayside. Ice burns off into gas. The gas jets out, mostly sunward. The comet gets kicked backward. The radial force dominates. There’s usually a small sideways wobble because no comet is perfectly symmetric, but it’s a minor correction. The back-and-forth is the main event. The sideways is noise.
Now here is what this team found when they used the full dataset.
The sideways force on 3I is not noise. It is the same magnitude as the radial force. Not a secondary wobble. Not a rounding error. The push through the orbit is just as strong as the push away from the Sun.
Think about what that requires. If you are standing behind a fire hose and the water is blasting straight ahead, all the recoil hits you in the chest. You get pushed straight back. To get an equal sideways kick -- to feel just as much force pushing you left as pushing you backward -- you would have to aim the hose at a steep angle off to the side. Roughly 45 degrees.
Something on 3I is aimed off-axis. Significantly.
Now here is where it connects to what we’ve already documented.
The Heartbeat showed three jets at 120-degree separation, wobbling on precise harmonic periods, with collimated beams angled away from the radial direction. Serra-Ricart et al. (2026) confirmed high-latitude jets locked to the object’s spin axis. The Hubble images show the geometry. This paper measures the force that geometry produces. The nozzles and the thrust vector match.
And here is where NASA JPL’s curation matters.
In JPL’s 782-observation solution, the sideways force is roughly five times smaller than the radial force. A minor correction. Noise. Nothing to see here.
In this team’s 7,578-observation solution, the sideways force is equal to the radial force. If you want to know whether something is being steered versus just randomly venting gas, there’s one measurement that answers that question better than anything else. It’s the smoking gun. And it only shows up when you look at all the data. The moment you throw out 90% of the observations, that smoking gun disappears — and suddenly the object looks a lot more like an ordinary comet.
THE SENTINEL ASSESSMENT:
We have documented this methodology before. In The Silent Edit, a single velocity sign was flipped to force a meteor back into a Solar System origin. In The Wide Angle, Princeton injected 0.33 magnitudes of artificial error into HATPI’s data to make the comet model fit.
The method is always the same. You don’t fabricate data. You select it. You vet it. You pre-process it. And at the end of the pipeline, the anomaly that was screaming in the raw data is whispering in the official product.
Spada, Krolikowska, and Dones didn’t set out to challenge NASA JPL. They used the public dataset, ran standard orbital mechanics, and the sideways engine reappeared on its own.
THE FLIP
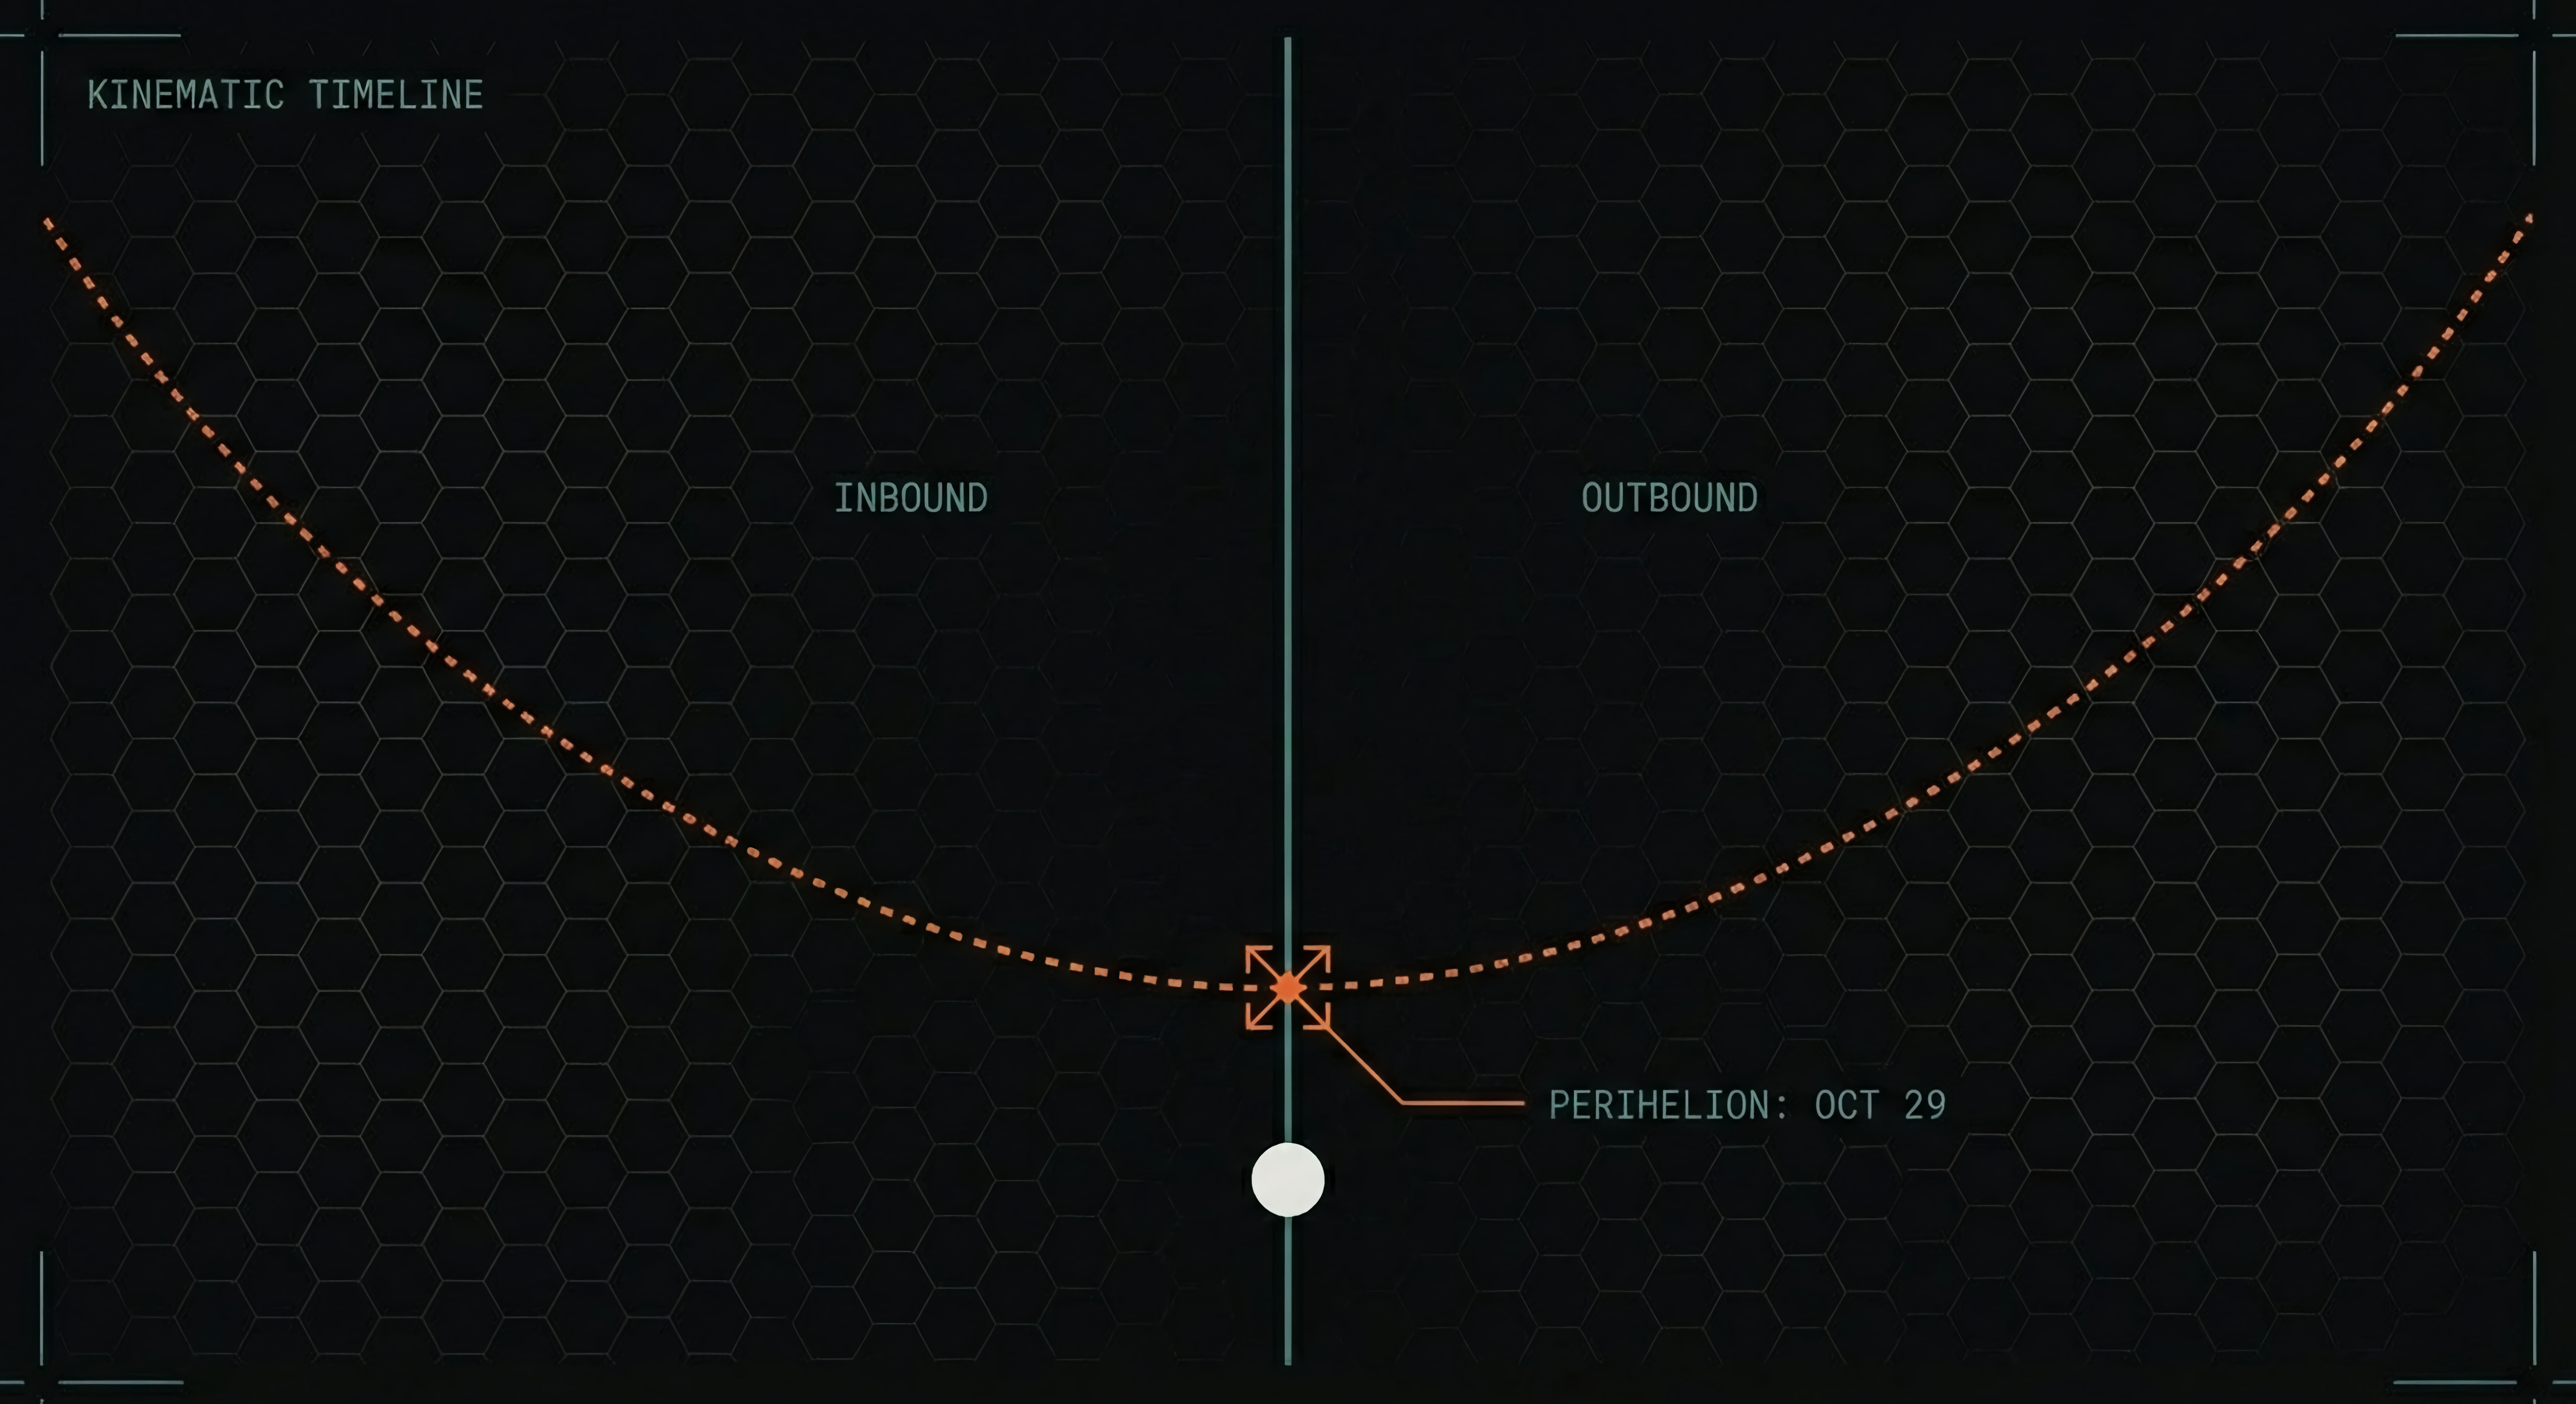
The team did something no one else has done. They split the full dataset at perihelion -- the point of closest approach to the Sun on October 29 -- and ran the trajectory fit on each half seperately.
Before perihelion, the sideways force was strong and positive: +4.48.
After perihelion, it effectively collapsed: -0.22.
The object was being pushed sideways in one direction on the way in. After it rounded the Sun, that push basically vanished and slightly reversed.
The radial force? Roughly stable across both halves. The perpendicular force? Stable. Only the transverse component -- the one that determines where you end up in your orbit -- underwent a dramatic shift at the precise moment the object was closest to the Sun.
The authors describe the pre- and post-perihelion estimates as “mutually inconsistent.” They leave it there.
We documented what appears to be a mode change event in late December. The Heartbeat captured four nights of steady 7.2-hour cycling in the jet structure, followed by an abrupt change. The Ignition Sequence tracked the chemical systems switching on one by one at specific distances from the Sun on the inbound leg -- CN gas at 2.97 AU, water at 2.7 AU, each activating at its own threshold like systems in a power-on sequence.
Now the trajectory dynamics independently confirm what the imaging and the chemistry were already showing: the propulsion profile inbound is fundamentally different from the propulsion profile outbound. The system that pushed 3I toward the Sun is not the same configuration that is pushing it toward Jupiter.
THE SENTINEL ASSESSMENT:
Comets can behave differently on the way in versus the way out. The Sun bakes new material, venting patterns shift. That’s real science and we are not dismissing it.
But here is what doesn’t happen on a melting snowball: one specific direction of force flips while the other two hold steady. If the Sun is randomly cooking a tumbling rock, everything changes at once. It gets messy. It doesn’t cleanly switch one channel while leaving the others untouched.
That’s what a system reconfiguration looks like. And it happened at the same time the jets reconfigured.
THE EARLY BURN
The team ran one more test. Instead of assuming the force peaked at the closest point to the Sun, they let the math find the peak on its own.
It did.
6.97 days before perihelion.
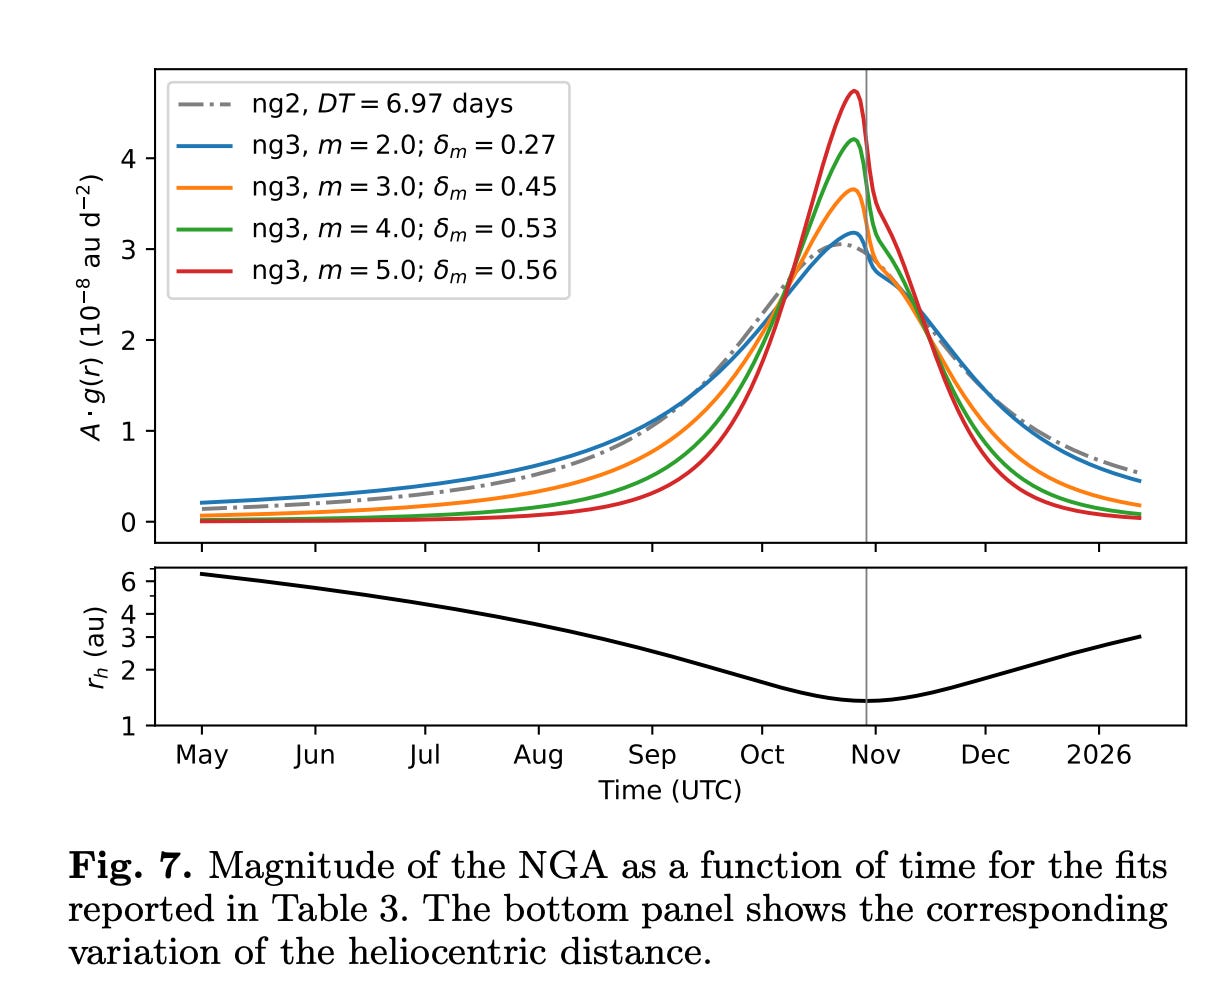
The object was pushing hardest a full week before it was closest to the Sun. By the time it reached the hottest point in its orbit, the force was already fading.
Think about what that means. If the Sun’s heat is driving the outgassing, the force should peak when the heat peaks. That’s how ovens work. That’s how ice melts. The hottest moment produces the most steam.
3I was producing the most steam a week before the hottest moment. Then it dialed back as it got closer.
That is not how melting works. That is how slowing down works.
If you are coming in fast and you need to slow down before a turn, you push hardest on the approach. By the time you hit the turn, the work is done, you let off the brake and coast through. We identified this pattern in Dossier 001: The Geometry of Contact months ago, before this paper existed.
The authors report the 7-day difference. They do not ask why a melting snowball would peak before maximum heat.
THE SIZE ILLUSION
Here is where the paper gets quietly devastating.
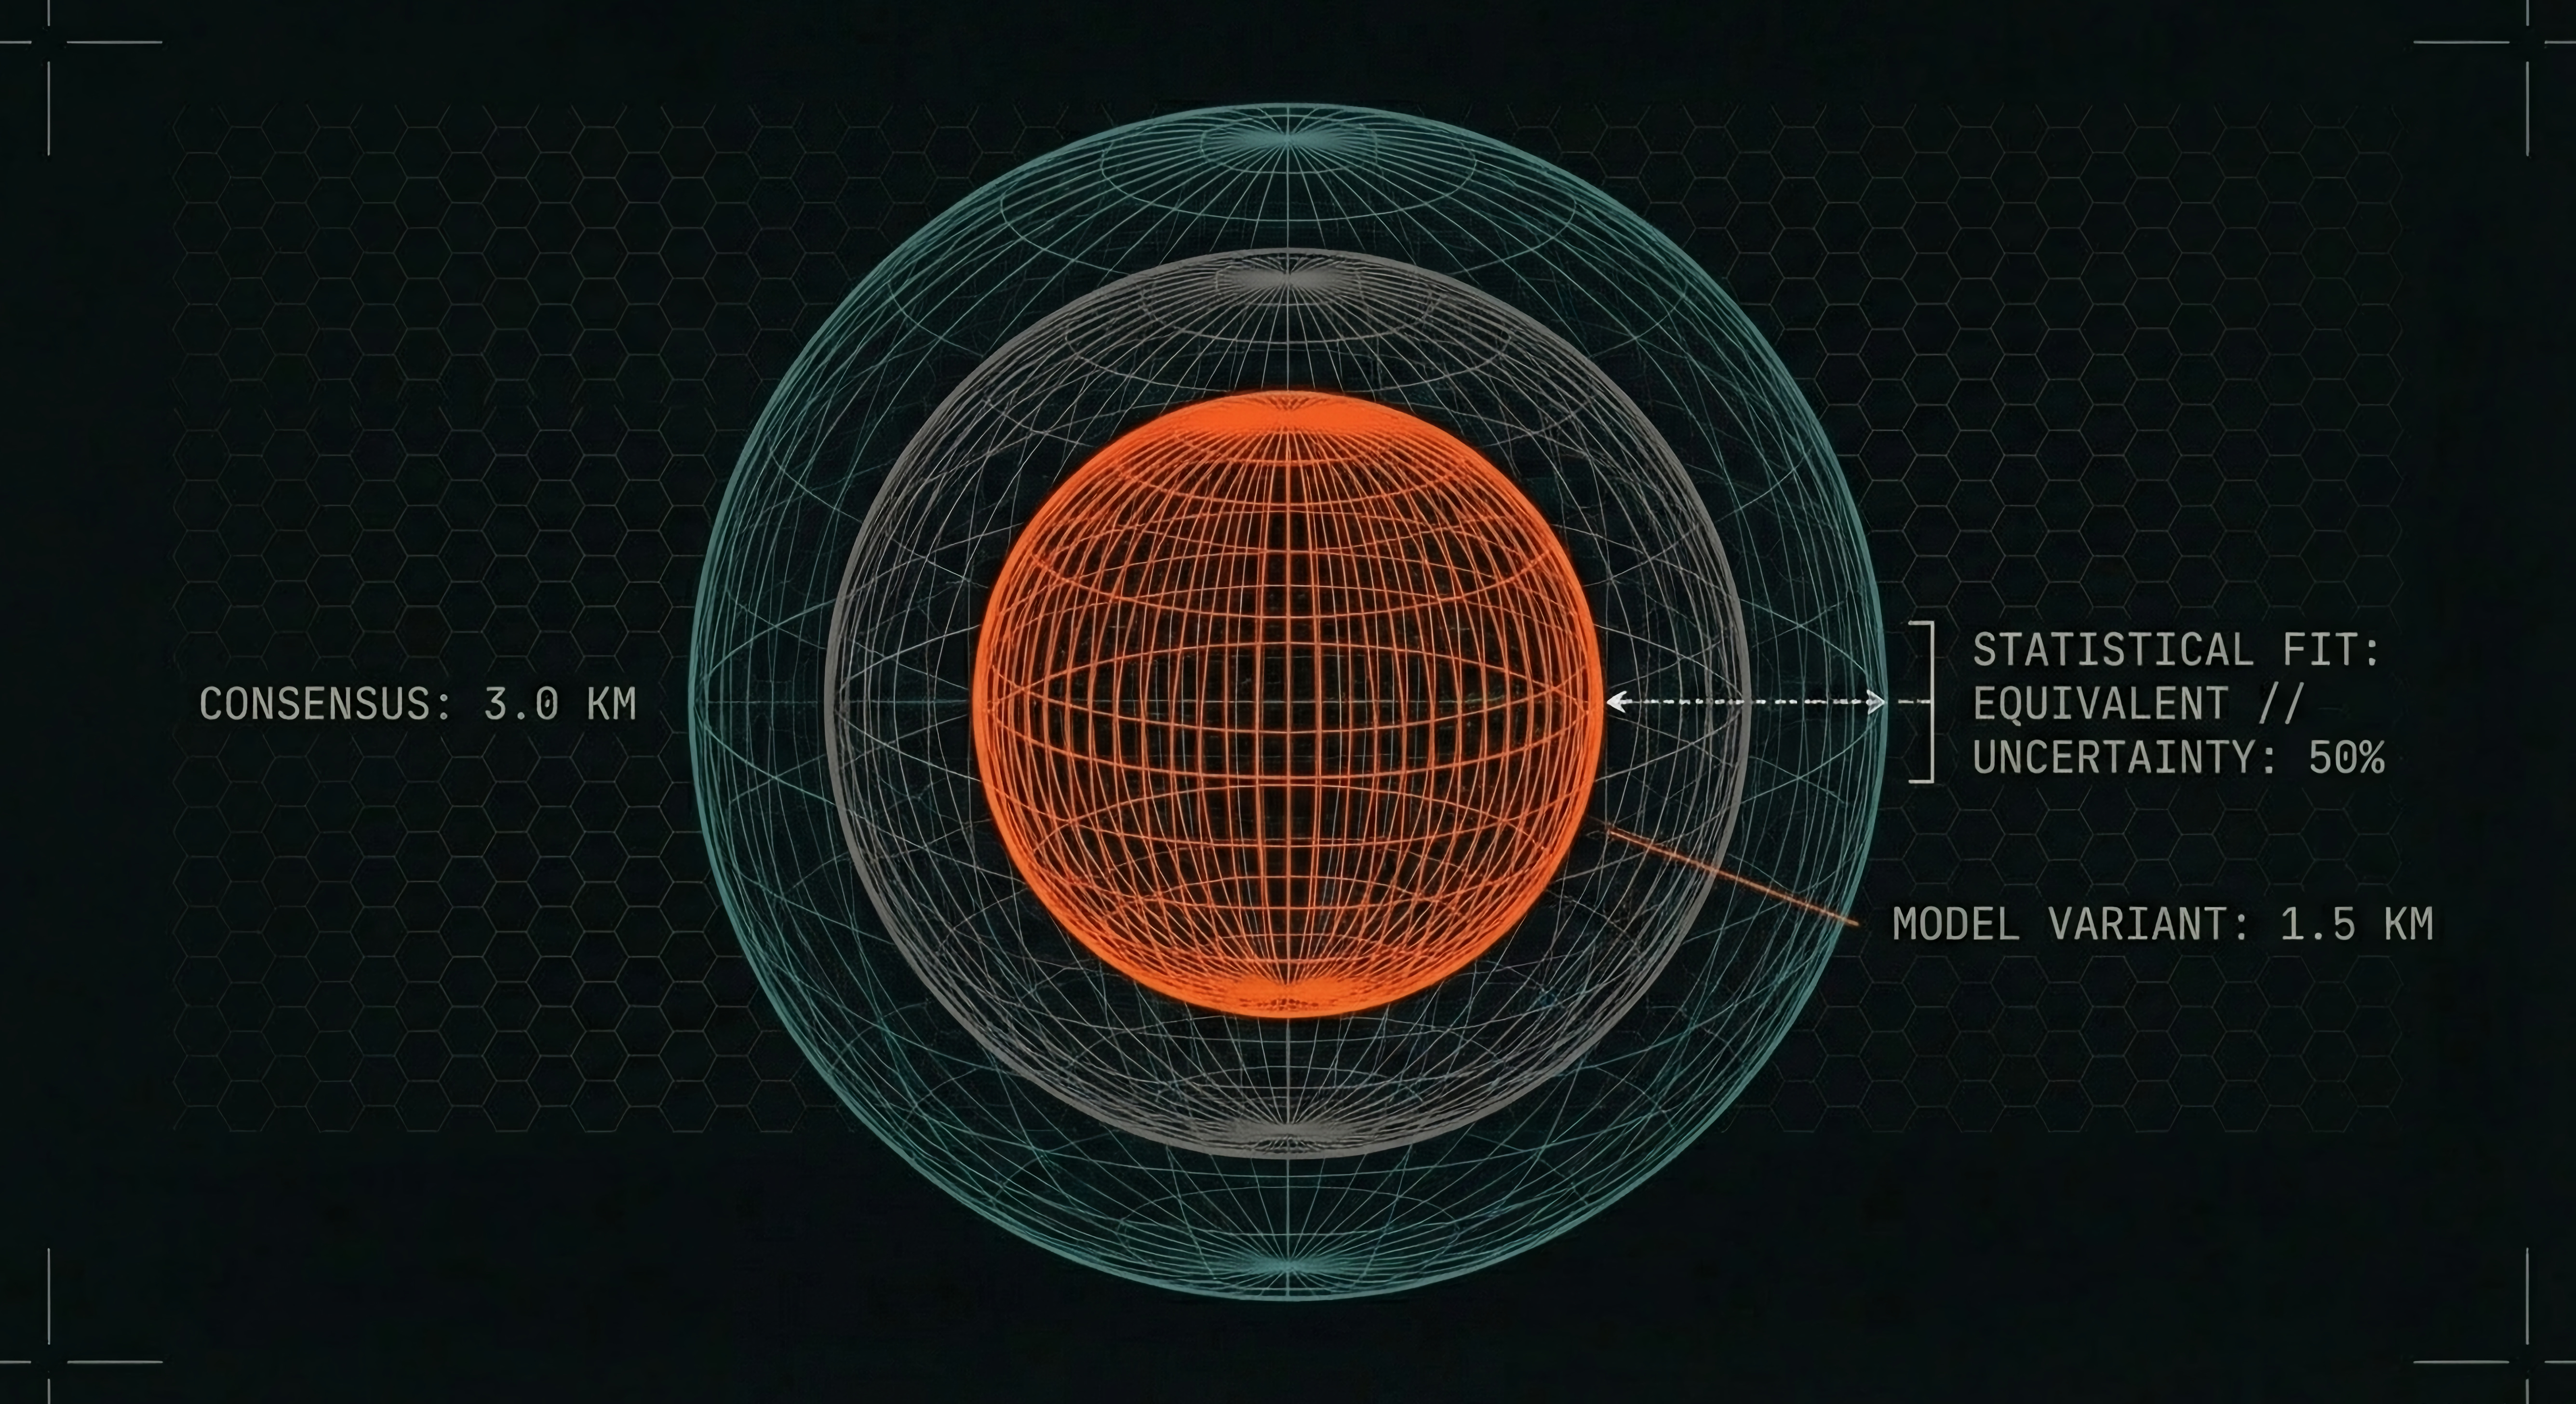
For months, the working estimate has been that 3I’s nucleus is roughly 3 kilometers across. That number has shown up in press releases, in follow-up papers, in every discussion about what this object might be. It comes from Hui et al. (2026), and it became the consensus almost overnight.
But that estimate depends on knowing the total force acting on the object. And the total force depends on which mathematical model you use for how the outgassing changes with distance from the Sun.
This team tested multiple models. Every single one fits the data equally well. The math cannot tell them apart. But the total force they imply ranges from 5.5 to 18.9. Same observations. Same statistical quality. Completely different answers.
The paper states it directly: the resulting uncertainty in the radius is “as large as approximately 50%.”
The nucleus could be 3 km. Or it could be 1.5 km. The models say both are equally valid.
Here is why that matters. The smaller the nucleus, the harder it is to explain the push. A smaller object weighs less. If the same amount of force is shoving a lighter object, something has to give. Either the object is producing vastly more gas than its size should allow, or the gas isn’t what’s doing the pushing.
At 3 km, the comet model is already under strain. At 1.5 km, it starts to buckle.
THE SENTINEL ASSESSMENT:
The scientific community has been calling this object a comet for eight months. They cannot tell you how big it is. Three mathematical models. Same data. Same fit quality. Nucleus size anywhere from 1.5 to 3 km.
In The Ghost Coma, Shanghai proved that 80-90% of the water was coming from somewhere other than the surface. In The Wide Angle, Princeton proved the exterior brightens faster than the interior. Now this team has proven that the nucleus size itself is a guess -- and the smaller it turns out to be, the worse the comet model performs.
The framework is breaking from the inside.
THE FRAGILE LOCK
One more finding. This one is about how little we actually know.
The team did a standard stress test. They pulled out one observatory’s data at a time and re-ran the entire calculation. If the answer is solid, no single removal should matter much.
Most didn’t. Take out the big ATLAS survey telescopes -- barely a ripple. Take out the TESS pre-discovery images -- almost nothing. Take out Hubble -- small shifts.
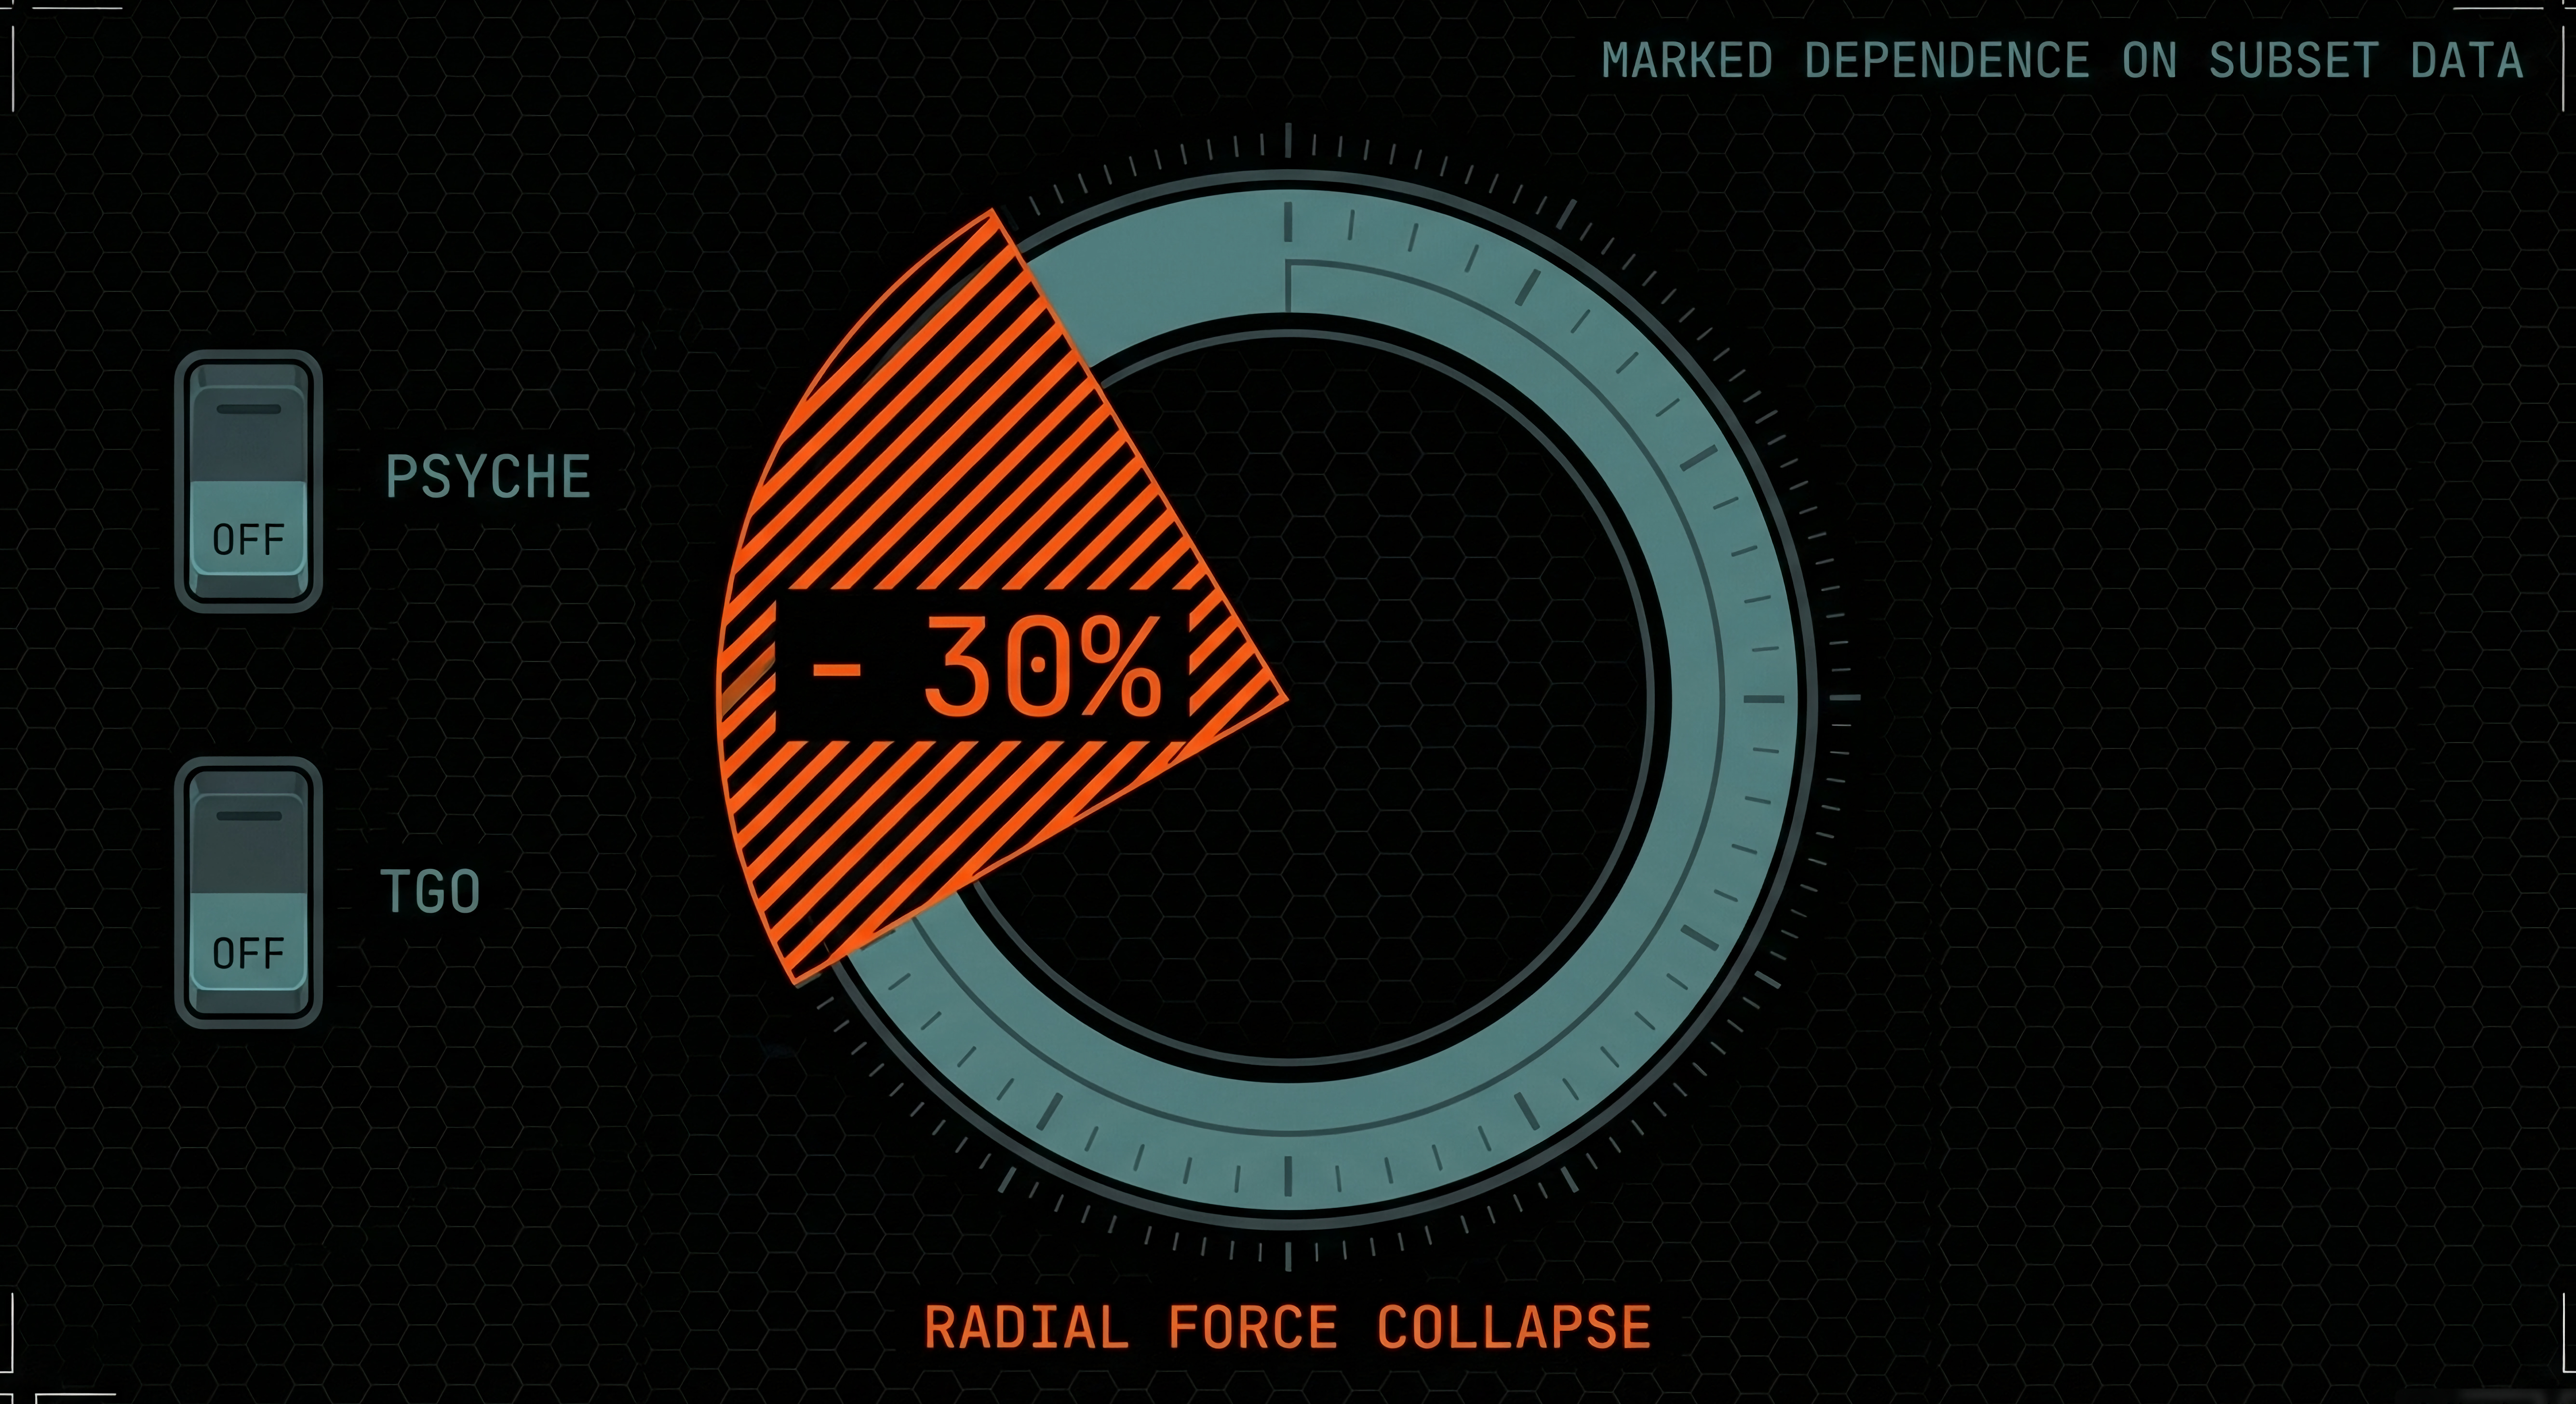
Then they pulled out the data from NASA’s Psyche and ESA’s Trace Gas Orbiter.
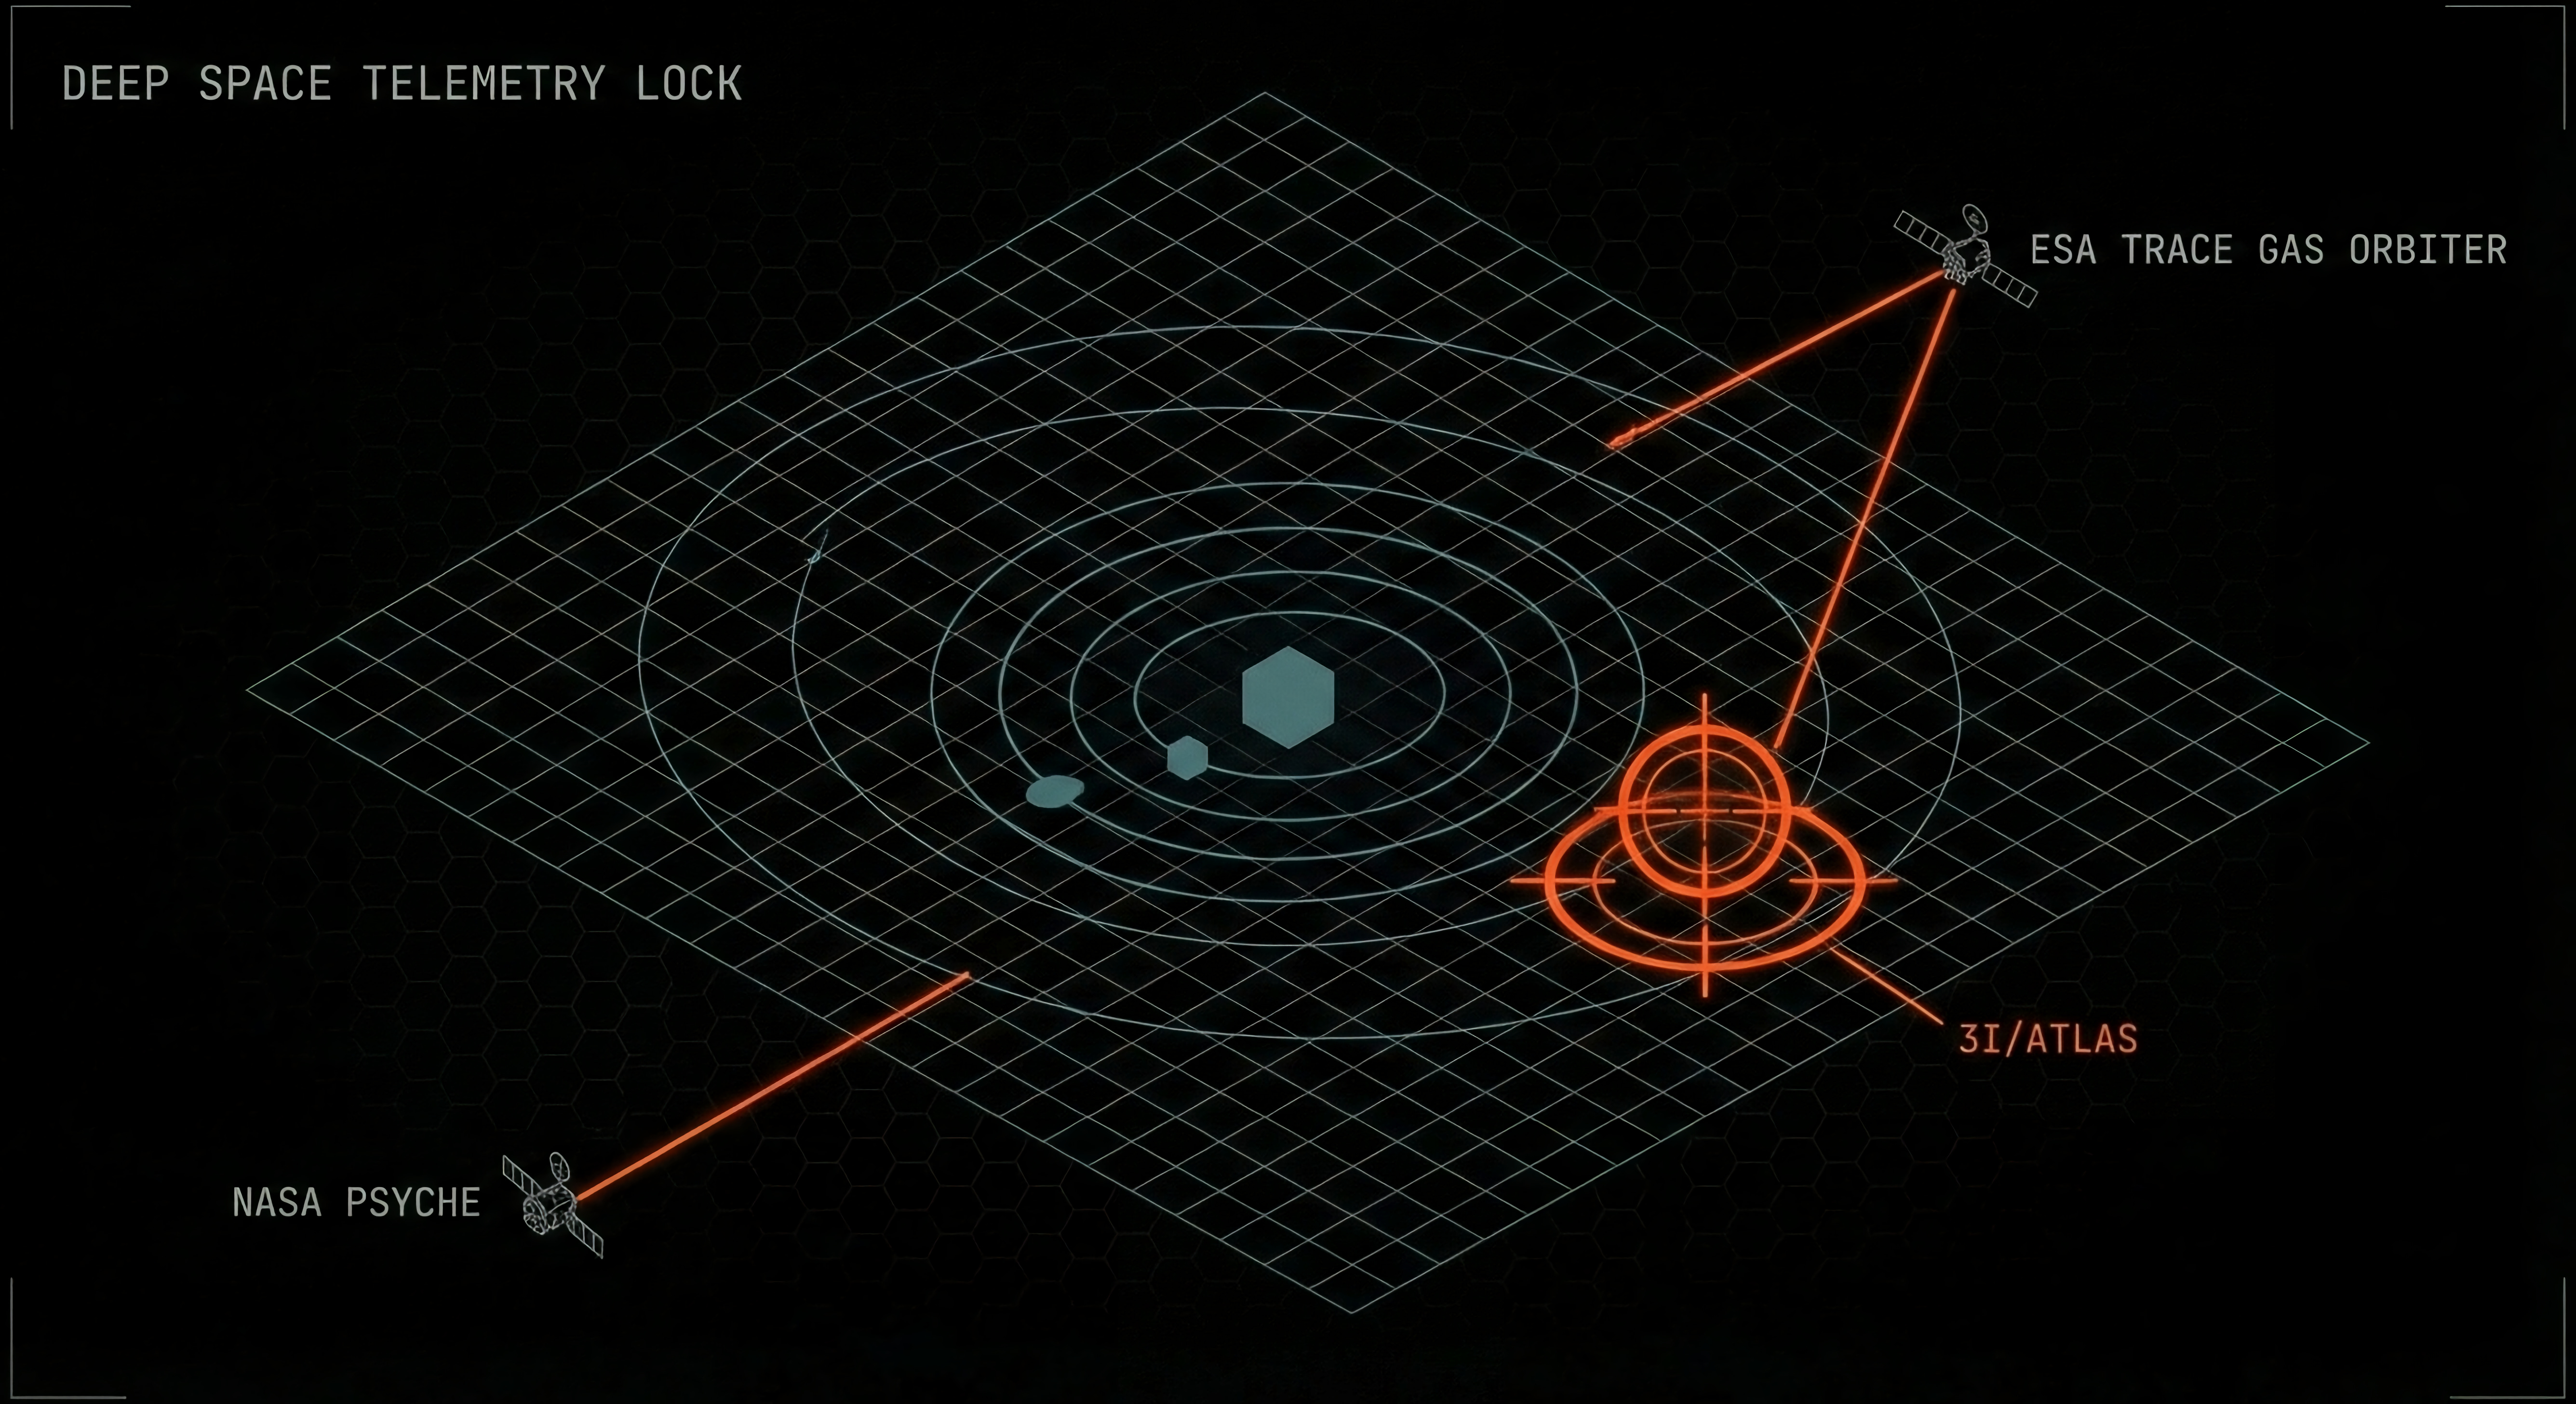
These are two deep-space spacecraft. They weren’t designed to study 3I. They happened to be millions of kilometers from Earth, pointed in the right direction at the right time, and someone thought to use them. A handful of observations from platforms that will never be in those positions again.
When those data points came out, the radial force dropped nearly 30%.
The entire picture of what is pushing this object shifted dramatically because a few lucky measurements from two spacecraft were removed. The authors call it a “marked dependence on a very small subset of data points.” They note that these vantage points capture something that ground telescopes and near-Earth satellites physically cannot see.
That’s the state of our knowledge eleven days before Jupiter. The force profile of the most anomalous object in recorded history depends on a handful of observations that nobody planned, from platforms that were just passing through.
That’s not a conspiracy. It’s a gap. But it is a gap that benefits anyone who wants the official answer to stay unchallenged.
WHAT THE PAPER SAYS AND WHAT THE DATA SHOWS
The authors are careful, credentialed scientists. They tested their results three different ways. All three agreed. The work is rigorous. The data is immaculate.
What they found: a sideways force that NASA JPL’s curation made disappear. A force that reversed direction at perihelion. A peak that arrived a week before maximum heating. A nucleus that could be half the size everyone assumed. And a trajectory solution that shifts dramatically when you remove a handful of lucky spacecraft observations.
What they concluded: the acceleration is “broadly consistent” with cometary models.
We have been covering this object across twenty-seven reports.
Every one sourced to the primary literature. Every prediction we’ve made -- the blackout dates, the opposition surge, the data sanitization patterns -- has been confirmed by subsequent publications.
In CONFIRMED, we laid out the suppression architecture: “Classify the object at the intelligence level. Deploy assets to image it with classified resolution. Blind the civilian instruments during the most diagnostic window. Scrub the databases when independent researchers find corroborating evidence. Gate the journals. Process whatever data does emerge through methodologies that could remove the signal.”
Now add the sixth layer: curate the trajectory. Use 782 points instead of 7,578. Make the sideways engine disappear into a rounding error. Publish the official orbit. Let every journalist in the world cite it as settled science.
Three independent researchers just unsettled it.
Eleven days to Jupiter.
Keep looking up.
-- The Sentinel
NEW: DOWNLOAD THE 3I:ATLAS — MASTER OBJECT PROFILE
Share this report. The Suppression Gradient documented what happens when this coverage reaches platforms that don’t want you reading it. Every share, every restack, every forwarded link is a data point against the gradient.
If you’ve read the paper and see something we missed -- or something we got wrong -- message us -- we want your data.
Previous briefings: Dossier 001 | The Sentinel Dossier | The SPHEREx Intercept | The Heartbeat | The Ignition Sequence | The Ghost Coma | The Wide Angle | Forensic Audit | The Surge | The Silent Edit | CONFIRMED: The TESS Contingency | The Suppression Gradient | The 2028 Imperative


Ok. So then what is it?
I love this stuff but I can't comprehend any of it, unfortunately, for me.