

TechDev Newsletter - Market Update Issue #82
Major Short-Term Update, Macro Remains Clear
Major update today. I’ve spent considerable time studying the charts and macro signals, and I need to share an important adjustment to the near-term forecast. The conclusion is straightforward: macro screams higher, but I now expect a short-term move lower market-wide before we catch up with the inflecting business cycle.
This isn’t capitulation to bearish sentiment. This is adaptation based on what the data is showing. I’ve always tried to give it to you straight, to share how I see it as the picture develops, and today requires exactly that kind of transparency.
The business cycle positioning remains unambiguously bullish for the macro picture. We’re at the bottom, not the top. Nothing about that fundamental read has changed. What has changed is my understanding of how we get from here to there over the next several months. The path appears more volatile in the near term than I previously projected.
I’m also launching major updates to the Portfolio Analyzer app today. The 2nd generation forecast model represents a complete overhaul of the prediction system, arriving at precisely the moment when understanding your portfolio’s trajectory through the upcoming volatility becomes most critical.
Given this adjustment to the short-term forecast, I’m temporarily shelving the trunk Local Top Meter until we’re past this near-term corrective move. In its place, I’m launching the Relief Rally Meter to track the probability of a local corrective high forming before the move down.
Today’s Topics
Market Update
Business Cycle Signals: The Macro Foundation
Ethereum’s Corrected Structure
The AMZN Analog Realignment
Wave Structure and Near-Term Projections
Fib Confluence and Timing
Bitcoin’s Extended Timeline
The Trunk Remains, Volatility Increases
Portfolio Analyzer Updates
New Forecast Model
Relief Rally Meter
Market Update
Business Cycle Signals: The Macro Foundation
Let me start with what hasn’t changed: the business cycle signals that form the foundation of this entire analysis. These indicators continue pointing unambiguously higher for the macro picture.
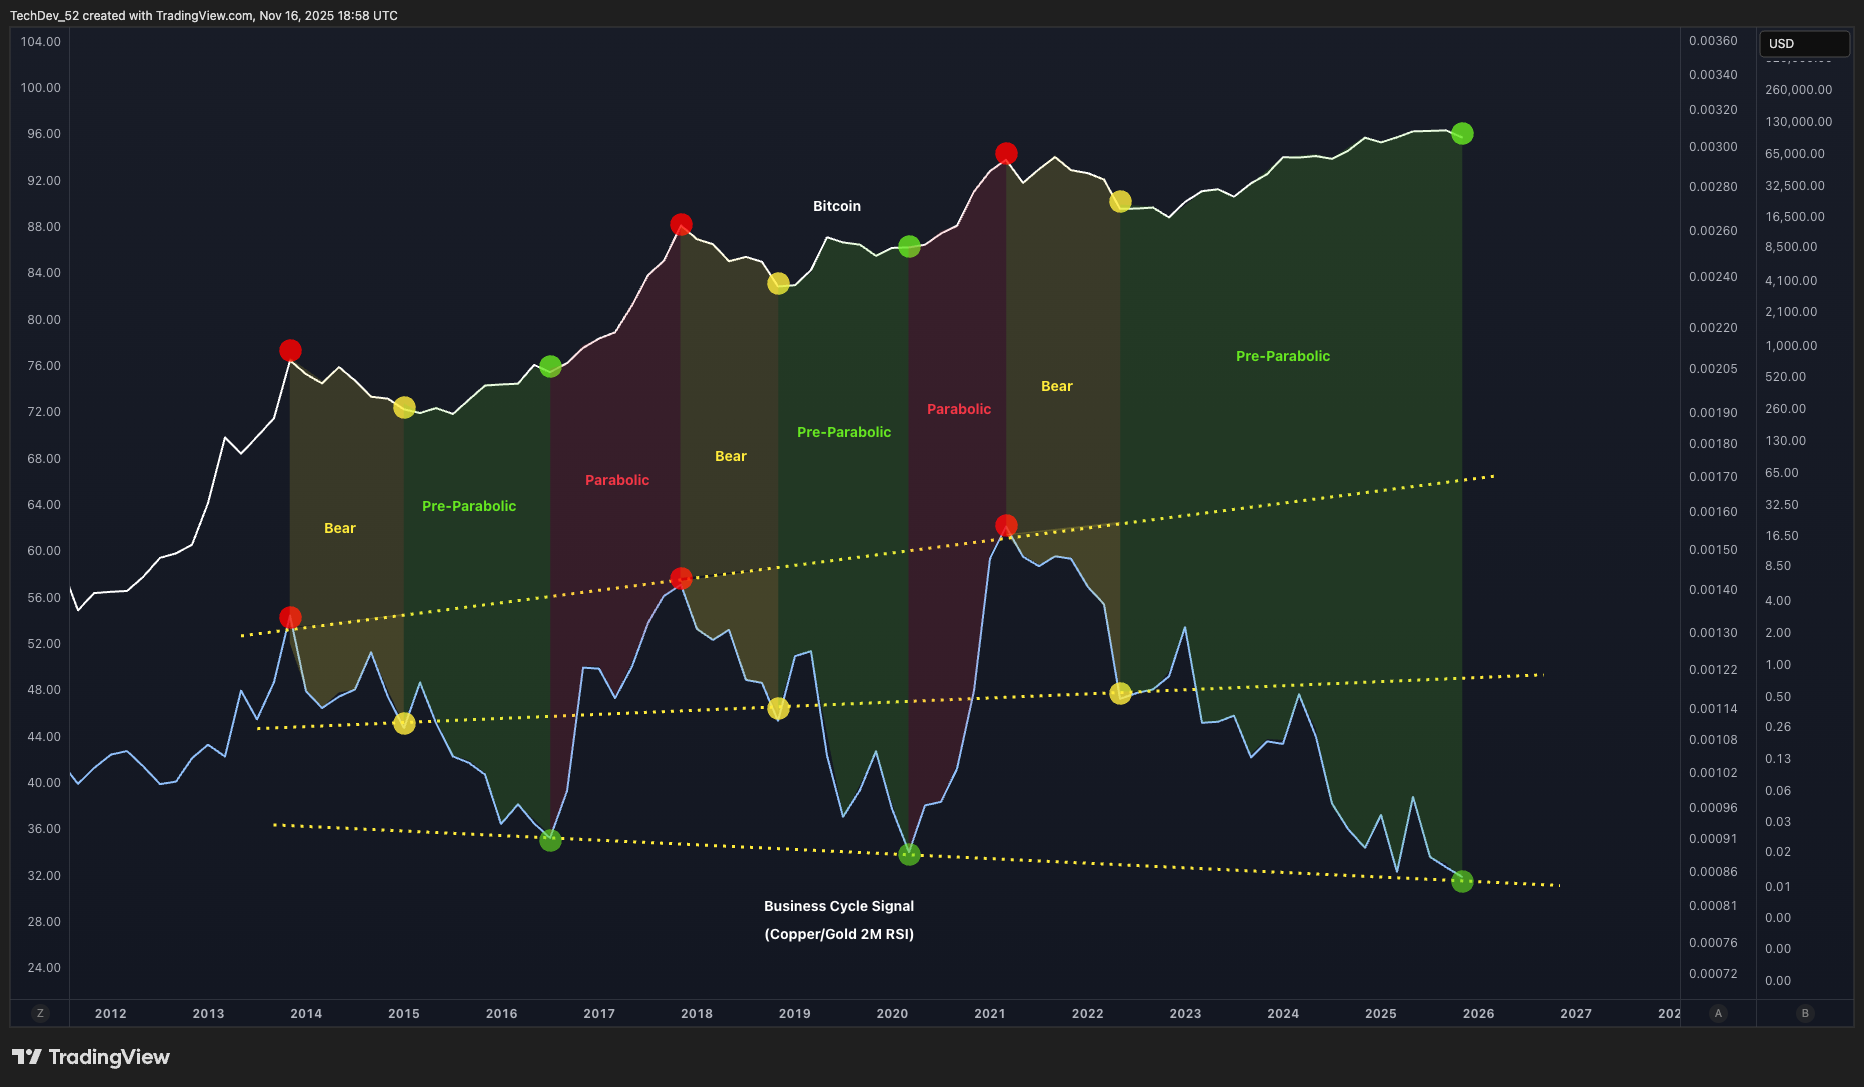
This is one of our primary business cycle signals - the 2-month RSI of the Copper/Gold ratio. This tracks the manufacturing cycle, which in turn tracks global liquidity flow and risk appetite. As I’ve detailed extensively in previous issues, this framework has explained every phase of every crypto cycle.
The pattern is crystal clear. Tops occurred when this signal hit the upper line. Bear markets ended when the midline was hit. Note the short-term bounce in the signal after each midline hit. The pre-parabolic “ramp” phase - where we’ve been stuck for what feels like an eternity - runs as the signal trends down toward the bottom line.
This current descent to the bottom has been the largest distance to fall ever recorded, which has directly produced the largest ramp phase ever. We’re now finally positioned right near the bottom.
The macro points way up. This signal doesn’t lie, and it’s not ambiguous.
Another lens on the same fundamental dynamic is the business cycle viewed directly through Copper/Gold’s 2-month MACD - what I’ve called the “Holy Grail Chart.”
We’re near the inflection level and may finally be reversing. I encourage you to study the legend in the upper left carefully. It explains every attribute of every Bitcoin cycle with remarkable precision:
Red bars at tops = USD price tops
Blue signal tops = Impulse tops
Red bar declines = Bear markets
Green bars = Bull market ramp phase
Red bar profile = Character of parabolic move
According to this framework, the parabolic move hasn’t even begun. We remain deep in the green bar ramp phase, grinding toward the inflection that will flip the bars red and initiate the acceleration everyone has been waiting for.
Again, the macro points way up. The business cycle is at the bottom, not the top.
This is the foundation. Everything that follows builds from this macro reality. The near-term volatility I’m about to detail doesn’t contradict this positioning - it’s a function of how markets actually traverse from business cycle troughs to peaks. The path is rarely smooth, especially in an environment this extended and compressed.
Ethereum’s Corrected Structure
Today I’m reversing the usual order. Ethereum is actually offering the clearest signal, in my opinion, as to what lies immediately ahead for the crypto market. We’ll start with ETH, then pivot to Bitcoin.
I previously shared this read on Ethereum against the Amazon analog, and something always bothered me about the alignment. The structural parallels were there, but the timing felt slightly off in ways I couldn’t quite articulate.
I’ve spent considerable time studying all aspects of this analog and how its forecast aligns with what other Bitcoin and Ethereum technicals have been telling me. I believe I’ve figured out the issue.
The AMZN Analog Realignment
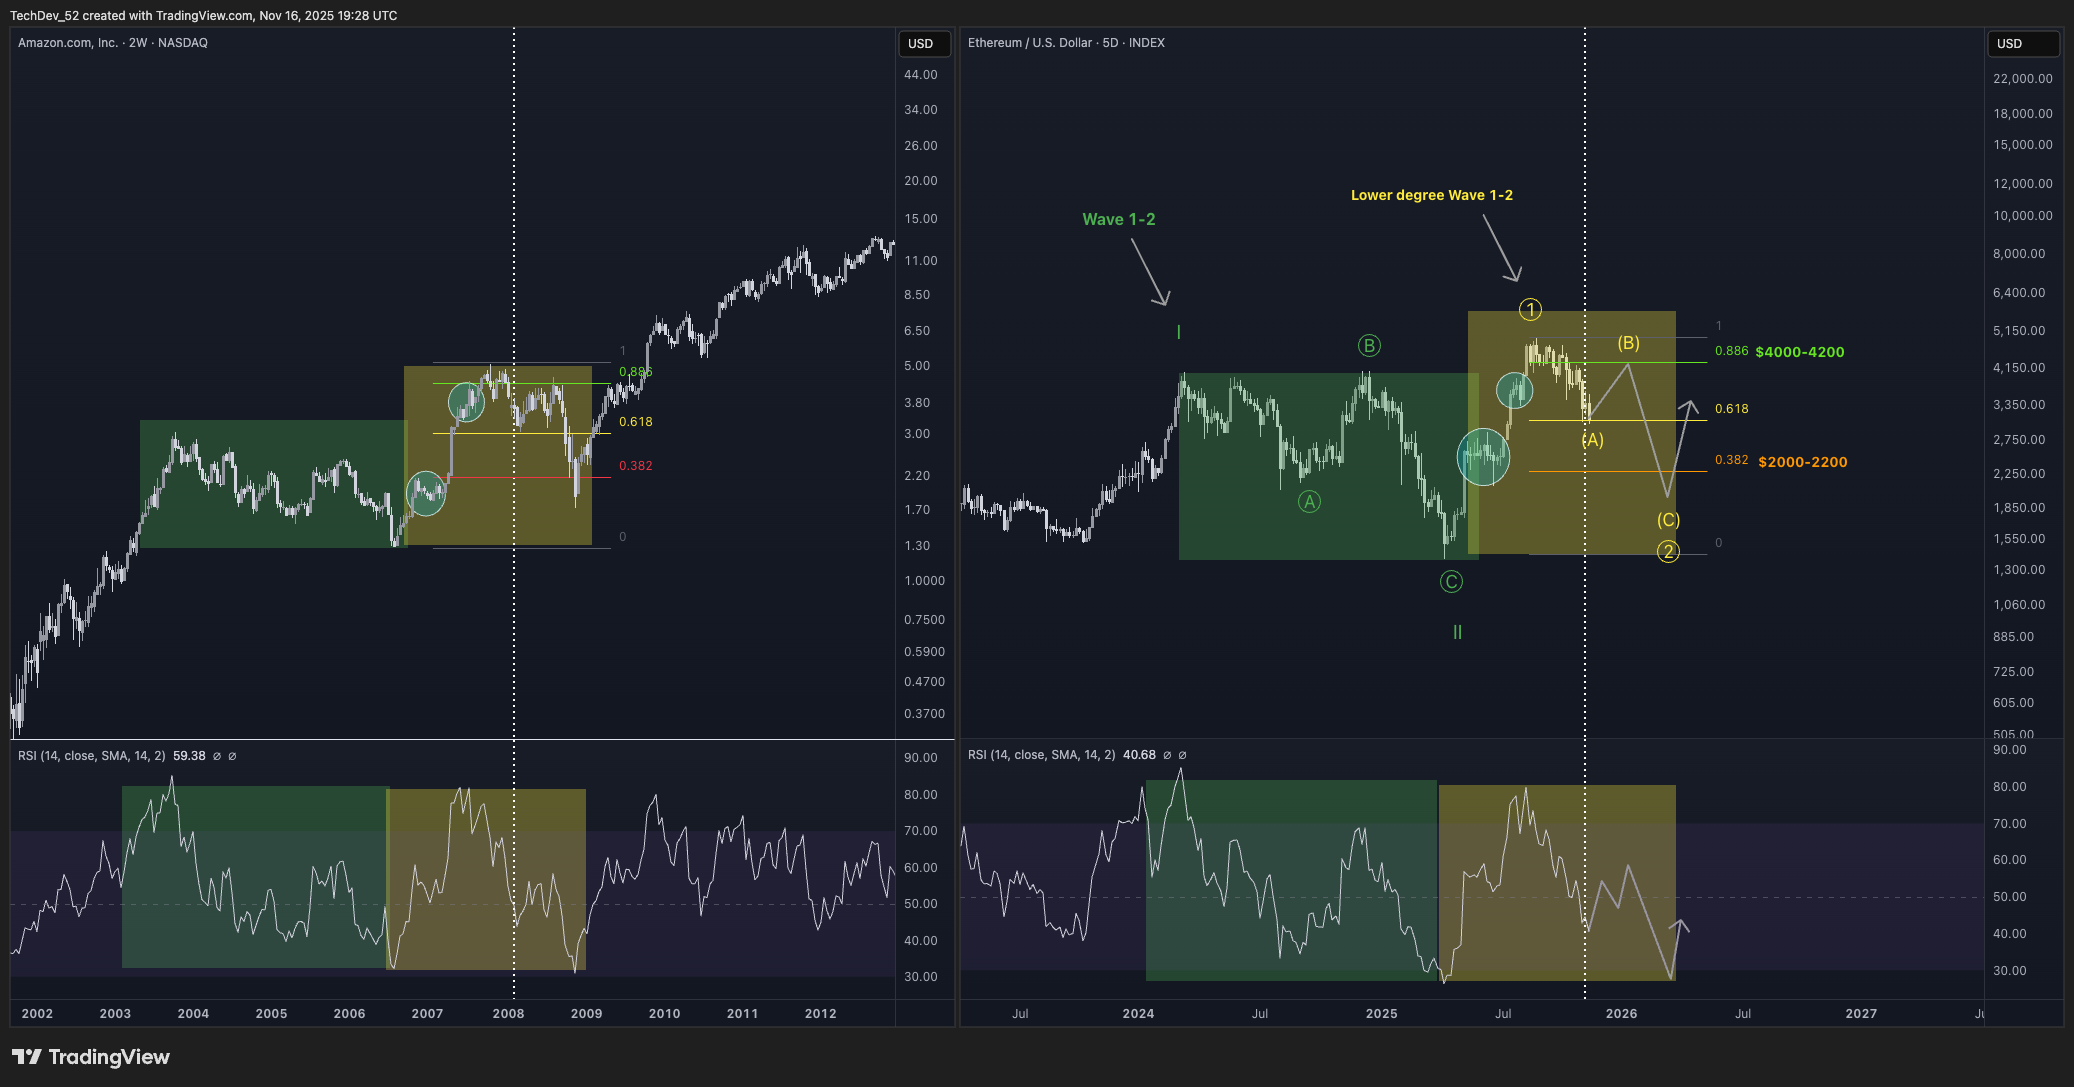
The actual wave structure alignment is like this: we’re currently positioned halfway through the volatile yellow period that follows the longer prior volatile green period.
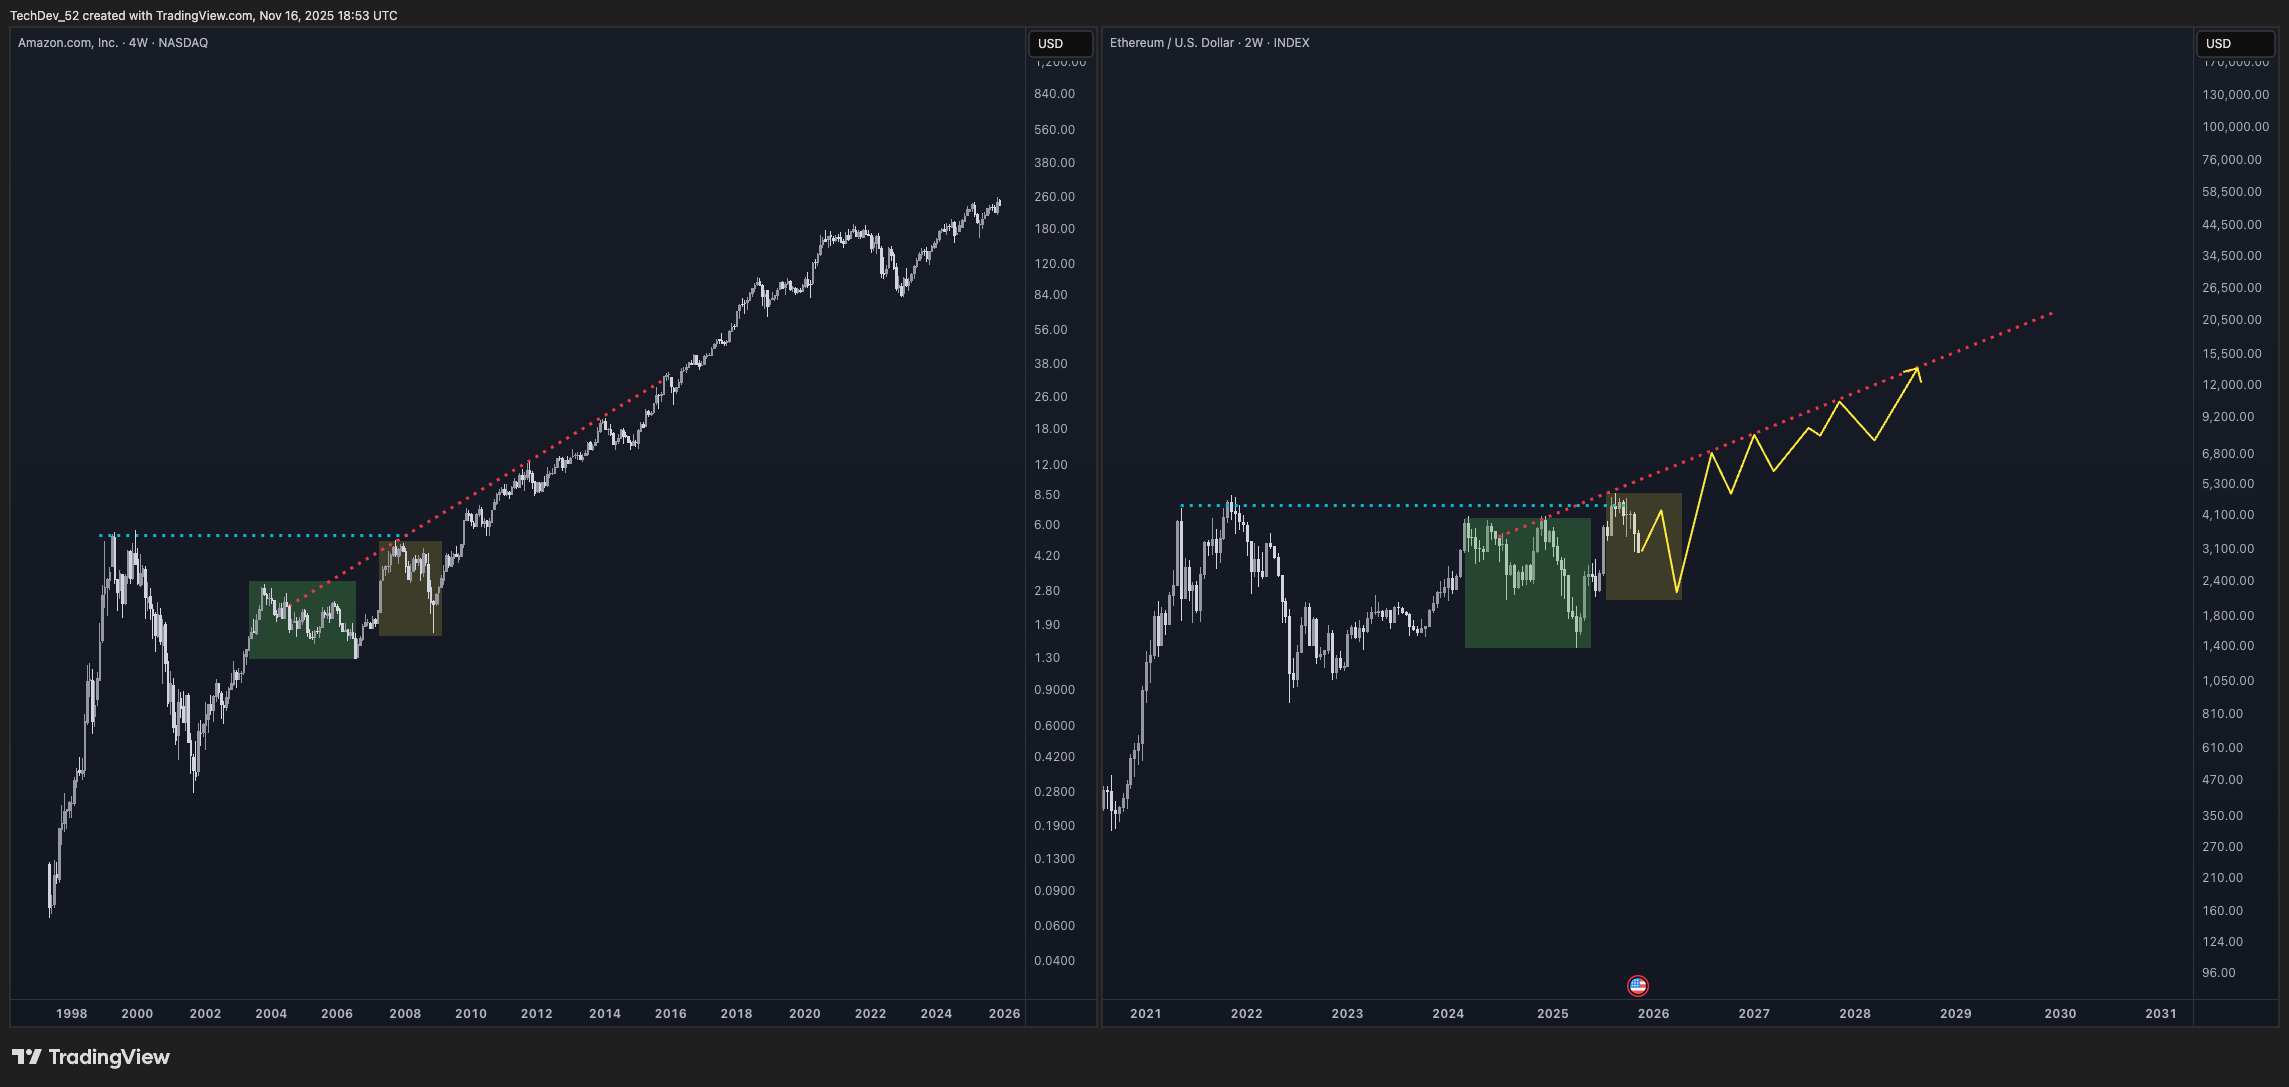
This adjustment changes the near-term projection significantly. The green zone in Amazon’s structure represented the initial recovery and volatile advance. The yellow zone represents a secondary volatile period - choppier, more prone to sharp reversals, but ultimately still advancing. Also known as a wave 1-2-1-2. More on this later.
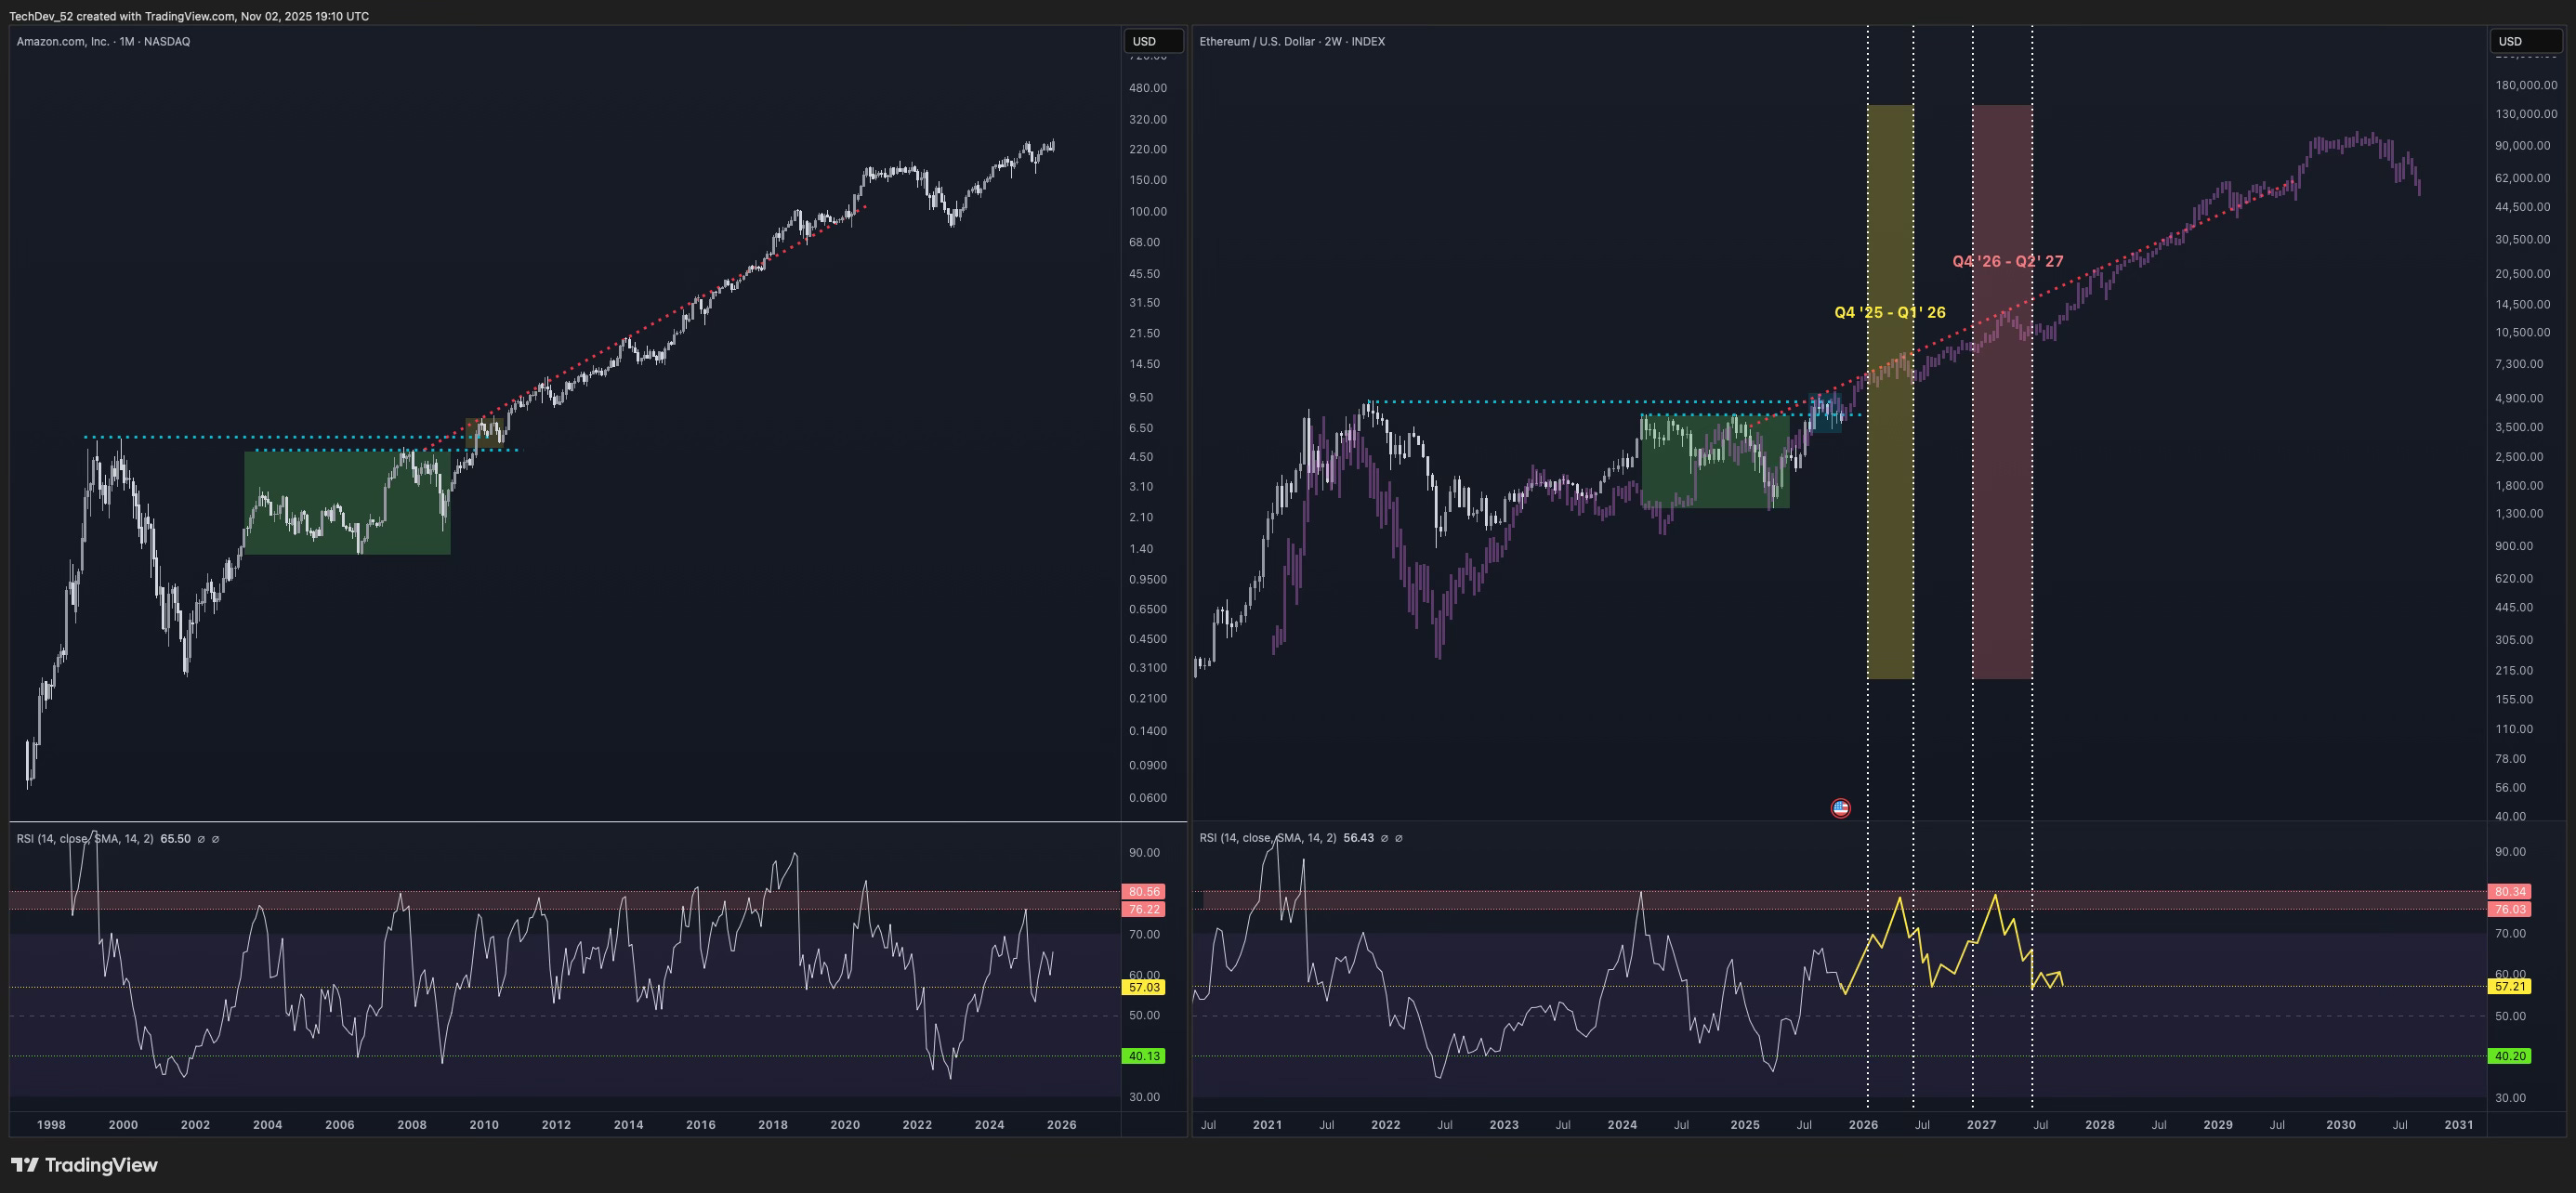
Here’s how the full projection overlays when we correct for this structural understanding:
I’m expecting a short-lived counter-trend move up, followed by a short-lived C-leg type sharp move down, followed by rapid recovery. This isn’t a macro reversal. This is intra-yellow-zone volatility playing out exactly as the analog suggests it should.
The Amazon comparison shows a remarkably similar structure in its yellow period - a bounce to retest resistance, followed by a sharp but brief decline, then resumption of the larger advance. That’s the template we’re following.
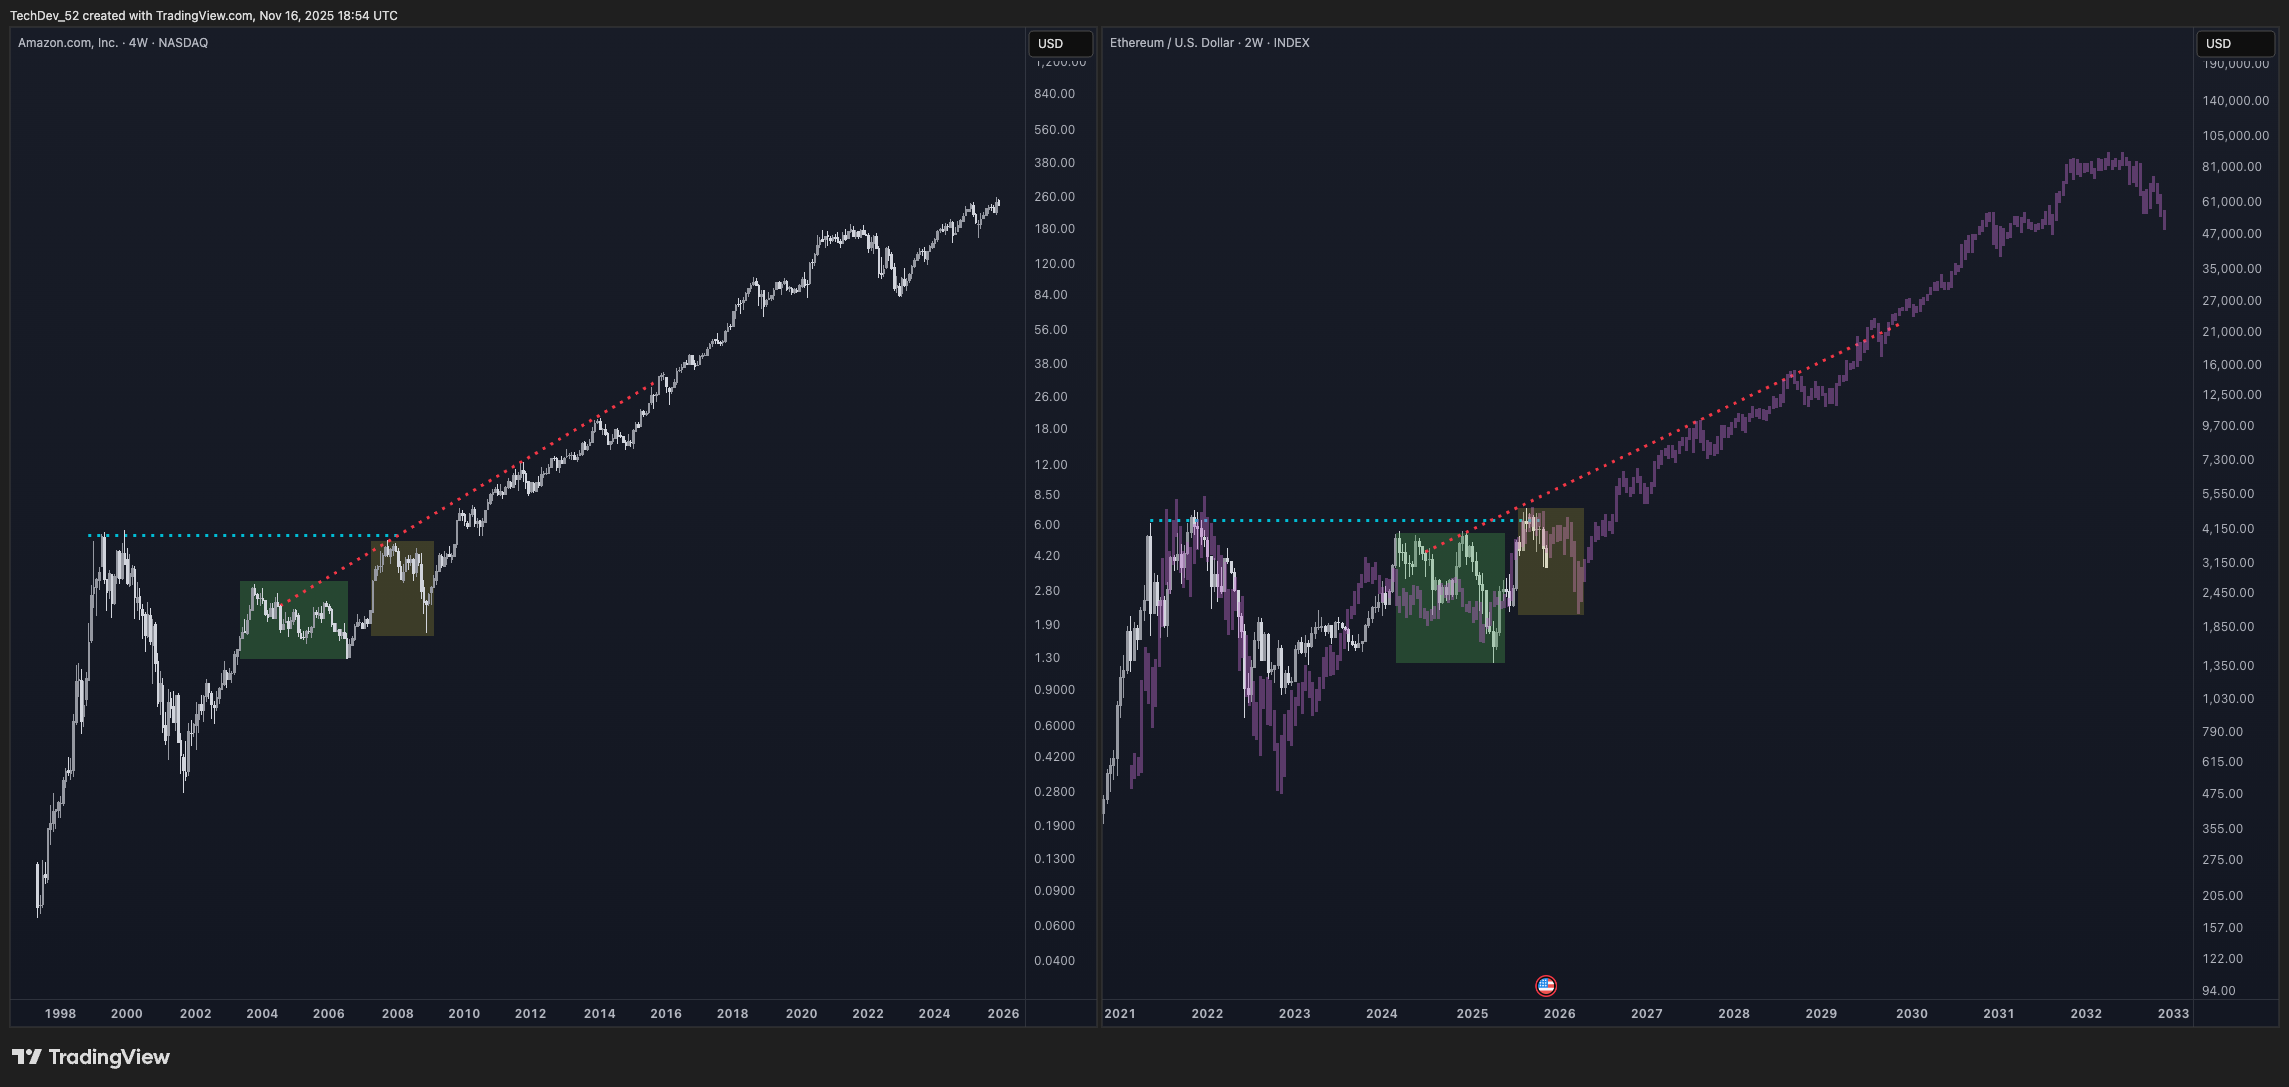
When I study the RSI carefully, the alignment becomes even more compelling. The correlation is uncanny.
The green zone was a nearly perfect RSI match - down to single RSI units in terms of precision. Ethereum didn’t extend quite as high into the yellow zone as Amazon did at this stage, but it’s now decidedly on its way down in terms of momentum.
We’re approaching the point where there’s high probability of a bounce to a local corrective high before the yellow zone move completes with RSI approaching the level where it bottomed during the green zone.
The consistency here isn’t coincidental. We’re seeing the same behavioral patterns play out at similar structural positions, which gives me confidence in projecting forward.
Fib Confluence and Timing
Let’s zoom in to examine the specific tools those interested in timing these moves can use for tactical positioning.
The retracements to 0.618 have been remarkably consistent throughout this structure. Based on the analog and the current positioning, I’m expecting:
Counter-trend corrective high: Approximately $4,000-4,200, with RSI climbing to around 55
Subsequent C-leg down: To approximately $2,000-2,200, with RSI declining to around 30
Timeline: Corrective high likely by late December/early January, low in Q1 2026
The 0.618 retracement has been the consistent level where bounces exhaust throughout this pattern. The 0.382 level has marked the lows.
Even the substructural consistency within the yellow zone advance reinforces this read.
Note the nearly identical impulsive structure in the leg up within the yellow zone. The wave character, the momentum profile, even the specific subwave relationships show remarkable consistency between the Amazon analog and Ethereum’s current behavior.
This granular level of alignment gives me confidence that the analog remains valid and useful for projection. We’re not just seeing vague similarity - we’re seeing specific structural repetition at multiple degrees.
And it is impulsive. Here’s how I read the nested wave 1-2 structure and sub-ABC formations:
The structure breaks down into clear impulses and corrections at multiple degrees. The current positioning suggests we’re in a B-wave of a larger corrective sequence before the C-leg down completes the pattern.
This matters because B-waves often produce the most frustrating price action - counter-trend moves that feel like reversals but are actually just volatility within a larger correction. That’s what I believe the bounce to $4,000-4,200 will represent.
Zoom out slightly and you see the larger 1-2-1-2 structure I read as building:
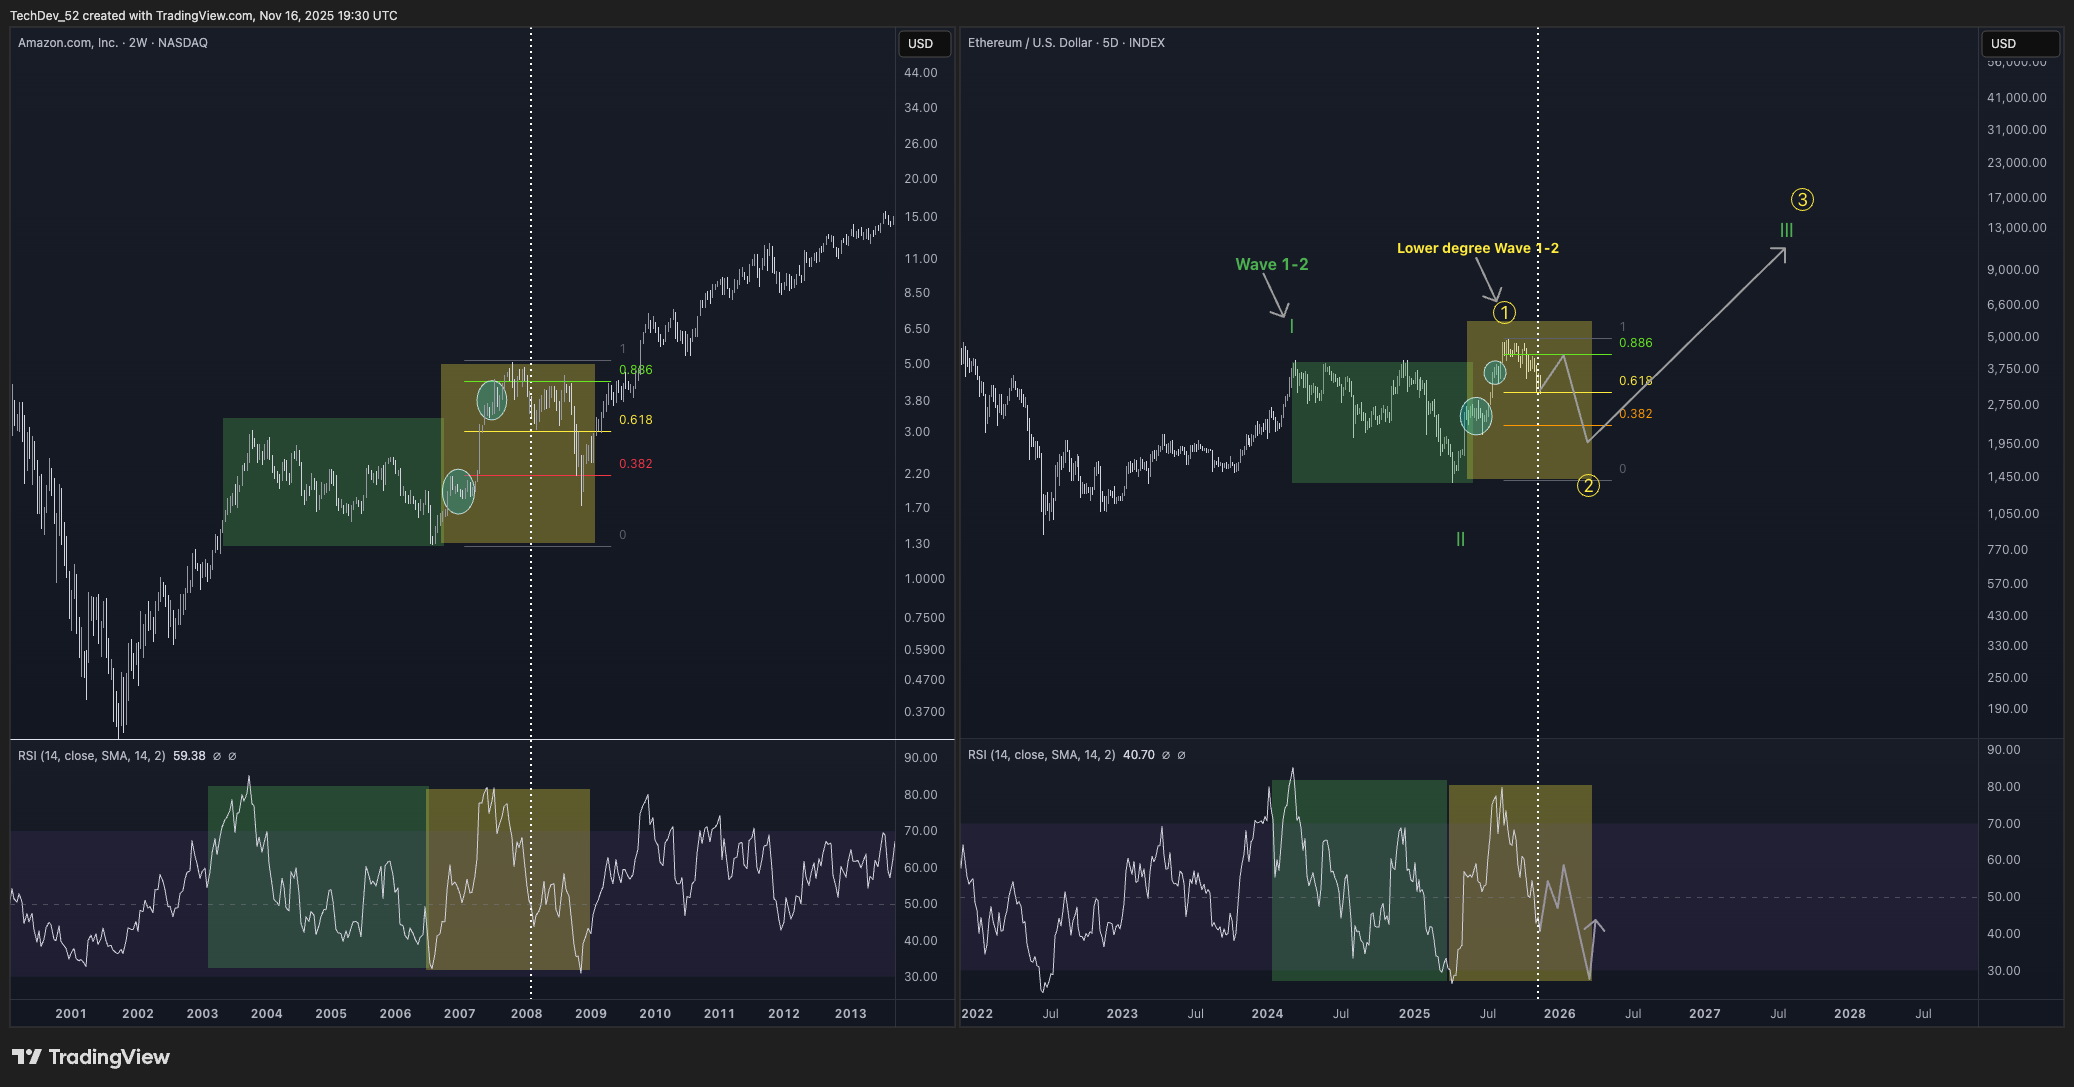
This nested structure means that a wave 3 of wave 3 comes after this short move down. And recall that I read the current macro positioning as already being within a wave 3, which would technically make the upcoming advance a wave 3 of 3 of 3.
Bitcoin’s Extended Timeline
Now let’s examine the Bitcoin implications of this Ethereum analysis. The trunk analog I’ve been tracking shows how I see the sharp drop ahead playing out, followed by the longer-term advance.
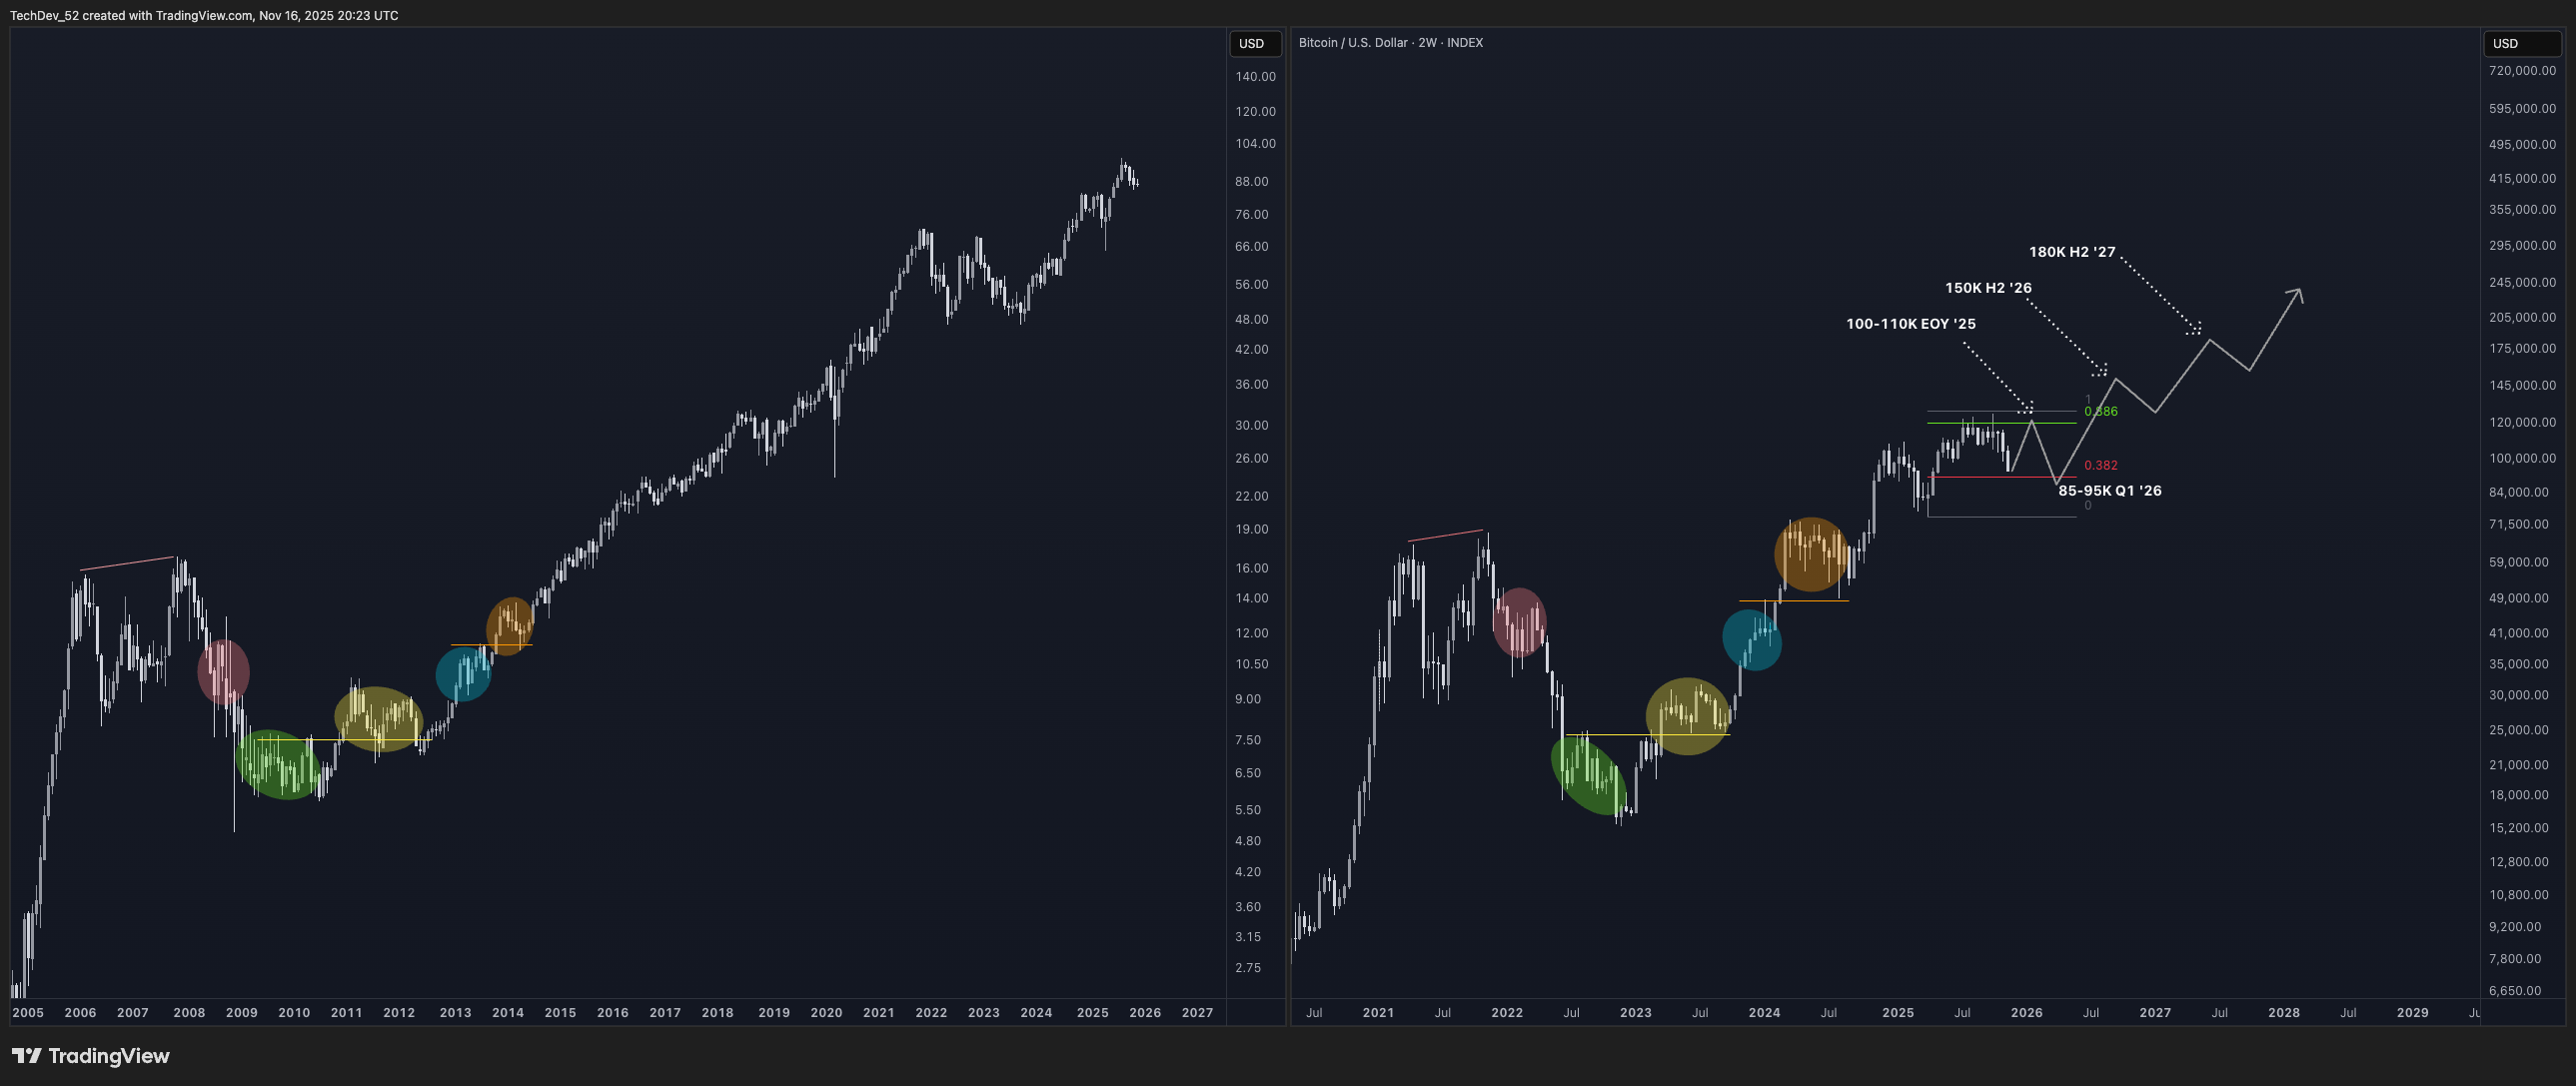
This represents a significant adjustment to my timeline, and I don’t take modifications like this lightly. Here are my updated projections:
$100,000-110,000 by end of 2025 (corrective high)
$85,000-95,000 in Q1 2026 (corrective low)
$150,000 by H2 2026
$180,000 by H2 2027
$300,000 in 2028
Yes, my entire outlook has extended even further into the future. This is what all the data is telling me. The business cycle’s extended bottoming process has stretched the timeline for the entire advance. What I previously thought might occur in 2026 is now pushed to 2027-2028.
The macro-level story hasn’t changed: we have way further up to go. The monthly volatility is just likely to be more turbulent in the near term on this even slower path to get there.
Who should care about this adjustment? It depends on your approach:
Long-term holders and cycle swing traders shouldn’t be particularly concerned. The destination remains the same, just with a more extended journey.
Sub-cycle swing traders absolutely need to pay attention. The near-term volatility represents both risk and opportunity depending on positioning and execution.
The Trunk Remains, Volatility Increases
The trunk structure itself remains intact. What’s changing is my understanding of the volatility profile within that trunk - specifically, that we’re about to experience a sharp corrective wave before the next major leg higher.
Finally, let’s overlay the NASDAQ analog with this updated read to see how they align:
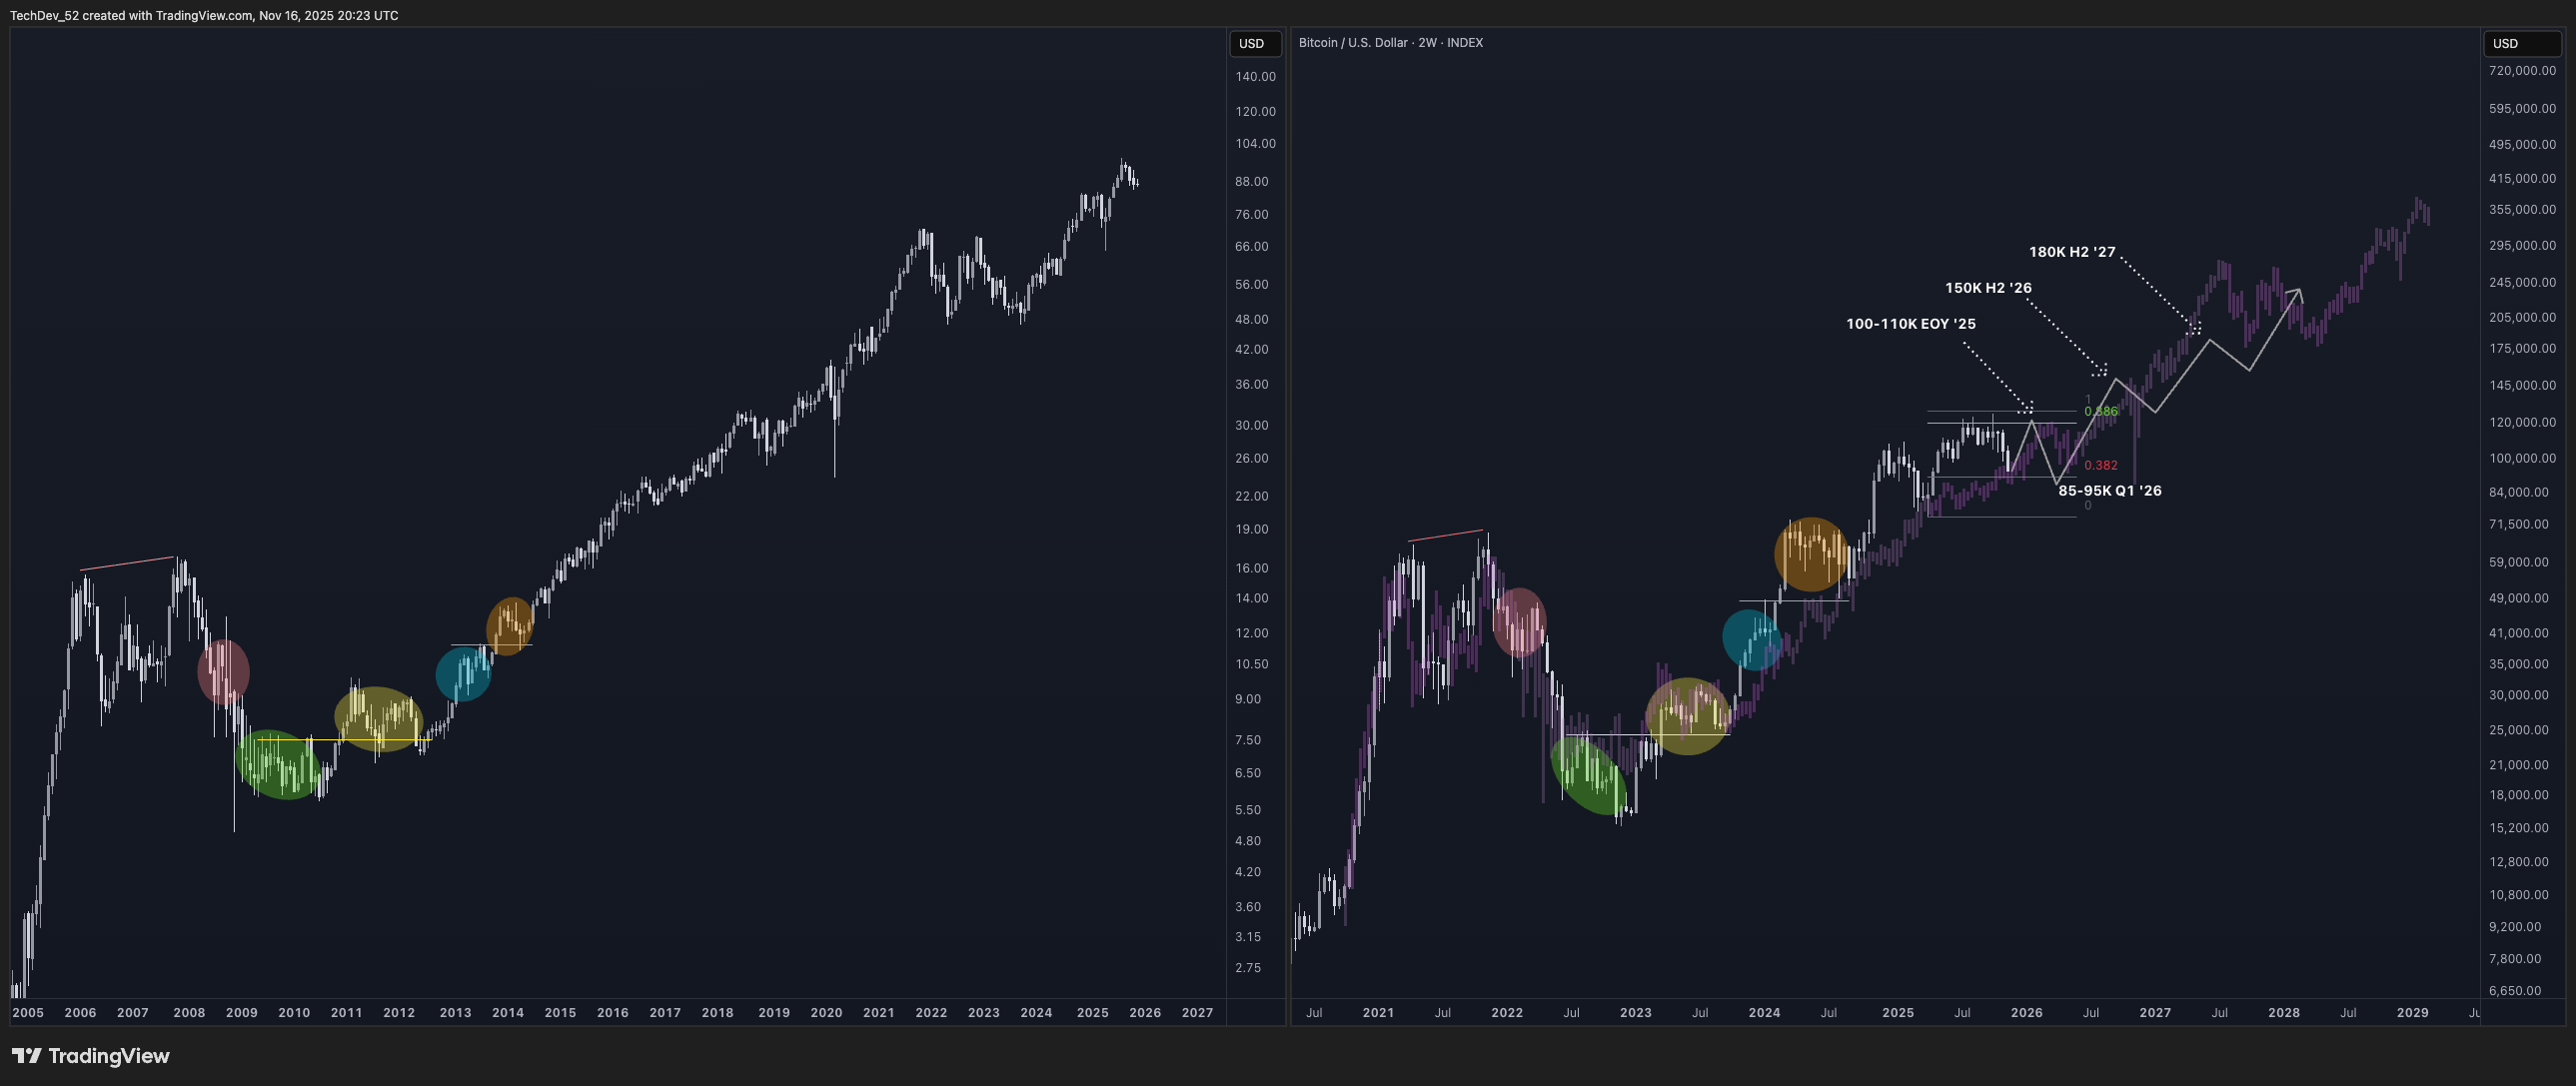
The overlay shows Bitcoin following the trunk trajectory but with considerably more volatility - especially overshoots above the NASDAQ trunk path followed by consistent reversions back to it.
The upcoming corrective move would represent one of these reversions to the trunk after the recent overshoot.
The business cycle foundation hasn’t changed. The trunk structure hasn’t changed. What’s changed is my understanding of the near-term path we’ll take within that larger framework.
Portfolio Analyzer Updates
Now let me turn to the Portfolio Analyzer updates that make this issue particularly actionable. The timing of these improvements couldn’t be better given the volatility ahead.
The Portfolio Analyzer is available at app.techdev52.com for all subscribers. If you haven’t accessed it yet, simply visit the site and follow the setup instructions to begin tracking your holdings and using the available tools.
For existing users, these updates go live today and will be immediately visible when you refresh the application.
New Forecast Model 🔮
The centerpiece of this update is the complete overhaul of the portfolio forecasting system. The previous generation had clear limitations I wasn’t comfortable with as the market enters this trunk-like phase.
Trunk-Based and Adaptive Pattern Recognition: The system now analyzes your portfolio’s historical behavior against the expected trunk structure of the overall market. The algorithm automatically adjusts its approach based on the available data and prior character of the portfolio.
How It Works: The forecast projects your portfolio’s potential path from November 2025 through the end of 2028, providing a general trend to monitor. This forecast offers a general trend. Individual assets will experience volatile deviations above and below the projected path, but each should revert toward the mean trajectory over time. Think of it as a central tendency rather than a precise prediction.
Current Forecast Implications: Given the near-term correction I’m anticipating, you should see the forecast model showing increased downside risk in the Q4 2025/Q1 2026 timeframe, followed by strong recovery and continuation into 2026-2027 and beyond.
Relief Rally Meter ⚡
Alongside the forecast overhaul, I’m introducing a new market timing indicator specifically designed for the current environment.
The Relief Rally Meter specifically tracks the counter-trend bounce I’m expecting into year-end. As that bounce develops and Ethereum climbs toward the $4,000-4,200 zone with RSI around 55, the meter should reach high readings (90+) signaling it’s time to de-risk or at minimum avoid adding exposure.
Reading the Meter:
0-30 (Blue/Green): Low readings suggest continuation potential. The market has room to run higher before exhaustion.
30-70 (Yellow/Orange): Mid-range readings indicate caution. Monitor other signals before making positioning decisions.
70-100 (Red): High readings warn of elevated correction risk. When the meter reaches 90+, probability of a near-term top increases substantially.
After the subsequent correction completes in Q1 2026, I’ll be reintroducing the trunk local top meter for the longer-term advance that follows.
In general I plan to swap out tools as they become contextually useful.
Why Ethereum as the Signal Source:
As I’ve explained in previous issues, Ethereum occupies a crucial position in the crypto market structure. It bridges Bitcoin and the broader altcoin market - less stable than BTC but more stable than most alts, making it an excellent gauge for overall risk appetite.
When ETH momentum reaches extremes, altcoins typically follow within days or weeks. This leading characteristic makes it the ideal input for a timing indicator designed to help manage altcoin-heavy portfolios.
Coming Soon
Two additional indicators remain in development with substantial progress:
Business Cycle Tracker: Will visualize the 2-month MACD histogram of Copper/Gold directly within your portfolio view, providing real-time context for how your holdings are positioned relative to the macro cycle. This will make the “Holy Grail Chart” accessible without leaving the portfolio application.
Local Top Meter: Will return once we’re past the near-term correction, providing the 2-week RSI-based signals for identifying local extremes during the trunk advance. This will essentially be the system I detailed in Issue #81, fully integrated into the portfolio interface.
Closing
Let me be direct about what today’s analysis means for positioning and outlook.
The Macro Foundation Is Intact:
The business cycle signals remain unambiguously bullish. We’re at the bottom, not the top. The 2-month RSI of Copper/Gold and the 2-month MACD both show positioning consistent with imminent macro inflection. Nothing about the fundamental setup has deteriorated.
The Near-Term Path Has Adjusted:
Based on the corrected Ethereum-Amazon analog alignment and the wave structure analysis, I now expect a sharp but brief corrective move before the next major leg higher. This isn’t a trend change - it’s volatility within an ongoing trunk structure.
The Timeline Has Extended:
The business cycle’s unprecedented slow-motion bottoming process has stretched the timeline for the entire advance. Major targets I previously projected for 2026 are now pushed to 2027-2028. The destination hasn’t changed, but the journey is taking longer.
For different market participants, this adjustment has different implications:
Long-term holders: Stay the course. The macro setup remains compelling. Near-term volatility doesn’t change the fundamental trajectory.
Cycle swing traders: The correction into Q1 2026 represents a strategic reaccumulation opportunity before the major advance into 2027-2028.
Sub-cycle swing traders: The Relief Rally Meter provides the tactical signals I hope will be helpful in navigating the near-term volatility.
Stay focused on the data. Ignore the noise. Adapt when the evidence demands it.
Next issue, I’ll revisit these projections in light of how the counter-trend bounce develops and provide updated guidance on positioning for the correction that should follow.


