With a recent uptick in popularity of Eagle Point Credit Company (ECC) and Oxford Lane Capital Corp. (OXLC), there’s an influx of new investors and coverage of these two closed-end funds. Due to the nature of the complex investments held within these funds (primarily the equity tranches of CLOs), there seems to be a lot of misconceptions regarding a few key elements, mainly distribution coverage. In this article we’ll try to breakdown the CLO structures a bit and highlight the easy ways for the average investor to see the key information within these funds’ annual and semi-annual reports.
Before diving into the details, a brief background on my experience includes over 10 years as a CPA working in middle office and back office roles in private equity and later, at a large debt firm that is also a CLO manager.
Cash Flows within a CLO structure
I'm using several excerpts from S&P Global and Ares Management Corp primers on CLOs; these types of educational materials are abundant on the web so if you're curious to learn more I'd definitely recommend doing an internet search of your own and looking through as many of these as you can. An overview of an example CLO structure is shown below, where you can see the underlying loan pool on the left side, the securities the CLO issues to investors on the right, with the CLO Manager (or "Loan Manager") at the top overseeing the structure.
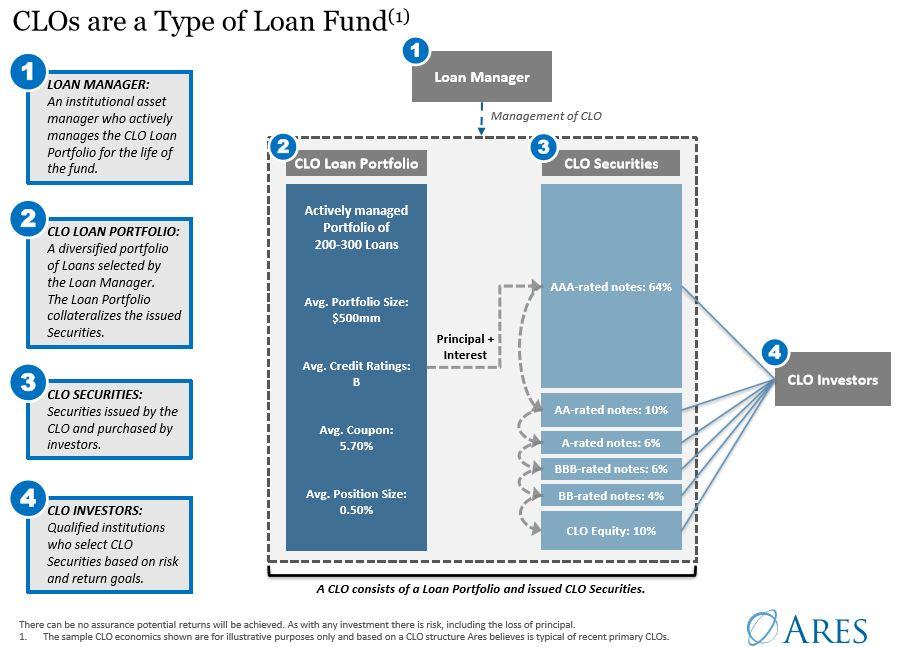 Source: Ares Management Co - CLO Primer
The next image shows a similar picture but adds details about the typical spread the underlying pool of bank loans earns, the layer of expenses that are subtracted from that, and what rates of interest each tranche of the CLO pays with the remaining cash flows. It also shows how much that could equate