Harry Browne had this to say about the permanent portfolio:
"The portfolio's safety is assured by the contrasting qualities of the four investments - which ensure that any event that damages one investment should be good for one or more of the others. And no investment, even at its worst, can devastate the portfolio - no matter what surprises lurk around the corner - because no investment has more than 25% of your capital."
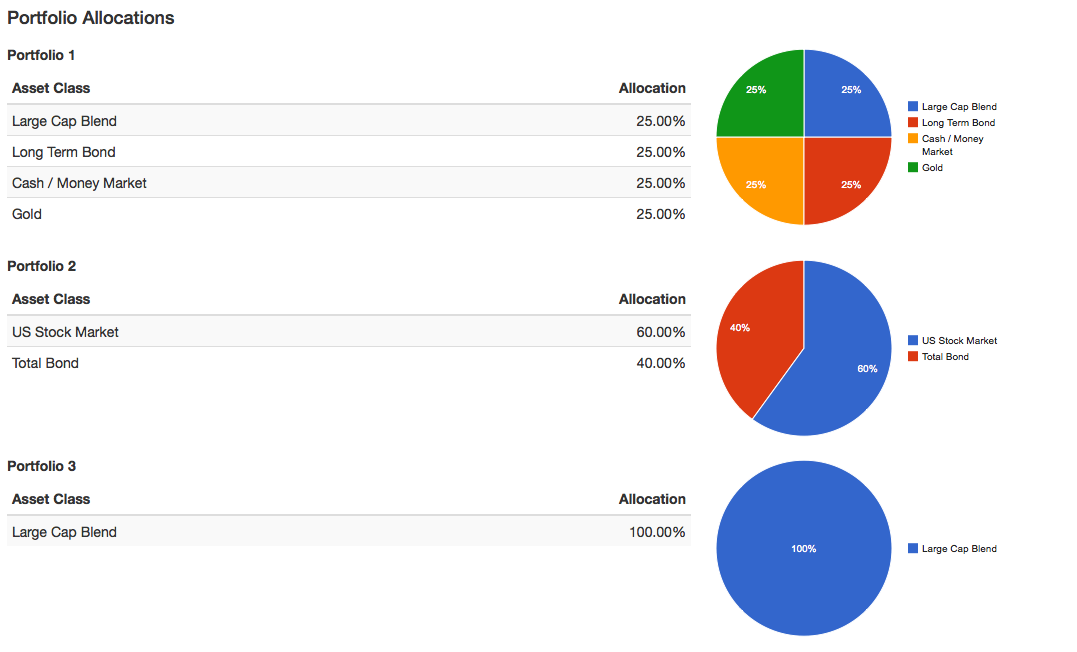
The permanent portfolio consists of
- 25% - Stocks (S&P 500 Stock Index Fund)
- 25% - Long Term Bonds (US Treasury 30 Year Bonds)
- 25% - Gold (Physical Gold Bullion)
- 25% - Cash (Treasury Money Market Fund)
Harry Browne believed no matter what was happening in the economy at least one of the assets in the Permanent portfolio would be doing well:
- Stocks - Prosperity
- Long Bonds - Deflation
- Gold - Inflation
- Cash - Recession
In theory having at least one asset always doing well would prevent the portfolio from incurring large losses. Below we show how the portfolio has performed from 1972-2014 compared to a 60% US Stocks/ 40% long-term bond portfolio and the S&P 500.
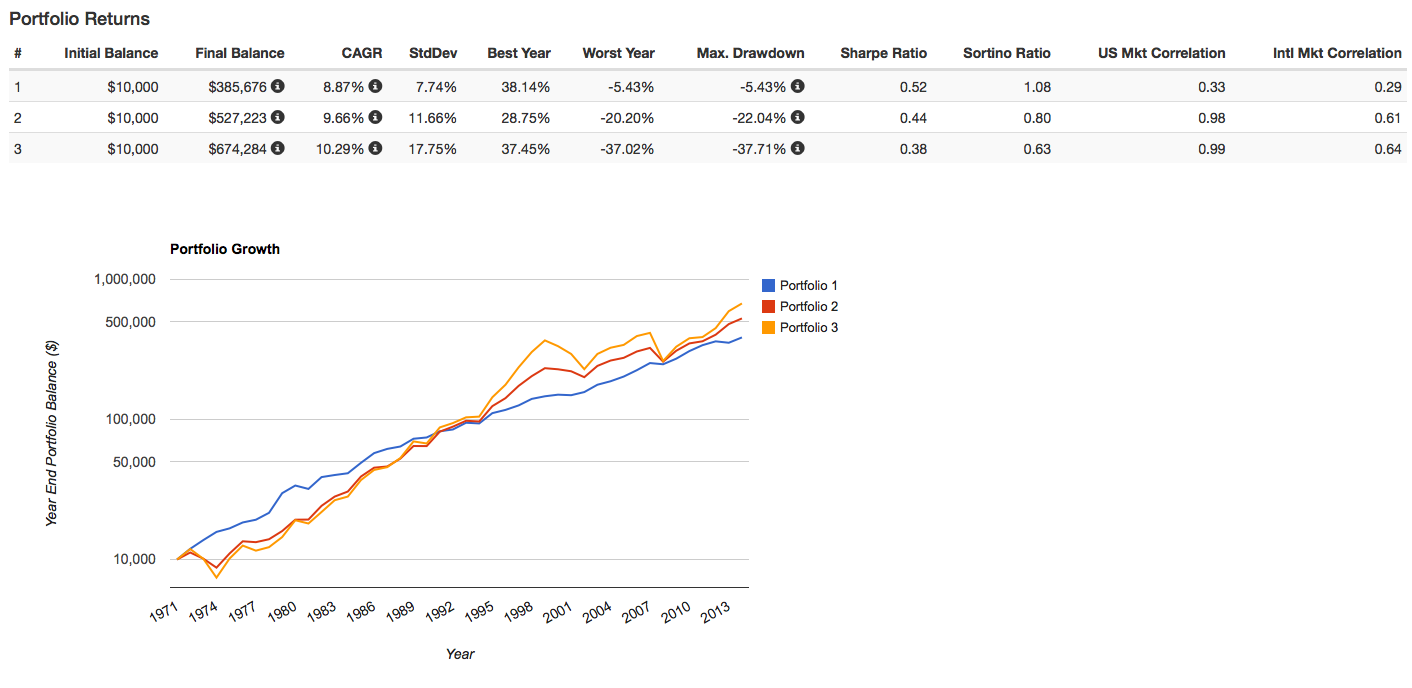
All the charts and data in this article are from portfoliovisualizer.com
If you look at the third column above, it shows the compound annual growth rate. Comparing it to the returns of the other portfolios, you may think the permanent portfolio does not have a very good return history. However, CAGR is only part of the story.
Look at how smooth the blue line in the graph is. The Permanent Portfolio has better risk adjusted returns based on both the Sharpe Ratio and the Sortino Ratio. Look at the column that shows the worst year for the portfolios; the worst year for the Permanent Portfolio was -5.43% compared to -20.24 (60/40) and -37.02 (S&P 500).