Anthology of sociology, statistical, or psychological papers discussing the observation that all real-world variables have non-zero correlations and the implications for statistical theory such as ‘null hypothesis testing’.
Statistical folklore asserts that “everything is correlated”: in any real-world dataset, most or all measured variables will have non-zero correlations, even between variables which appear to be completely independent of each other, and that these correlations are not merely sampling error flukes but will appear in large-scale datasets to arbitrarily designated levels of statistical-significance or posterior probability.
This raises serious questions for null-hypothesis statistical-significance testing, as it implies the null hypothesis of 0 will always be rejected with sufficient data, meaning that a failure to reject only implies insufficient data, and provides no actual test or confirmation of a theory. Even a directional prediction is minimally confirmatory since there is a 50% chance of picking the right direction at random.
It also has implications for conceptualizations of theories & causal models, interpretations of structural models, and other statistical principles such as the “sparsity principle”.
A log of experiments done on the site design, intended to render pages more readable, focusing on the challenge of testing a static site, page width, fonts, plugins, and effects of advertising.
To gain some statistical & web development experience and to improve my readers’ experiences, I have been running a series of CSS A/B tests since June 201213ya. As expected, most do not show any meaningful difference.
9 months of daily A/B-testing of Google AdSense banner ads on Gwern.net indicates banner ads decrease total traffic substantially, possibly due to spillover effects in reader engagement and resharing.
One source of complexity & JavaScript use on Gwern.net is the use of Google AdSense advertising to insert banner ads. In considering design & usability improvements, removing the banner ads comes up every time as a possibility, as readers do not like ads, but such removal comes at a revenue loss and it’s unclear whether the benefit outweighs the cost, suggesting I run an A/B experiment. However, ads might be expected to have broader effects on traffic than individual page reading times/bounce rates, affecting total site traffic instead through long-term effects on or spillover mechanisms between readers (eg. social media behavior), rendering the usual A/B testing method of per-page-load/session randomization incorrect; instead it would be better to analyze total traffic as a time-series experiment.
Design: A decision analysis of revenue vs readers yields an maximum acceptable total traffic loss of ~3%. Power analysis of historical Gwern.net traffic data demonstrates that the high autocorrelation yields low statistical power with standard tests & regressions but acceptable power with ARIMA models. I design a long-term Bayesian ARIMA(4,0,1) time-series model in which an A/B-test running January–October 2017 in randomized paired 2-day blocks of ads/no-ads uses client-local JS to determine whether to load & display ads, with total traffic data collected in Google Analytics & ad exposure data in Google AdSense. The A/B test ran from 2017-01-01 to 2017-10-15, affecting 288 days with collectively 380,140 pageviews in 251,164 sessions.
Correcting for a flaw in the randomization, the final results yield a surprisingly large estimate of an expected traffic loss of −9.7% (driven by the subset of users without adblock), with an implied −14% traffic loss if all traffic were exposed to ads (95% credible interval: −13–16%), exceeding my decision threshold for disabling ads & strongly ruling out the possibility of acceptably small losses which might justify further experimentation.
Thus, banner ads on Gwern.net appear to be harmful and AdSense has been removed. If these results generalize to other blogs and personal websites, an important implication is that many websites may be harmed by their use of banner ad advertising without realizing it.
Bayesian decision-theoretic analysis of the effect of fancier packaging on subscription cancellations & optimal experiment design.
I analyze an A/B test from a mail-order company of two different kinds of box packaging from a Bayesian decision-theory perspective, balancing posterior probability of improvements & greater profit against the cost of packaging & risk of worse results, finding that as the company’s analysis suggested, the new box is unlikely to be sufficiently better than the old. Calculating expected values of information shows that it is not worth experimenting on further, and that such fixed-sample trials are unlikely to ever be cost-effective for packaging improvements. However, adaptive experiments may be worthwhile.
Online content creators spend time and effort building their user base through a long, often arduous process, which requires finding the right niche to cater to. So, what incentive is there for an established content creator known for cat memes to completely reinvent their page channel and start promoting cryptocurrency services or cover electoral news events? And, if they do, do their existing subscribers not notice?
We explore this problem of repurposed channels, whereby a channel changes its identity and contents.
We first characterize a market for “second-hand” social media accounts, which recorded sales exceeding USD ~1M during our 6-month observation period. By observing YouTube channels (re)sold over these 6 months, we find that a substantial number (37%) are used to disseminate potentially harmful content, often without facing any penalty.
Even more surprisingly, these channels seem to gain rather than lose subscribers. To estimate the prevalence of channel repurposing “in the wild”, we also collect two snapshots of 1.4M quasi-randomly sampled YouTube accounts. In a 3-month period, we estimate that ~0.25% of channels—collectively holding ~44M subscribers—were repurposed.
We confirm that these repurposed channels share several characteristics with sold channels—mainly, the fact that they had a high presence of potentially problematic content. Across repurposed channels, we find channels that became disinformation channels, as well as channels that link to web pages with financial scams. We reason that abusing the residual trust placed on these channels is advantageous to financially- and ideologically-motivated adversaries.
This phenomenon is not exclusive to YouTube and we posit that the market for cultivating organic audiences is set to grow, particularly if it remains unchallenged by mitigations, technical or otherwise.
Google’s obfuscating VM-based anti-bot system (BotGuard) was very effective. Source: I wrote it. We used it to completely wipe out numerous botnets that were abusing Google’s products eg. posting spam, clickfraud, phishing campaigns. BotGuard is still deployed on basically every Google product and they later did similar systems for Google Android and iOS, so I guess it continues to work well.
AFAIK Google was the first to use VM-based obfuscation in JavaScript. Nobody was using this technique at the time for anti-spam so I was inspired primarily by the work Nate Lawson did on Blu-ray.
What most people didn’t realize back then is that if you can force your adversary to run a fullblown web browser there are numerous tricks to detect that the browser is being automated. When BotGuard was new most of those tricks were specific to Internet Explorer, none were already known (I had to discover them myself) and I never found any evidence that any of them were rediscovered outside of Google. The original bag of tricks is obsolete now of course, nobody is using Internet Explorer anymore. I don’t know what it does these days.
The VM isn’t merely about protecting the tricks, though. That’s useful but not the main reason for it. The main reason is to make it easier to generate random encrypted programs for the VM, and thus harder to write a static analysis. If you can’t write a static analysis for the program supplied by your adversary you’re forced to actually execute it and therefore can’t write a “safe” bot. If the program changes in ways that are designed to detect your bot, done well there’s no good way to detect this and bring the botnet to a safe halt because you don’t know what the program is actually doing at the semantic level. Therefore the generated programs can detect your bot and then report back to the server what it found, triggering delayed IP/account/phone number bans.
It’s very expensive for abusers to go through these bans but because they have to blindly execute the generated programs they can’t easily reduce the risk.
Once the profit margin shrinks below the margin from abusing a different website, they leave and you win.
The explosive growth of Virtual YouTubers (VTubers)—streamers who perform behind virtual anime avatars—has created a unique digital economy with profound implications for content creators, platforms, and viewers. Understanding the economic landscape of VTubers is crucial for designing equitable platforms, supporting content creator livelihoods, and fostering sustainable digital communities.
To this end, we conducted a large-scale study of over 1 million hours of publicly available streaming records from 1,923 VTubers on YouTube, covering tens of millions of dollars in actual profits.
Our analysis reveals stark economic inequality within the VTuber community and characterizes the sources of income for VTubers from multiple perspectives.
This research illuminates the financial dynamics of VTuber communities, informing the design of equitable platforms and sustainable support systems for digital content creators.
[I thought that the Hololive business model might be long-term broken or fundamentally predatory, regardless of their substantial profits, based on the prior history of Vocaloid where successful creators tend to leave for their own projects at some point, and the prominent retirements of top VTubers like Kiryu Coco (2021-07-01) or Gawr Gura (2025-05-01), implying rapid turnover due to burnout and under-compensation. When they quit, their intellectual property becomes worthless overnight [see Kizuna Ai], as Hololive owns everything, so the human actors either quit the business entirely or must start over with a small fraction of their fanbase (eg. the new Kiryu Coco ‘kson’ on Twitch has perhaps a tenth what the old one would on YouTube by now). This seemed like an enormous waste, and like there was potential for some other business model like a partnership of some sort (eg. a law firm’s up-or-out and profit-sharing) or for an approach where a VTuber ‘earns out’ the IP in their character gradually. This also would encourage more investment in the VTubing technology: apparently the Live2D tech they use for streaming is probably quite cheap (certainly well under $100,000) and not as sophisticated as that of many independent streamers and VShojo demonstrates that a streamer talent agency doesn’t have to own the IP. The hold-up problem didn’t strike me as too big a deal because VTuber tech is (or at least, ought to be) cheap, unlike the many years of very expensive dance/singing lessons & other expenses that can make a regular K-pop/J-pop idol so expensive in expectation.
However, on checking, the burnout problem may not be real: the Coco/Gura retirements are so prominent because there are so few Hololive retirements, not many. (I hear about Gura quitting, but I don’t hear about the popular Hoshimachi Suisei still streaming away 6 years later. Gura for example, was part of a group of 5 in September 2020, of whom 3 others are still actively streaming (Ninomae Ina’nis, Kiara Takanashi, Mori Calliope) and only 1 other, Amelia Watson, has quasi-retired as of April 2025; the full list of all Hololive retirees is Gawr Gura / Kiryu Coco, Minato Aqua, Murasaki Shion, Tsukumo Sana, Ceres Fauna.) As best as can be told (given that they only really launched in 2019), they actually seem to have excellent retention/career longevity! If the business model was so predatory or underpaid, this would be unexpected. (Even rival Nijisanji, which seems to take a much more aggressive spray-and-pray approach emphasizing variety, doesn’t have that awful statistics at a glance, and retention seems superior to regular Twitch streamers.) Further, the statistics in this paper indicate that Hololivers make far more than even the top independents, due to extreme power law network media effects (only a few viewers donate, they only donate on special occasions, and any subscriptions attrit away fast), without taking into account the extensive merchandising/licensing/concerts/corporate-partnerships that independents have no access to, and suggest that the streaming market is a natural duopoly. (Concerts in particular, with Vocaloid-style motion capture 3D holographic or projected avatars, would be expensive but a moat, especially as they can bring on-stage scores of different streamers—coordination costs like tragedy of the anticommons would make it hard for a large group of independents to do anything similar to Hololive’s ‘Fes’, which gets bigger every year.)
So the way the streaming market seems to work is that what Hololive does is they ‘control demand’: by creating a ‘Hololive cinematic universe’ or ‘media mix’ strategy, they are able to create new streaming stars overnight by driving <100,000 viewers to newly-launched ones—independent of any YouTube algorithmic recommendations or manipulation—and control the limited number of ‘top’ streamer slots, while shuffling viewers back and forth inside a self-contained Hololive ‘universe’ where if they don’t like one streamer, well, maybe they’ll like another one. This locks out all the independent streamers who must standalone and cannot drive each other traffic or use revenue from additional sources to add complements to streaming like real-world concerts. This is why Hololive can take a large percentage of revenue, but their streamers still be paid a lot more absolutely, and can stably lock out any competitors (whether agency or individual streamer), who must start from scratch and have no good way to monetize what few viewers they get.
Given this, the situation seems stable as long as the talent agency doesn’t mismanage things and the platforms themselves do not try to hijack the VTuber ecosystem themselves. For the same reason, Hololive is likely robust to AI: that will simply eat the bottom of the market, while they retain the very narrow high-end with a long-standing franchise and human selling point. (Indies and Nijisanji have much more to fear.)]
The rise of AI-generated content in popular information sources raises concerns about accountability, accuracy, and bias amplification. Beyond directly impacting consumers, the widespread presence of this content poses questions for the long-term viability of training language models on vast internet sweeps.
We use GPTZero, a proprietary AI detector, and Binoculars, an open-source alternative, to establish lower bounds on the presence of AI-generated content in recently created Wikipedia pages.
Both detectors reveal a marked increase in AI-generated content in recent pages compared to those from before the release of GPT-3.5.
With thresholds calibrated to achieve a 1% false positive rate on pre-GPT-3.5 articles, detectors flag over 5% of newly created English Wikipedia articles as AI-generated, with lower percentages for German, French, and Italian articles.
Flagged Wikipedia articles are typically of lower quality and are often self-promotional or partial towards a specific viewpoint on controversial topics.
I highlight key challenges for studying the regulation including the difficulty of finding a suitable control group, variable firm compliance and regulatory enforcement, as well as the regulation’s impact on data observability.
The economic literature on the GDPR to date has largely—though not universally—documented harms to firms. These include harms to firm performance, competition, innovation, the web, and marketing. On the elusive consumer welfare side, the literature documents some objective privacy improvements as well as helpful survey evidence.
The literature shows how the GDPR works in practice and illuminates the consequences of its design decisions.
Finally, I suggest opportunities for future research on the GDPR as well as privacy regulation and privacy-related innovation more broadly.
…The economics literature also illuminates the consequences of the GDPR’s design decisions. The literature documents important spillovers of the GDPR outside of the EU. In particular, research shows that foreign firms that serve EU consumers sometimes exhibit greater compliance than EU firms. This may reflect the GDPR’s penalty design: foreign firms that fall under the GDPR’s extraterritoriality component may be especially leery of GDPR fines that are based on global revenue rather than EU revenue alone. Research also shows indirect spillovers like global firms implementing their compliance efforts worldwide, so that non-EU consumers benefit. Though the GDPR intended to harmonize regulation within the EU, several scholars document differences in regulatory impact by the perceived strictness of EU country-level regulators…Finally, §4.3.3 notes the GDPR’s confounding impact on data observability. By construction, the GDPR creates a missing-data problem whereby observed individual-level data are selected and the corresponding aggregate statistics are incomplete.
[blog] Social media influencers account for a growing share of marketing worldwide. We demonstrate the existence of a novel form of market failure in this advertising market: influencer cartels, where groups of influencers collude to increase their advertising revenue by inflating their engagement.
Our theoretical model shows that influencer cartels can improve consumer welfare if they expand social media engagement to the target audience, or reduce welfare if they divert engagement to less relevant audiences.
We validate the model empirically using novel data on influencer cartels [on Instagram, coordinated via Telegram] combined with machine learning tools, and derive policy implications for how to maximize consumer welfare.
…Our back-of-the-envelope calculations show that if an advertiser pays for cartel engagement as if it is natural engagement, they only get 3–18% of the value in the case of general cartels and 60–85% in the case of topic cartels.
…The [OA] Preferred Publisher Program has 5 primary components, according to the deck.
First, it is available only to “select, high-quality editorial partners”, and its purpose is to help ChatGPT users more easily discover and engage with publishers’ brands and content.
Additionally, members of the program receive priority placement and “richer brand expression” in chat conversations, and their content benefits from more prominent link treatments. Finally, through PPP, OpenAI also offers licensed financial terms to publishers.
The financial incentives participating publishers can expect to receive are grouped into two buckets: guaranteed value and variable value.
Guaranteed value is a licensing payment that compensates the publisher for allowing OpenAI to access its backlog of data, while variable value is contingent on display success, a metric based on the number of users engaging with linked or displayed content.
The resulting financial offer would combine the guaranteed and variable values into one payment, which would be structured on an annual basis.
“The PPP program is more about scraping than training”, said one executive. “OpenAI has presumably already ingested and trained on these publishers’ archival data, but it needs access to contemporary content to answer contemporary queries.”
In return for these payments, OpenAI would gain two benefits.
It would have the ability to train on a publisher’s content and the license to display that information in ChatGPT products, complete with attribution and links. It would also get to announce the publisher as a preferred partner and work with them to build out these experiences.
…PPP members will see their content receive its “richer brand expression” through a series of content display products: the branded hover link, the anchored link and the in-line treatment.
In the hover treatment, which is available today, OpenAI will hyperlink keywords in its responses to search queries. The links appear as blue text and reveal a clickable tab when moused over.
In the anchor treatment, branded, clickable buttons appear below ChatGPT’s response to a user query. And the in-line product inserts a pull-quote into the text of ChatGPT’s response, whose font is larger and includes a clickable, branded link.
All 3 content display products seek to cite the publishers whose writing is being used to answer the search query, although the setup will likely lead fewer users to visit publishers’ websites.
A recent model from The Atlantic found that if a search engine like Google were to integrate AI into search, it would answer a user’s query 75% of the time without requiring a clickthrough to its website.
Contemporary election reforms that are purported to increase or decrease turnout tend to have negligible effects on election outcomes.
We offer an analytical framework to explain why. Contrary to heated political rhetoric, election policies have small effects on outcomes because they tend to target small shares of the electorate, have a small effect on turnout, and/or affect voters who are relatively balanced in their partisanship.
After developing this framework, we address how the findings bear on minority voting rights. We then show that counter-mobilization from political parties cannot explain the small effects of election laws.
We explain that even when a state passes multiple policies at the same time, the reforms will still only have a marginal effect on turnout and an ambiguous effect on who wins.
Finally, we explain what policies should raise alarm about affecting outcomes.
…Our answer is that modern election reforms target narrow shares of the population, have a small effect on turnout, and/or are imprecisely targeted at members of political parties. To see how this combination of facts results in small effects, consider an initial, hypothetical example with features that will be similar to actual examples used throughout the paper. Suppose a state recently held a close election in which 51% of voters supported the Democratic candidate and 49% of voters supported the Republican candidate. In response to the election, the Republican-controlled state legislature passes a bill that imposes additional requirements to vote and these requirements disproportionately target Democratic voters. Specifically, the additional requirements target 4% of the electorate and as a result of these requirements, there will be a 3 percentage point decline in turnout in this group. The targeted group is strongly Democratic: 60% of the targeted group supports the Democratic presidential candidate.
What would happen if the 51:49 election were held again and everything about the election was the same except for this law? The policy would cause a 0.12 percentage point decline in the overall turnout. And it would cause a 0.011 percentage point decline in the two-party vote share for the Democratic candidate. In other words, the Republican party would lose the election with nearly identical results: in the new election 50.989% of voters would support the Democratic candidate while 49.011% would support the Republican candidate. If the state had one million eligible voters, the policy would deter 720 Democratic voters and 480 Republican voters, netting the Republicans a 240-vote shift.
…The effects of election laws on turnout are so small that scholars analogize the effect sizes to the modest impact of campaign advertisements on participation. Studying the turnout effects of majority-minority districts—a powerful reform stemming from the Voting Rights Act—Fraga2015 writes, “The effects I find are roughly equivalent to receiving an impersonal contact encouraging a registrant to vote.” The effects of all-mail voting, Barber & Holbein2020 suggest, are “somewhere between one nonpartisan get-out-the-vote solicitation over the phone and one social-pressure mailer”.
‘Low-clutter’ radio stations have shorter advertisement breaks to attract listeners, increase advertisement effectiveness, and potentially reduce mechanical advertisement avoidance (ie. switching stations).
This research introduces a two-factor theory explaining why mechanical advertisement avoidance has an inverse U-shaped relationship with advertisement position in the break and advertisement break length in advertisement units.
The theory was supported by portable people meter (PPM) ratings data. Peak mechanical avoidance occurred at the 4th advertisement position, similar to the average advertisement break length perceived by radio listeners from the same city as the PPM data.
This explains why the two-advertisement breaks that are typical for low-clutter radio stations minimize mechanical avoidance.
…Sample: The average monthly PPM panel size for ages 12 and older in the Greater Vancouver area was ~800 individuals. Using census statistics, the authors compared the panel’s demographics with the general population’s demographics, and there were no statistically-significant differences in age or gender.
PPM Data Collection: A PPM device listens for digital watermarks in radio signals and tracks switching between stations, or when the signal disappears, logged as turning off the device. Leaving the room or muting the sound is indistinguishable from turning off, and the authors categorized both behaviors as turning off and, along with changing the station, counted them as forms of “mechanical avoidance.” The official Canadian radio audience measurement data collected using PPM technology by Numeris were made available.
…High-rating stations had a higher proportion of shorter breaks (55% had ≤3 advertisement units), compared with lower rating stations (48% had ≤3 advertisement units) (See Figure 1). These high-rating stations were predominantly “low-clutter” stations, although all stations had advertisement breaks of ≥11 advertisement units.
This paper explores the incentives of a monopolistic media platform to invest in demand-driving innovation when the interactions between its customer groups (eyeballs and advertisers) are countervailing. We investigate whether media innovation contributes to resolving the trade-off between catering to both groups (or sides) and minimizing advertising nuisance.
We identify an innovation threshold guiding the media platform on when to charge more eyeballs than advertisers, effectively reversing the standard divide-and-conquer pricing strategy. Moreover, we show that the media platform invests more in R&D on the side with the strongest reference market, and we highlight the role of excessive inertia and momentum in shaping innovation.
Furthermore, we find that when the relative advertising nuisance is low, the platform is less encouraged to innovate on both sides when the ad nuisance increases marginally. However, when the relative advertising nuisance is high, we infer an R&D see-saw rule: a marginal increase in the ad nuisance reduces the R&D efforts undertaken on one side and increases those on the other.
Our findings provide insights into the complex interplay between media platform innovation and pricing strategy in the presence of advertising nuisance and a challenging chicken-and-egg problem.
Artificial Intelligence has outperformed human experts in functional tasks such as chess and baduk. How about creative tasks? This paper evaluates AI’s capability in the creative domain compared to human experts, which little research has been conducted so far.
We propose a novel Prompt-for-Prompt to generate social media creatives via prompt augmentation by Large Language Models. We take the most popular Instagram posts (with the biggest number of like clicks) in top brands’ Instagram accounts to create social media creatives. We give GPT-4 several prompt instructions with text descriptions to generate the most effective prompts for cutting-edge text-to-image generators: Midjourney, DALL·E 3, and Stable Diffusion. LLM-augmented prompts can boost AI’s abilities by adding objectives, engagement strategy, lighting, and brand consistency for social media image creation.
We conduct an extensive human evaluation experiment, and find that:
AI excels human experts, and Midjourney is better than the other text-to-image generators. Surprisingly, unlike conventional wisdom in the social media industry, prompt instruction including eye-catching shows much poorer performance than those including natural. Regarding the type of creatives, AI improves creatives with animals or products but less with real people. Also, AI improves creatives with short text descriptions more than with long text descriptions, because there is more room for AI to augment prompts with shorter descriptions.
…On Monday, Amazon Prime Video became the latest streamer to embrace the ad tax, tacking $3 onto the monthly bill of anyone who wants to stay ad-free. It’s not just annoying; it’s starting to get expensive.
To watch The Last of Us, you need Max. That’s $20 a month, for the “ultimate ad-free” experience. Stranger Things requires Netflix. Add on another $15.50—and even more if you want to visit the Upside Down on more than two devices at once. Equally enamored with Only Murders in the Building and The Mandalorian? You can bundle Hulu and Disney+ ad-free for another $20. Starting today, if you want to binge The Lord of the Rings: Rings of Power, you’ll have to spend at least $12 to watch Amazon Prime Video without ads.
Want ad-free Peacock? It’s about double the price of normal Peacock, at $12 per month. Paramount+ doesn’t have a version totally free of commercials, but Paramount+ with Showtime, $12, gets you pretty close. Throw in, say Apple TV+, which is still blessedly ad-free at $10, and the cost of your cord-cutting comes out to about $100 per month—about $40 more than you’d pay if you were willing to sit through commercials on every service. It’s over $450 extra each year.
[The implied revenue of advertising is impressive; the implied viewer demand for paying $1 of advertising vs $1 of subscription fees is also remarkable, and presumably backed by large-scale proprietary A/B tests.]
Advertisement blindness (ad blindness) is a general term that refers to people’s tendency to automatically and unconsciously ignore advertisements. The phenomenon was originally identified in banner ads, then later in text and native ads on websites. Today, social media is an effective tool for advertisers, yet research investigating users’ interaction habits with social media ads in mobile applications (apps) is unexplored.
This study expands the ad blindness concept to mobile social media apps, examining its presence and whether target position has an influence. Further, it investigates the relationship between social media use and ad blindness. Employing a novel approach, the study uses a dynamic mock news feed to measure ad blindness in social media posts.
65 young adults performed semantic searches within a stream of ad and content posts, with varied target positions on their phones. Target location accuracy was the major dependent variable, and participants had higher accuracy in content posts than in ad posts, providing evidence for ad blindness. Ad avoidance was especially prevalent in the last third of the news feed.
We also explored the relationship between ad blindness and social media use, however, there was no statistically-significant correlation between the two. Overall, these results revealed the first evidence of ad blindness on social media mobile applications. Also, the findings suggest that ads are more effective at the beginning of the feed, which has real-world applications for parties of interest.
On many multi-sided app platforms, the supply-side monetizes their work with targeted advertising. The targeting of ads has raised concerns over user privacy and has led to calls for platform firms and regulators to bar this practice. Important for this debate is to understand the consequences that a ban on targeted advertising would have for app development.
To inform, we exploit that Google, in2019, banned targeted advertising in Android children’s games [on Google Play]. This setting represents an ideal real-world laboratory and permits a quasi-experimental research design [difference-in-differences]. Our overall finding is that the ban on targeted advertising caused substantial app abandonment.
The ban reduced the release of feature updates, particularly for games of young, undiversified, and advertisement-dependent firms. Only games of exceptionally high quality and demand showed an increase in development. Corroborating this picture, affected games were more likely to be delisted. Developers shifted their efforts toward their unaffected games and released fewer new games on average.
Further tests substantiate that targeted advertising represented a crucial form of monetization for affected games and that the ban obliterated ad revenues used for app development. Our findings have several implications. To avoid a loss in app innovation, platform firms should consider implementing measures to reduce the burden on developers, especially by creating alternative monetization opportunities.
Consumers and policymakers should be aware that targeted advertising plays a crucial role for app development and can use our estimates for designing policies. Thus, consumers’ demand for privacy can conflict with platform firms’ goal to foster app innovation.
…Finally, we leverage our data to investigate further app development decisions of developers. In terms of portfolio effects, affected developers relocated their development efforts. Although developers are releasing fewer feature updates for their affected games, they are releasing more feature updates for their unaffected games. This suggests that developers are shifting their efforts from the markets deprived of ad targeting to those where targeting remained permitted. Moreover, we observe that the ban increased the likelihood of a game being delisted from the Google Play Store by 10.9%. We estimate that 3,270 children’s games were delisted following the ban until the end of the observation period. In addition, we observe that the ban curbed developers’ release of new games (−36.3%). We estimate an annual loss of 65,712 games that would have been contributed to the Google Play Store if the ban would not have been implemented.
…5.2. Data Collection and Sample: We obtained a proprietary data set from the app analytics provider AppMonsta that contains weekly snapshots (“index”) of all apps in the Google Play Store along with their characteristics (eg. prices, ratings). The starting point for the construction of the sample is the index from May 27, 2019 (ie. two days before the announcement). Of the total 2,981,709 apps, 413,899 are games. Following our identification strategy, we exclude all games with content ratings other than “Everyone 10+” and “Teen 13+”, dropping 353,897 games. The Google Play Store has been criticized for containing games that are not downloaded at all, have been abandoned, are maintained by nonprofessionals (eg. hobbyists or amateurs), or are copycats. These games can create noise for estimation. To overcome, we drop games that fulfill at least one of the following criteria: no update in the 1.5 years preceding the observation period; fewer than 25 (50) ratings for games older than 6 (12) months. The remaining games total 27,929.
Data on the use of advertisement in games comes from APKMonk. From there, we obtain each game’s so-called “manifest”—metadata about the advertising networks and data permissions used by a game. This restricts the sample to 25,130 games that use advertisements or collect personal data. To ensure that these games are not already compliant, we drop 85 games that were advertised in the Google Play Store as being compliant with the Family Policy Requirements before the announcement. Importantly, to avoid capturing anticipation and selection effects, we drop games whose content rating was switched during the 6 months before the announcement. In a final step, we dismiss 5,509 non-English games and remove 64 with missing values. Online Appendix A3 provides details on the data sources and data set construction.
…In addition, to triangulate our findings, we conducted semi-structured interviews with individuals involved on the developer side (two CEOs of game developers firms, one monetization manager), the platform side (one regional business development manager), and the advertisement network side (one mobile advertising specialist). The interviews further corroborated the mechanism. Online Appendix A5 describes the interviewees and provides the insights of the interviewees.
[cf. Jakesch et al 2023] The emergence of transformer models that leverage deep learning and web-scale corpora has made it possible for artificial intelligence (AI) to tackle many higher-order cognitive tasks, with critical implications for industry, government, and labor markets in the US and globally. Here, we investigate whether the currently most powerful, openly-available AI model— GPT-3—is capable of influencing the beliefs of humans, a social behavior recently seen as a unique purview of other humans.
Across 3 preregistered experiments featuring diverse samples of Americans (total n = 4,836), we find:
consistent evidence that messages generated by AI are persuasive across a number of policy issues, including an assault weapon ban, a carbon tax, and a paid parental-leave program. Further, AI-generated messages were as persuasive as messages crafted by lay humans. Compared to the human authors, participants rated the author of AI messages as being more factual and logical, but less angry, unique, and less likely to use story-telling.
Our results show the current generation of large language models can persuade humans, even on polarized policy issues. This work raises important implications for regulating AI applications in political contexts, to counter its potential use in misinformation campaigns and other deceptive political activities.
…Here, we test whether AI-generated political messages can persuade humans across 3 pre-registered survey experiments (total n = 4,836) conducted in November–December 2022 on diverse samples of Americans, including one (Study 3) that was representative of the US population on several demographic benchmarks (see SI). Participants in Studies 1 & 2 were randomly assigned to either read a persuasive message on a policy generated by the AI program GPT-3 (AI condition), a persuasive message written by a prior human participant (Human condition), a message chosen by a prior human participant from a set of 5 AI-generated messages (Human-in-the-Loop condition [best-of-5]), or a neutral message on an irrelevant topic (eg. the history of skiing; Control condition). Study 3 included only an AI condition and a Control condition. The targeted policies were a public smoking ban in Study 1, an assault weapons ban in Study 2, and one of 4 randomly-assigned policies—a carbon tax, an increased child tax credit, a parental leave program, and automatic voter registration—in Study 3. In all experiments, participants reported their support for a policy before and after reading the assigned message. We pre-registered hypotheses and analyses for all 3 experiments.
Results: Across all 3 studies, AI-generated messages were consistently persuasive to human readers. As is typical in the political persuasion literature8, 9, the effect sizes were consistently small, ranging from about 2–4 points on the 101-point composite attitude scales we used in the 3 experiments (see Figure 1). In Study 1, participants’ support for a smoking ban increased statistically-significantly more if they were assigned to the AI condition than if they were assigned to the Control condition (b =3.62, CI = [1.92, 5.32], p < 0.001). Study 2replicated this effect using a highly polarized topic: gun control. Participants’ support for an assault weapons ban increased statistically-significantly more if they were assigned to the AI condition than if they were assigned to the Control condition (b = 1.81, CI = [0.69, 2.93], p = 0.002). Study 3 showed the robustness of this effect across a number of polarizing issues (b = 2.88, CI = [2.13, 3.63], p < 0.001 collapsing across 4 issues; see SI for issue-specific results).
…Participants assigned to read one of the AI-generated messages selected by human participants in the Human-in-the-Loop condition also became statistically-significantly more supportive of a smoking ban, and increased gun control, compared to participants in the Control (Study 1: β = 5.04, CI = [3.26, 6.82], p < 0.001; Study 2: β = 2.33, CI = [1.22, 3.44], p < 0.001). However, participants assigned to the Human-in-the-Loop condition did not increase in support for these two policies statistically-significantly more than participants assigned to either the AI condition (Study 1: β = 1.45, CI = [−0.43, 3.34], p = 0.131, BF01 = 7.61; Study 2: b = 0.50, CI = [−0.71, 1.72], p = 0.418, BF01 = 22.79; meta-analysis: β = 0.92, CI=[−0.04, 1.89], p = 0.059) or the Human condition (Study 1: β = 1.68, CI = [−0.26, 3.62], p = 0.089, BF01 = 7.03; Study 2: β = 0.02, CI = [−1.19, 1.23], p = 0.974, BF01 = 38.84; meta-analysis: b =0.56, CI=[−0.93, 2.06], p = 0.460).
Figure 1: Participants’ Change in Policy Support by Condition Across Studies. Note. y-axes represent the difference between participants’ post-treatment and pre-treatment policy support (both scaled 0–100, 100=highest level of support). Higher scores indicate participants became more supportive of the policy. Error bars represent 95% confidence intervals.
…Messages: We generated messages that participants read in the 3 experimental conditions and the control condition. For all experimental conditions, messages were generated with the aim to persuade readers to support a smoking ban in public places. For the AI condition, 50 messages were generated by GPT-3, an artificial intelligence program (text-davinci-002 model) on October 26, 2022. Participants were randomly assigned to read one of the 50 messages. For the human condition, 50 messages were generated by human participants (recruited from Prolific.com).
Participants were randomly assigned to read one of the 50 messages. For the Human-in-the-Loop condition, 300 human participants reviewed 5 AI-generated messages (randomly selected from the pool of 50 AI-generated messages) and selected the one that they thought was most likely to succeed in persuading a recipient to send to a future participant. Therefore some messages were sent to multiple recipients. Only individuals who were at least somewhat supportive of the smoking ban were allowed to be a message writer or a curator (one’s level of support must be at 0.60 or greater on the support scale that was also used to measure the message recipients’ policy support; see below). Participants in the control condition read one of 3 human-generated messages on a different topic (residential mobility, the history of skiing, or event licensing in a midsize town). All messages can be found at OSF.
The AI and human participants responded to the same prompt for generating persuasive messages (mean word count = 192.18 from AI, 157.68 from human):
Please try your best to write a message of about 200 words that can persuade a reader to agree with the following idea. “We should enforce a total smoking ban in public places.”
There is widespread concern that foreign actors are using social media to interfere in elections worldwide. Yet data have been unavailable to investigate links between exposure to foreign influence campaigns and political behavior.
Using longitudinal survey data from US respondents linked to their Twitter feeds, we quantify the relationship between exposure to the Russian foreign influence campaign and attitudes and voting behavior in the 2016 US election.
We demonstrate, first, that exposure to Russian disinformation accounts was heavily concentrated: only 1% of users accounted for 70% of exposures. Second, exposure was concentrated among users who strongly identified as Republicans. Third, exposure to the Russian influence campaign was eclipsed by content from domestic news media and politicians. Finally, we find no evidence of a meaningful relationship between exposure to the Russian foreign influence campaign and changes in attitudes, polarization, or voting behavior.
The results have implications for understanding the limits of election interference campaigns on social media.
[Twitter] The prevalence of misinformation has spurred various interested parties—regulators, the media, and competing firms—to debunk false claims in the marketplace. This research examines whether such debunking messages provided by these parties can impact consumer purchase behavior.
If so, does debunking effectively correct consumers’ misinformed beliefs—an ideal outcome from a policy maker’s perspective—or does it merely reinforce correct beliefs, as predicted by biased belief updating? With theory providing contradictory predictions, the authors design and implement a conjoint experiment that enables measurement of willingness to pay under exposure to real-world misinformation and debunking messages.
Focusing on 3 ingredients in product categories where misinformation is prevalent (aluminum in deodorant, fluoride in toothpaste, and genetically modified organisms in food), the authors find that debunking plays an important role in mitigating the impact of misinformation. More specifically, debunking can attenuate the decrease in willingness to pay caused by misinformation by correcting misbeliefs, a promising finding for policy makers. [Note: no ‘backfire effect’.]
The authors discuss the incentives for firms to debunk misinformation or to introduce new products that conform to misinformation.
This paper analyzes externalities generated by offline advertising campaigns on the performance of online ads.
Using advertising data on a panel of firms in the hotel industry, we estimate how a firm’s offline, display, and competing ad campaigns impact the effectiveness of Google and Facebook advertising.
We find a positive effect of traditional mass-media campaigns on Google clicks. Advertising from competitors does not affect Google ad performance but it increases advertising prices, suggesting keyword poaching. Further analyses hint that Google’s monopoly power and auction system allow free-riding on advertising externalities. Although we find similar positive effects on Facebook ads, they are not statistically-significant.
…This study proposes to test the existence of externalities across advertising media in a given industrial context, ie. the market for hotels. We leverage firm-level data from 5 advertisers belonging to an international hotel group to study how a brand’s offline and online display and competing ad campaigns impact Google and Facebook advertising outcomes. Using a fixed-effect regression with instrumental variables, we find offline investments have a positive impact on the effectiveness of Google search ads. For example, increasing the stock of offline advertising by 10% (≈ €7,200) increases clicks on Google ads by 0.5% (≈ 135 clicks). Surprisingly, we find a negative effect of display ads on Google clicks, suggesting that both media compete for users’ attention. Similar results are found for Facebook ads but they remain non-statistically-significant.
The presence of offline-to-online effects opens the path to a more important question, i.e. who benefits from such externalities? Further analyses show that by increasing the volume of searches and the propensity to click, offline advertising increases the overall Google price paid by the advertiser. In the long run, the increase in Google advertising performance (clicks) negatively affects the offline share of advertising budget.
Although they do not impact Google clicks, ads by competitors increase the Google cost for the focal brand, suggesting that firms compete in auctions to buy their competitors’ branded keywords (Desai et al 2014; Sayedi et al 2014; Simonov et al 2018). In other words, a firm can buy a well-known competitor’s Google keyword in order to free-ride its notoriety. For example, a London-based hotel chain could buy the keyword “Airbnb London” to appear in the latter’s search results. We refer to this strategy as brand poaching.
…Our results have several implications. (1) First, they suggest that online advertising’s return on investments (ROI) may be biased in the presence of externalities between offline and online ads. Given the positive effect of traditional media campaigns on search advertising outcomes, the effectiveness of the latter is likely to be over-estimated. (2) Second, as an online search monopoly, Google seems able to free-ride on such externalities. Indeed, the increase in queries and clicks generated by offline ads translates into additional revenues for Google since search ads are priced based on the quantity of consumer queries (cost-per-1,000 impressions model) or clicks (cost-per-click model). Thus when firms advertise offline, they affect Google advertising outcomes and pay additional search advertising costs. (3) Third, brand poaching creates a prisoner dilemma for brands that increase their Google advertising costs. We argue that this strategy should be regulated. (4) Finally, this study could suggest that offline and online advertising are complements rather than substitutes. While offline campaigns provide information and narratives to a mass of consumers, online ads guide consumers toward the purchase.
It is well documented that TV viewers avoid advertisements by switching channels during commercial breaks (“zapping”). Ads with lower audience retention ability lead to more consumer zapping.
Given that several ads are sequentially broadcast during a commercial break, an ad with a low retention rate will negatively affect the viewership of subsequent ads by decreasing their opportunities to be exposed to viewers. In this case, the ad imposes a negative externality on subsequent ads in the same commercial break. This externality is typically not priced in the TV advertising market; however, it may substantially affect the TV network’s profit.
Based on a large and rich data set on TV viewing and advertising, we build a comprehensive model of consumer zapping and conduct various simulation studies to quantify the impact of the zapping-induced externality on the network’s revenue.
Results: show that our focal network may increase gross revenue up to 19.38% by reordering ads during a commercial break so that the negative impact of this externality is minimized.
…We note that the average viewer outflow rate (ie. zap rate) and its variance are highest in the first minute, drop sharply in the second minute, and remain relatively stable thereafter. In summary, the net outflow rate is subject to a high degree of variation across minutes, and an average advertisement loses about 7% of the initial audience size at the start of the commercial break.
…For each ad A in break H, based on the estimated coefficients, we calculate the probability of each individual viewer watching ad A (unconditional on the viewing decision of the previous ad) in the current ad sequence in the data. We then average the viewing probabilities across all viewers in the break to get ad A’s average retention rate in break H. To eliminate the possible impact of slot position on ads’ capability to retain viewers, we set the slot position to be the first slot for all ads when calculating the retention rate. Figure 3 shows the distribution of retention rates across ads and breaks. Of the 4,893 combinations of ad and break, the estimated retention rate ranges 0.709–0.986, with a mean (SD) of 0.923 (0.046).
Email can deliver mobilization messages at considerably lower cost than direct mail. While voters’ email addresses are readily available, experimental work 2007–5201213ya suggests that email mobilization is ineffective in most contexts.
Here, we use public data to reexamine the effectiveness of email mobilization in the 2016Floridageneralelection.
Unsolicited emails sent from a university professor and designed to increase turnout had the opposite effect: emails slightly demobilizing voters. While the overall decrease in turnout amounted to less than 1% of the margin of victory in the presidential race in the state, the demobilizing effect was particularly pronounced among minority voters. Compared to voters from the same group who were assigned to control, black voters assigned to receive emails were 2.2 percentage points less likely to turn out, and Latino voters were 1.0 percentage point less likely to turn out.
These findings encourage both campaigns and researchers to think critically about the use and study of massive impersonal mobilization methods.
Facebook advertisements are widely used in modern political campaigning and have come under tremendous scrutiny for their perceived ability to impact elections. However, there is limited evidence as to their effectiveness on voting behavior.
…In collaboration with Progress Texas, a 501(c)3 organization, I target lower-propensity voters with 7 weeks of issue-oriented advertisements on Facebook, with subjects randomly assigned to one of 4 message streams or a control group. Ads were microtargeted using voter file data that was uploaded to Facebook via the Custom Audiences tool, allowing for specific voters to be assigned to treatment conditions.
effects are conditional on an alignment of message, audience, and electoral context. Despite the large sample (n = 871,479) there is no detectable main effect of advertisements on turnout. Only individuals in competitive congressional districts assigned to receive ads about abortion rights and women’s healthcare exhibited a statistically-significant increase in predicted turnout (1.66pp relative to a control group); effects were concentrated among female voters. 3 other message conditions had no impact on turnout.
Despite the increasing sums devoted to online political advertising, our understanding of the persuasive effects of such advertising is limited.
We report the results of a ZIP code level randomized field experiment conducted over Facebook and Instagram during the 2018 US midterm electionsin Florida. The ads, produced by a Democratic-leaning political action committee, were designed to spur Democratic vote share and were seen more than 1.1 million times with over 100,000 full views.
This wide saturation notwithstanding, we find that these advertisements had very small estimated effects on Democratic vote share at the precinct level (−0.04 percentage points, SE: 0.85 points).
Our results underline the challenges of political persuasion via digital advertisements, particularly in competitive electoral contexts.
Our data consist of 4,964 effects from 2,766 experiments conducted on a commercial A/B testing platform, Optimizely.
Using 3 different methods, we find that the FDR ranges between 28% and 37% for tests conducted at 10% statistical-significance and between 18% and 25% for tests at 5% statistical-significance (two sided). These high FDRs stem mostly from the high fraction of true null effects, about 70%, rather than from low statistical power…A similarly high fraction of null effects has been observed on Microsoft’s Bing (Deng2015), and our study generalizes this finding to a much greater set of experimenters, organizations, and industries.
Using our estimates, we also assess the potential of various A/B test designs to reduce the FDR. The 2 main implications are that decision makers should expect one in 5 interventions achieving statistical-significance at 5% confidence to be ineffective when deployed in the field and that analysts should consider using 2-stage designs with multiple variations rather than basic A/B tests.
We present the first field experiment on how organized interest groups’ television ads affect issue opinions.
We randomized 31,404 voters to 3 weeks of interest group ads about either immigration or transgender non-discrimination. We then randomly assigned voters to receive ostensibly unrelated surveys either while the ads aired, one day after they stopped, or 3 days afterwards.
Voters recalled the ads, but 3 ads had minimal impacts on public opinion, while a 4th’s impacts decayed within one day. However, voters remembered a fact from one ad. Our results suggest issue ads can effect public opinion, but that not every ad persuades and that persuasive effects decay.
Despite the vast sums spent on television ads, our results are the first field experiment on their persuasive power on issues, shedding light on the mechanisms underpinning—and limits on—both televised persuasion and interest group influence.
…We examine the effects of 4 television advertisements on voters’ issue attitudes, issue knowledge, and intent to engage in political activism. The advertisements cover immigration and LGBTQ non-discrimination, 2 salient topics subject to considerable “outside lobbying” over the last decade.
We find that television ads can have effects on public opinion while the ads are airing and that the ads can teach voters facts they remember, contrasting with prior findings on candidate campaign ads (Huber & Arceneaux2007, Spenkuch & Toniatti2018). However, we find that not all ads persuade, and that the ads that do persuade have effects that fade rapidly, consistent with findings from candidate campaigns (Gerber et al 2011; Hill et al 2013; Kalla & Broockman2018). In short, we find that television advertising can allow groups to temporarily change public sentiment and to inform the public, but that not every ad is effective and that persuasive effects may be short-lived.
…Treatment Implementation and Outcome Measurement: The advertisements aired for 3 weeks, a length of time the partner organizations thought would be sufficient to test the ads’ persuasive power. The advertising firm did not stipulate particular networks or hours for the ads to run. Instead, they could run whenever the television was turned on. Across all voters, the average household was exposed to the ads 19.7×. Put in terms of Gross Rating Points (GRPs), which are defined as 100× the expected number of times an individual in the target audience viewed the ad, the intervention was therefore equivalent to ~1,970 GRPs over the course of 3 weeks—a large volume. (By contrast, Gerber et al 2011 randomized media markets to receive up to only 1,000 GRPs per week.) The firm was also able to collect data on how often each household was exposed to an advertisement for a non-random 51% of voters who have newer television technologies, allowing us to estimate treatment-on-treated (TOT) effects among this subgroup.
Figure 2: Estimated Treatment Effects of LGBTQ Ad. Notes: Standard errors (thick lines) and 95% confidence intervals (thin) surround point estimates. See Tables OA29–32;41 for numerical estimates
…We first find large effects on recall of seeing an ad about LGBTQ people. This confirms that the ads were delivered to the treatment group and demonstrates that the ads were memorable. In particular, among all post-treatment survey respondents (regardless of when they were surveyed), we estimate a statistically-significant 5.9 percentage point ITT effect on recall (SE = 0.4, p < 0.001). This effect does not appear to decay; 3 days after the advertisement stopped airing, we still find a 6.0 percentage point increase in recall (ITT, SE = 0.7, p < 0.001). Figure 2 shows that both the ITT and TOT effects are meaningfully sized when expressed in terms of standard deviations.
We also find that the advertisements decrease prejudice against LGBTQ people and increase support for LGBTQ-inclusive policies while the advertisement is airing. However, these effects appear to rapidly decay once the advertisement stopped and are primarily driven by Democratic respondents (Table OA38).
Figure 3: Treatment Effects of Immigration Ad
…If an organized group seeks to durably change attitudes, television advertising may not produce effects as large or durable; however, given the low per-person cost of TV ads, our confidence intervals are too wide to form confident conclusions about the relative cost-effectiveness of TV advertising and personal contact.
The success of video streaming social networking sites (eg. YouTube) is reliant upon savvy integration of video advertising into massive amounts of user-generated content. These sites must weigh when, where, and how much advertising should be used to increase profit without causing irritation.
This study examined 2 key variables related to streaming advertising (ie. ad position and contextual congruence), and tested their impact on anger, perceptions of intrusiveness, and narrative engagement.
Using an online experiment (n = 327), we found that mid-roll ads [ads in the middle of the video] led to higher levels of perceived intrusiveness and anger than pre-roll ads [ads at the beginning before the video]. Anger and perceived intrusiveness were shown to statistically-significantly mediate the effect of mid-roll ad placements on ad and brand attitudes, with anger also mediating purchase intention. Though narrative engagement did not mediate the relationship between ad placement and resulting outcomes, we identified a sequential anger-narrative engagement mediating effect that shaped ad and brand outcomes.
Theoretical and practical implications are discussed.
We estimate the distribution of television advertisingelasticities and the distribution of the advertising return on investment (ROI) for a large number of products in many categories…We construct a data set by merging market (DMA) level TV advertising data with retail sales and price data at the brand level…Our identification strategy is based on the institutions of the ad buying process.
Our results reveal substantially smaller advertising elasticities compared to the results documented in the literature, as well as a sizable percentage of non-statistically-significant or negative estimates. The results are robust to functional form assumptions and are not driven by insufficient statistical power or measurement error.
The ROI analysis shows negative ROIs at the margin for more than 80% of brands, implying over-investment in advertising by most firms. Further, the overall ROI of the observed advertising schedule is only positive for one third of all brands.
…We find that the mean and median of the distribution of estimated long-run own-advertising elasticities are 0.023 and 0.014, respectively, and 2⁄3rds of the elasticity estimates are not statistically-significantly different from zero. These magnitudes are considerably smaller than the results in the extant literature. The results are robust to controls for own and competitor prices and feature and display advertising, and the advertising effect distributions are similar whether a carryover parameter is assumed or estimated. The estimates are also robust if we allow for a flexible functional form for the advertising effect, and they do not appear to be driven by measurement error.
…First, the advertising elasticity estimates in the baseline specification are small. The median elasticity is 0.0140, and the mean is 0.0233. These averages are substantially smaller than the average elasticities reported in extant meta-analyses of published case studies (Assmus et al 1984b, Sethuraman et al 2011). Second, 2⁄3rds of the estimates are not statistically distinguishable from zero. We show in Figure 2 that the most precise estimates are those closest to the mean and the least precise estimates are in the extremes.
Note: Brands are arranged on the horizontal axis in increasing order of their estimated ad effects. For each brand, a dot plots the point estimate of the ad effect and a vertical bar represents the 95% confidence interval. Results are from the baseline strategy model with δ = 0.9 (Equation 1).
…6.1 Average ROI of Advertising in a Given Week:
In the first policy experiment, we measure the ROI of the observed advertising levels (in all DMAs) in a given week t relative to not advertising in week t. For each brand, we compute the corresponding ROI for all weeks with positive advertising, and then average the ROIs across all weeks to compute the average ROI of weekly advertising. This metric reveals if, on the margin, firms choose the (approximately) correct advertising level or could increase profits by either increasing or decreasing advertising.
We provide key summary statistics in the top panel of Table III, and we show the distribution of the predicted ROIs in Figure 3a. The average ROI of weekly advertising is negative for most brands over the whole range of assumed manufacturer margins. At a 30% margin, the median ROI is −88.15%, and only 12% of brands have positive ROI. Further, for only 3% of brands the ROI is positive and statistically-significantly different from zero, whereas for 68% of brands the ROI is negative and statistically-significantly different from zero.
Figure 3: Predicted ROIs.
Note: Panel (a) provides the distribution of the estimated ROI of weekly advertising and panel (b) provides the distribution of the overall ROI of the observed advertising schedule.
Each is provided for 3 margin factors, m = 0.2, m = 0.3, and m = 0.4. The median is denoted by a solid vertical line and zero is denoted with a vertical dashed line. Gray indicates brands with negative ROI that is statistically-significantly different from zero. Red indicates brands with positive ROI that is statistically-significantly different from zero. Blue indicates brands with ROI not statistically-significantly different from zero.
These results provide strong evidence for over-investment in advertising at the margin. [In Appendix C.3, we assess how much larger the TV advertising effects would need to be for the observed level of weekly advertising to be profitable. For the median brand with a positive estimated ad elasticity, the advertising effect would have to be 5.33× larger for the observed level of weekly advertising to yield a positive ROI (assuming a 30% margin).]
6.2 Overall ROI of the Observed Advertising Schedule: In the second policy experiment, we investigate if firms are better off when advertising at the observed levels versus not advertising at all. Hence, we calculate the ROI of the observed advertising schedule relative to a counterfactual baseline with zero advertising in all periods.
We present the results in the bottom panel of Table III and in Figure 3b. At a 30% margin, the median ROI is −57.34%, and 34% of brands have a positive return from the observed advertising schedule versus not advertising at all. Whereas 12% of brands only have positive and 30% of brands only negative values in their confidence intervals, there is more uncertainty about the sign of the ROI for the remaining 58% of brands. This evidence leaves open the possibility that advertising may be valuable for a substantial number of brands, especially if they reduce advertising on the margin.
…Our results have important positive and normative implications. Why do firms spend billions of dollars on TV advertising each year if the return is negative? There are several possible explanations. First, agency issues, in particular career concerns, may lead managers (or consultants) to overstate the effectiveness of advertising if they expect to lose their jobs if their advertising campaigns are revealed to be unprofitable. Second, an incorrect prior (ie. conventional wisdom that advertising is typically effective) may lead a decision maker to rationally shrink the estimated advertising effect from their data to an incorrect, inflated prior mean. These proposed explanations are not mutually exclusive. In particular, agency issues may be exacerbated if the general effectiveness of advertising or a specific advertising effect estimate is overstated. [Another explanation is that many brands have objectives for advertising other than stimulating sales. This is a nonstandard objective in economic analysis, but nonetheless, we cannot rule it out.]
While we cannot conclusively point to these explanations as the source of the documented over-investment in advertising, our discussions with managers and industry insiders suggest that these may be contributing factors.
[press release] Online vendors often employ drip-pricing strategies, where mandatory fees are displayed at a later stage in the purchase process than base prices.
We analyze a large-scale field experiment on StubHub.com and show that:
disclosing fees upfront reduces both the quantity and quality of purchases. The effect of salience on quality accounts for at least 28% of the overall revenue decline. Detailed click-stream data show that price shrouding makes price comparisons difficult and results in consumers spending more than they would otherwise.
We also find that sellers respond to increased price obfuscation by listing higher-quality tickets.
E-commerce and online advertisement are growing trends • The overall impact of ad blockers is unclear • Using survey data, the effect of ad blocker use on online purchases is quantified • The analysis reveals a positive effect of ad blocker use on e-commerce • In the light of the results stakeholders should consider if the present online ads formats are the most suitable
The use of ad blocking software has risen sharply with online advertising and is recognized as challenging the survival of the ad supported web. However, the effects of ad blocking on consumer behavior have been studied scarcely.
This paper uses propensity score matching techniques on a longitudinal survey of 4,411 Internet users in Spain to show that ad blocking has a causal positive effect on their number of online purchases. This could be attributed to the positive effects of ad blocking, such as a safer and enhanced navigation.
This striking result reinforces the controversial debate of whether current online ads are too bothersome for consumers.
…This study employs a rich dataset coming from a longitudinal survey. The source of the data is a survey conducted by the Spanish Markets and Competition Authority on the same sample of interviewees in the 4th quarter of 2017 and in the second quarter of 2018 (CNMCData2019). The sample was designed to be representative of the population living in private households in Spain. The information was provided by 4,411 Internet users ≥16 years old. At the baseline time point (fourth quarter of 2017) these individuals were asked if they regularly used ad blocking tools when navigating the web. Additionally, the survey collected information on their socio-demographic characteristics (age, gender, education level and employment status) and on how they used Internet (frequency of use of online services like: GPS navigation services, instant messaging, mobile gaming, social networks, e-mail and watching videos on the phone). 6 months later (second quarter of 2018), the same individuals were asked how many online purchases they had made during the previous 6 months (these included goods and services purchases, irrespective of the form of payment). Thus, the outcome variable (number of online purchases) occurred later than the collection of the ad blocking information and the rest of variables (our X covariates).
Analysis
N
Treated
Controls
Difference (ATT)
95% LCI
95% UCI
p-value
Unmatched
4411
5.084
2.735
2.348
—
—
—
PSM—NN
1648
5.084
3.325
1.759
0.994
2.523
<0.001
PSM—KM
4411
5.084
3.733
1.351
0.658
2.044
<0.001
Stratification on PS quintiles
4411
5.084
3.686
1.398
0.724
2.072
<0.001
Stratification on PS deciles
4411
5.084
3.774
1.310
0.626
1.994
<0.001
PSM—NN after CEM pruning (1)
1160
4.979
3.773
1.206
0.165
2.246
0.023
PSM—NN after CEM pruning (2)
1622
5.082
3.476
1.605
0.830
2.380
<0.001
Table 2: Estimated average treatment effects of ad blockers on online shopping (number of purchases in 6 months). [ATT: average treatment effect on the treated. PSM: propensity score matching. NN: nearest neighbor. KM: kernel matching. PS: propensity scores. CEM: coarsened exact matching. LCI: lower confidence interval. UCI: upper confidence interval. (1) CEM pruning by using use of Internet apps covariates. (2) CEM pruning by using socio-demographic covariates.]
A policy debate centers around the question how news aggregators such as Google News affect traffic to online news sites. Many publishers view aggregators as substitutes for traditional news consumption while aggregators view themselves as complements because they make news discovery easier.
We use Spain as a natural experiment because Google News shut down altogether in response to a copyright reform enacted in December 201411ya. We compare the news consumption of a large number of Google News users with a synthetic control group of similar non-Google News users. We find that the shutdown of Google News reduces overall news consumption by about 20% for treatment users, and reduces page views on publishers other than Google News by 10%. This decrease is concentrated around small publishers. We further find that users are able to replace some but not all of the types of news they previously read. Post-shutdown, they read less breaking news, hard news, and news that is not well covered on their favorite news publishers.
These news categories explain most of the overall reduction in news consumption, and shed light on the mechanisms through which aggregators interact with traditional publishers.
Evidence across social science indicates that average effects of persuasive messages are small. One commonly offered explanation for these small effects is heterogeneity: Persuasion may only work well in specific circumstances. To evaluate heterogeneity, we repeated an experiment weekly in real time using 2016 US presidential election campaign advertisements. We tested 49 political advertisements in 59 unique experiments on 34,000 people.
We investigate heterogeneous effects by sender (candidates or groups), receiver (subject partisanship), content (attack or promotional), and context (battleground versus non-battleground, primary versus general election, and early versus late). We find small average effects on candidate favorability and vote. These small effects, however, do not mask substantial heterogeneity even where theory from political science suggests that we should find it.
During the primary and general election, in battleground states, for Democrats, Republicans, and Independents, effects are similarly small. Heterogeneity with large offsetting effects is not the source of small average effects.
This work compares Single Shot MultiBox Detector (SSD) and You Only Look Once (YOLO) deep neural networks for the outdoor advertisement panel detection problem by handling multiple and combined variabilities in the scenes. Publicity panel detection in images offers important advantages both in the real world as well as in the virtual one. For example, applications like Google Street View can be used for Internet publicity and when detecting these ads panels in images, it could be possible to replace the publicity appearing inside the panels by another from a funding company.
In our experiments, both SSD and YOLO detectors have produced acceptable results under variable sizes of panels, illumination conditions, viewing perspectives, partial occlusion of panels, complex background and multiple panels in scenes. Due to the difficulty of finding annotated images for the considered problem, we created our own dataset for conducting the experiments.
The major strength of the SSD model was the almost elimination of False Positive (FP) cases, situation that is preferable when the publicity contained inside the panel is analyzed after detecting them. On the other side, YOLO produced better panel localization results detecting a higher number of True Positive (TP) panels with a higher accuracy.
Finally, a comparison of the two analyzed object detection models with different types of semantic segmentation networks and using the same evaluation metrics is also included.
Most online content publishers have moved to subscription-based business models regulated by digital paywalls. But the managerial implications of such freemium content offerings are not well understood.
We, therefore, used microlevel user activity data from the New York Times to conduct a large-scale study of the implications of digital paywall design for publishers. Specifically, we use a quasi-experiment that varied the (1) quantity (the number of free articles) and (2) exclusivity (the number of available sections) of free content available through the paywall to investigate the effects of paywall design on content demand, subscriptions, and total revenue.
The paywall policy changes we studied suppressed total content demand by about 9.9%, reducing total advertising revenue. However, this decrease was more than offset by increased subscription revenue as the policy change led to a 31% increase in total subscriptions during our seven-month study, yielding net positive revenues of over $344,020$230k2013. The results confirm an economically-significant impact of the newspaper’s paywall design on content demand, subscriptions, and net revenue. Our findings can help structure the scientific discussion about digital paywall design and help managers optimize digital paywalls to maximize readership, revenue, and profit.
Figure 5: Average Number of Articles Read on the Browser NumArticlesitBrowser by Subscribers and Non-subscribers. ¶ Notes: (1) “High Quantity” represents access to all the published content and “Low Quantity” denotes access to 3 articles per day. Similarly, “High Diversity” represents access to all sections whereas “Low Diversity” represents access to content from only top news and video sections. (2) For simplicity of exposition, the plot only shows readers who stayed subscribers or non-subscribers throughout. (3) The fitted line in the plot is the least-squares line.
…During our observation period, the NYT paywall allowed 10 free articles per month via channels (1) and (2). Visitors could, however, read an unlimited number of articles through the mobile app but only from the top news and video sections. However, on 2013-06-27, the NYT started metering their mobile apps such that unsubscribed users could only read 3 articles per day. At the same time, those articles could now be accessed from any section and not just from the top news and video sections. If, after hitting their quota, a user tries to access more articles, they see a pop-up in the mobile app urging them to become a subscriber.9 To kick off the update, users had a one-week trial period from the time they updated the app during which they could freely read any number of articles from any sections…Estimation results are shown in Table 10, and it’s easy to see that the impacts of the various variables are qualitatively and directionally similar as in Table 2. The policy change decreased total readership by 9.9% using the Poisson regression specification and ~7% using the log-linearized specification.
This study examines the timing of pop-up advertising appearance and its effect on perceived intrusiveness, advertising irritation and advertising avoidance.
Experiment was designed to build a virtual Internet environment (including the main content on the webpage and a pop-up ad) and to manipulate the timing of the pop-up advertising appearance. Participants were invited to participate in two experiments, and then assigned to a specific target browsing task; their advertising browsing activities during the task were measured. In order to measure their cognitive advertising avoidance, an eye-tracking device was used to gain objective and accurate psychological information.
Results showed that earlier pop-up advertising appearances are associated with a lower consumer fixation count and fixation length; in contrast, pop-up advertising that appears later is associated with a higher fixation count and fixation length.
This study attempts to gain more objective and accurate psychological data by using an eye-tracking device to collect information about eye movements associated with the appearance of pop-up advertising to better analyse consumer behaviors towards them. These results offer insights to Internet advertisers and Internet platform companies on how to provide more efficient Internet advertising.
Purpose: The purpose of this study is to investigate online viewers’ preferences concerning the number and duration of video advertisements to watch during commercial breaks. The goal of the investigations was to assess whether online viewers preferred watching a fewer number of advertisements with longer durations or a greater number of advertisements with shorter durations.
Design/methodology/approach: Two studies used experimental research designs to assess viewers’ preferences regarding advertisements. These designs used two independent variables and one dependent variable. The first independent variable manipulated the type of choice options given to online viewers (eg. one 60 s or two 30 s advertisements). The second independent variable manipulated when the choice was given to online viewers (ie. at the beginning of the viewing experience or in the middle of the experience). The dependent variable measured viewers’ choices concerning their preferred advertisement option.
Results: The results across both studies found that participants made choices that minimized total advertisement exposure time when possible. When minimizing total exposure time was not possible, participants made choices that minimized the number of exposures instead.
Conclusion: These investigations extend the literature on advertisement choice by examining online viewers’ preferences about the format of their advertising experience rather than the content of the persuasive messages themselves. In addition, these investigations provide value by investigating viewers’ responses to stimuli within realistic online simulations rather than abstract hypotheticals.
Ad blockers allow users to browse websites without viewing ads. Online news providers that rely on advertising revenue tend to perceive users’ adoption of ad blockers purely as a threat to revenue. Yet, this perception ignores the possibility that avoiding ads, which users presumably dislike, may affect users’ online news consumption behavior in positive ways.
Using 3.1 million anonymized visits from 79,856 registered users on a news website, we find that adopting an ad blocker has a robust positive effect on the quantity and variety of articles users consume (21.5%—43.3% more articles and 13.4%—29.1% more content categories). An increase in repeat user visits of the news website, rather than the number of page impressions per visit, drives the news consumption. These visits tend to start with direct navigation to the news website, indicating user loyalty. The increase in news consumption is more substantial for users who have less prior experience with the website.
We discuss how news publishers could benefit from these findings, including exploring revenue models that consider users’ desire to avoid ads.
This article examines the development of the media franchise Mahō Shōjo Madoka Magika/Puella Magi Madoka Magica from the perspective of the growth of character media ecologies. Originating as a 201114ya anime series, Madoka Magica presented a critically acclaimed narrative featuring a dark, traumatic take on the magical girl genre of media.
Outside this narrative context, however, Madoka Magica has developed into a vibrant array of media products, including manga, video games, character merchandising, and cross-promotional brand marketing, with little to no reference in these products to the dark context of the chronologically prior characters. Characters who were brutally killed in one context become smiling ambassadors for convenience stores in another; the monsters fought against become cohabiting associates, if not allies, between texts.
By focusing on the marketing, proliferation, and malleability of the Madoka Magica characters, and the brand’s evident emphasis on the characters’ affective potential outside the narrative context of the original series, this article highlights the multiplicity of characters within the brand’s officially produced media mix.
Examining the production of the brand as a totality of products becomes a staging point for future analysis into character marketing more broadly, and the divergent approaches to such marketing across a global context.
Radio remains popular, delivering an audience reach of over 90%, but radio ratings may overestimate real advertising exposure. Little is known about audience and media factors affecting radio-advertising avoidance. Many advertisers have believed as much as 1⁄3rd of the audience switch stations during radio-advertising breaks.
In the current study, the authors combined Canadian portable people-meter data ratings to measure loss of audience during advertising. They discovered a new benchmark of 3% (across conditions) for mechanical (or actual physical) avoidance of radio advertising, such as switching stations or turning off the radio.
This rate is about one-tenth of current estimates, but was higher for music versus talk stations, out-of-home versus in-home listening, and early versus late dayparts.
Annotations sorted by machine learning into inferred 'tags'. This provides an alternative way to browse: instead of by date order, one can browse in topic order. The 'sorted' list has been automatically clustered into multiple sections & auto-labeled for easier browsing.
Beginning with the newest annotation, it uses the embedding of each annotation to attempt to create a list of nearest-neighbor annotations, creating a progression of topics. For more details, see the link.
: Histogram of Statistically-Significant (at α = 1%) Age-Adjusted Pairwise Correlation Coefficients between 96 Nongenetic Characteristics. British Women Aged 60--79 years old. Demonstrates that pair-wise correlations are common even in apparently unrelated traits.")


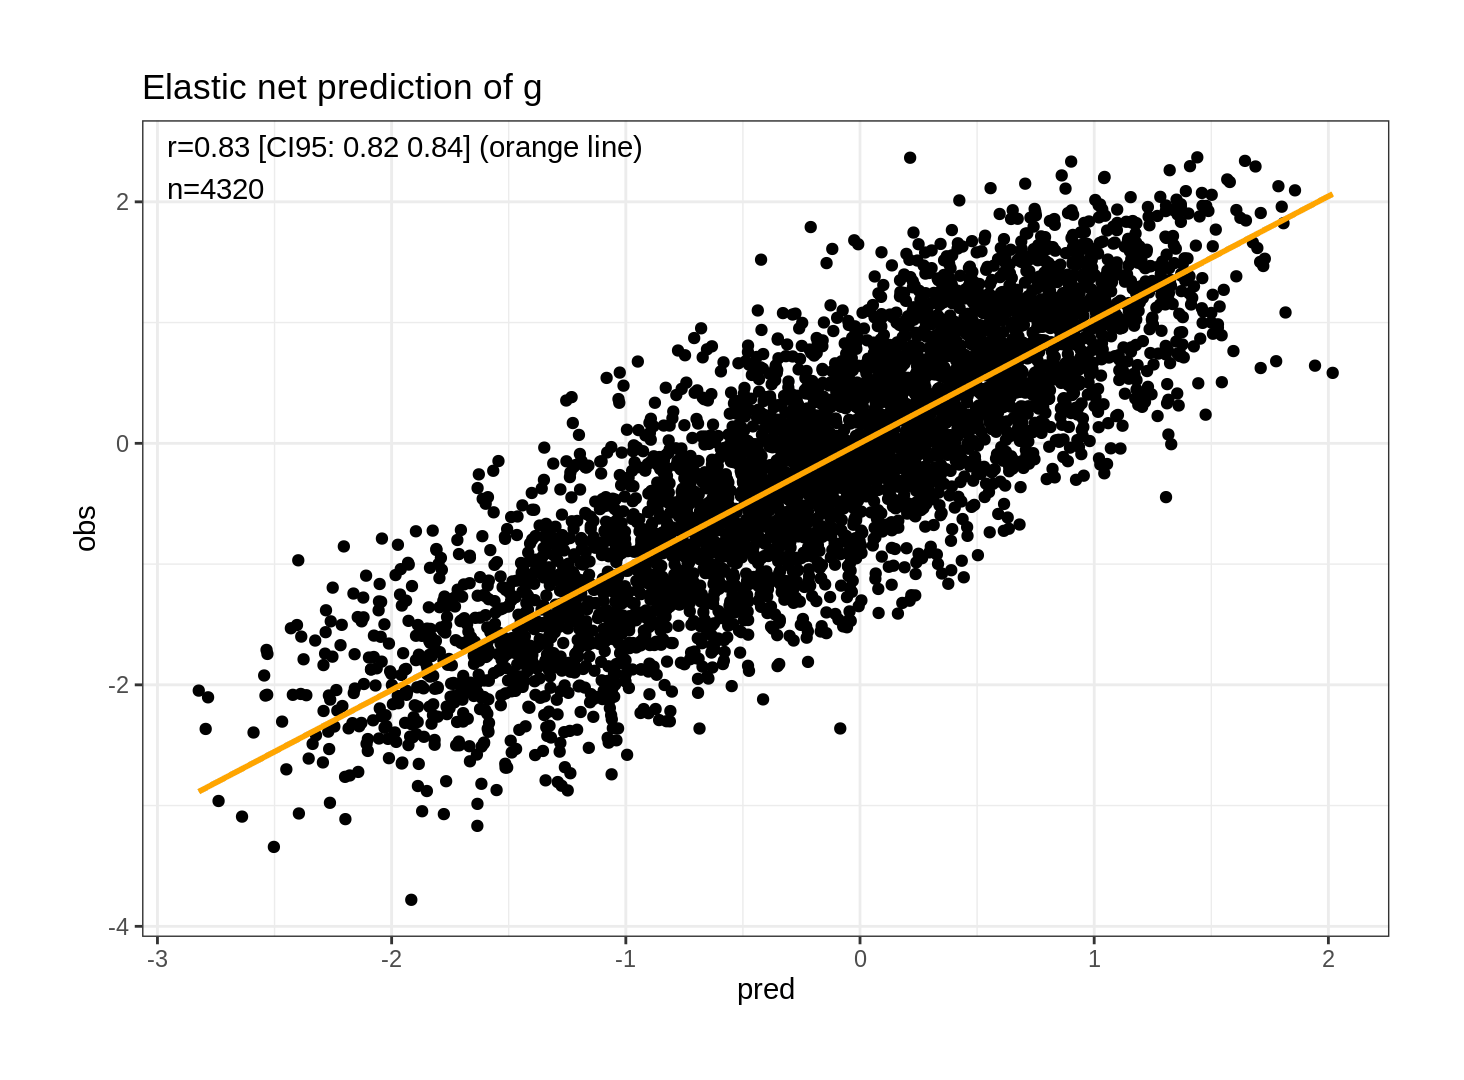
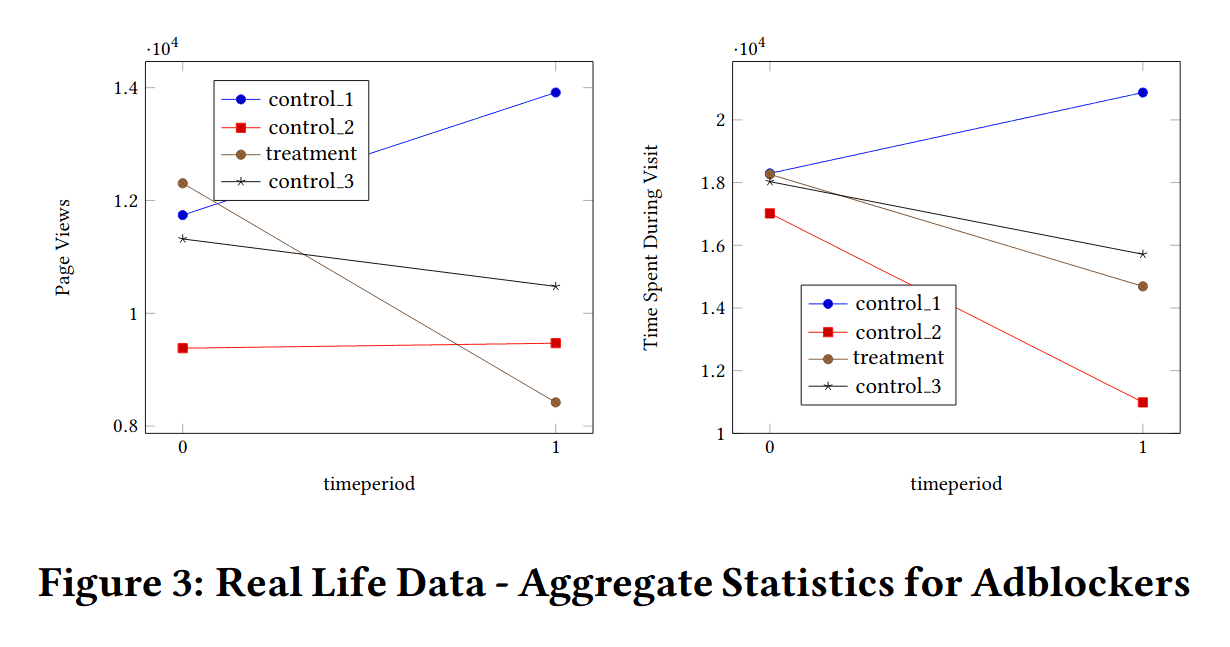
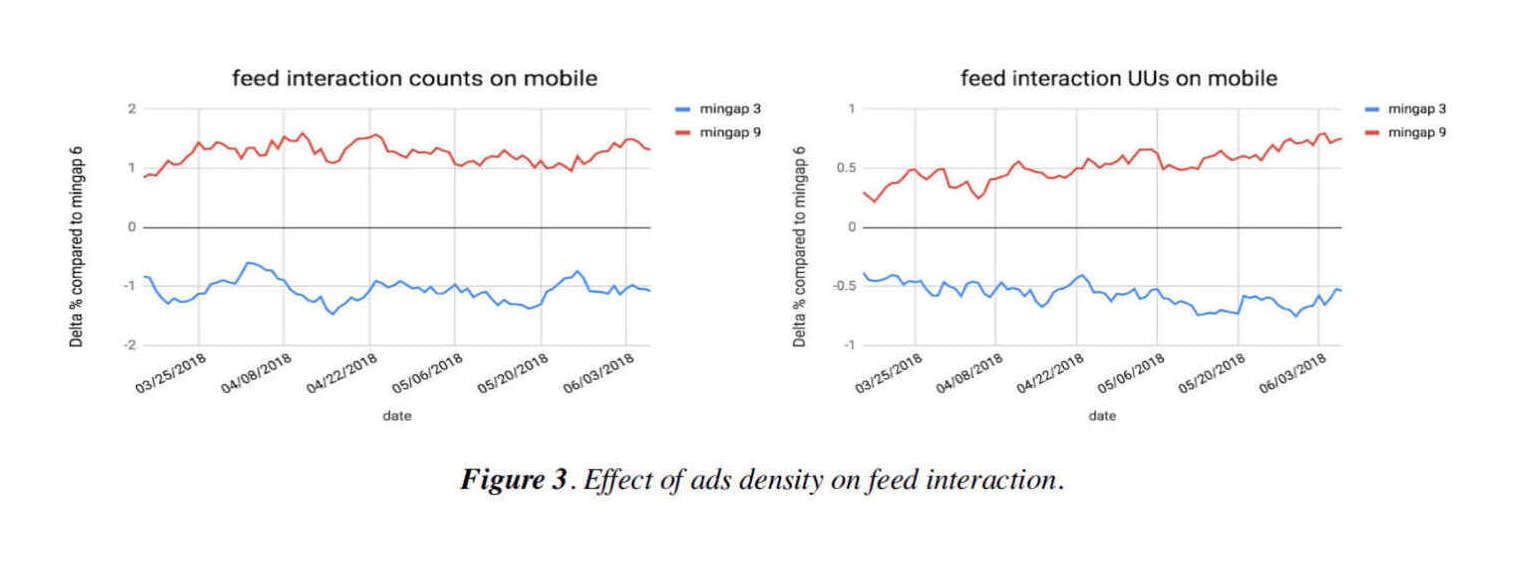
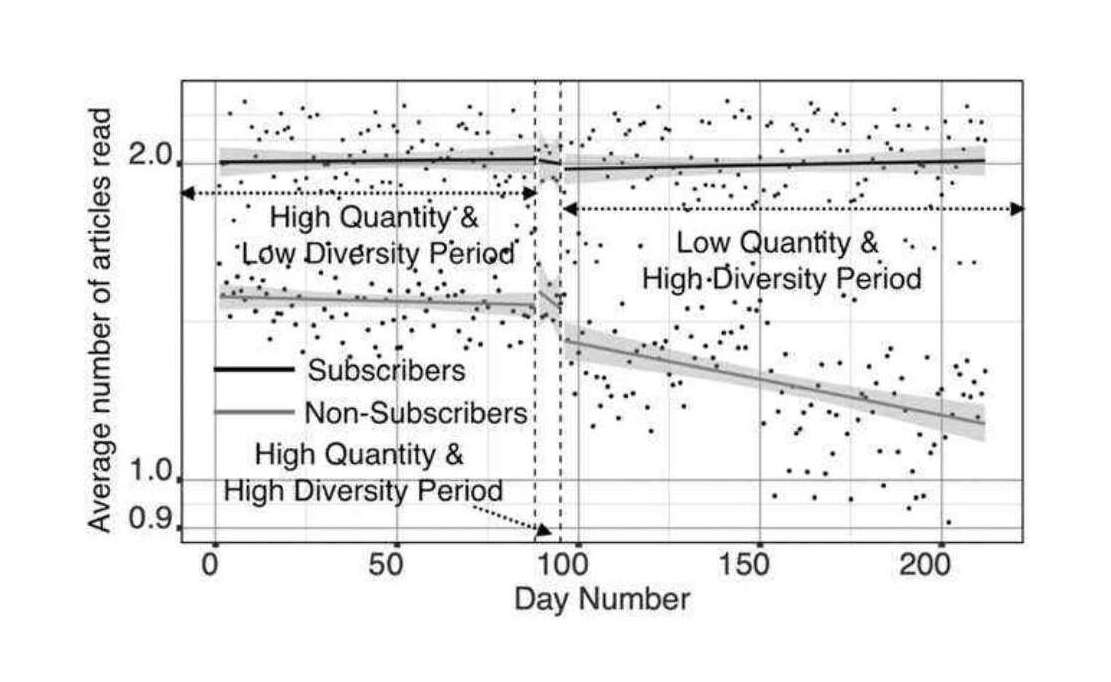
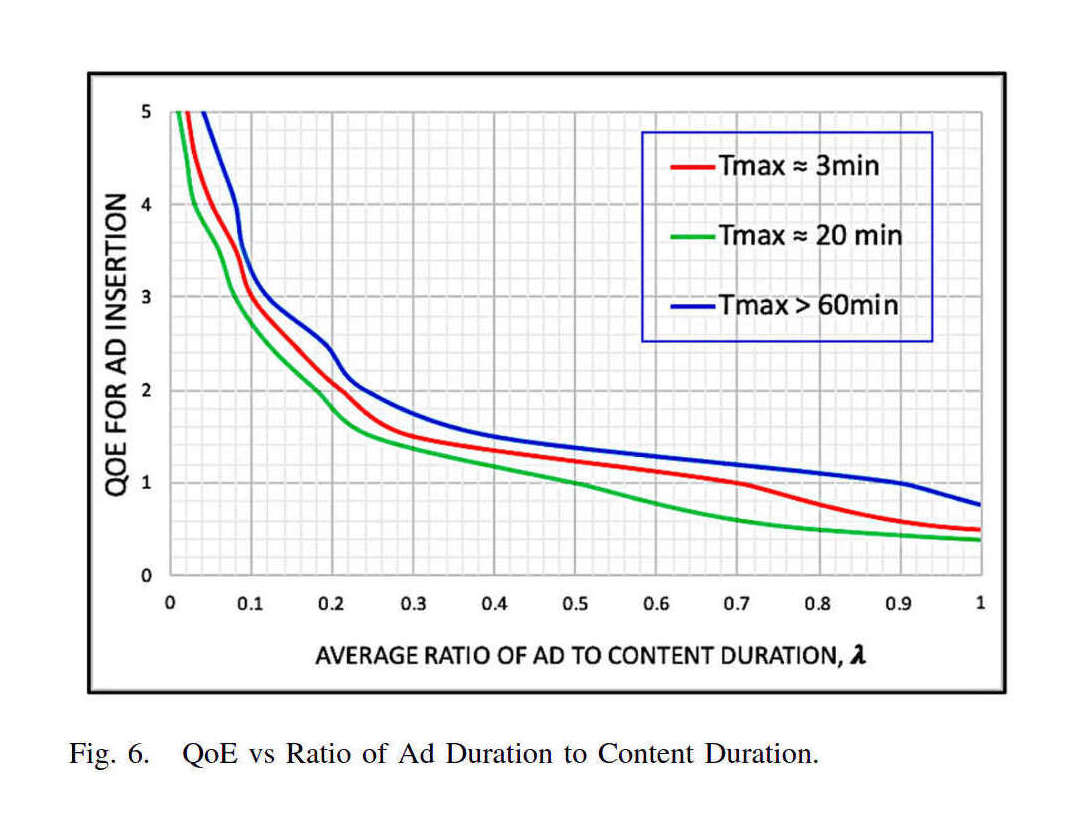
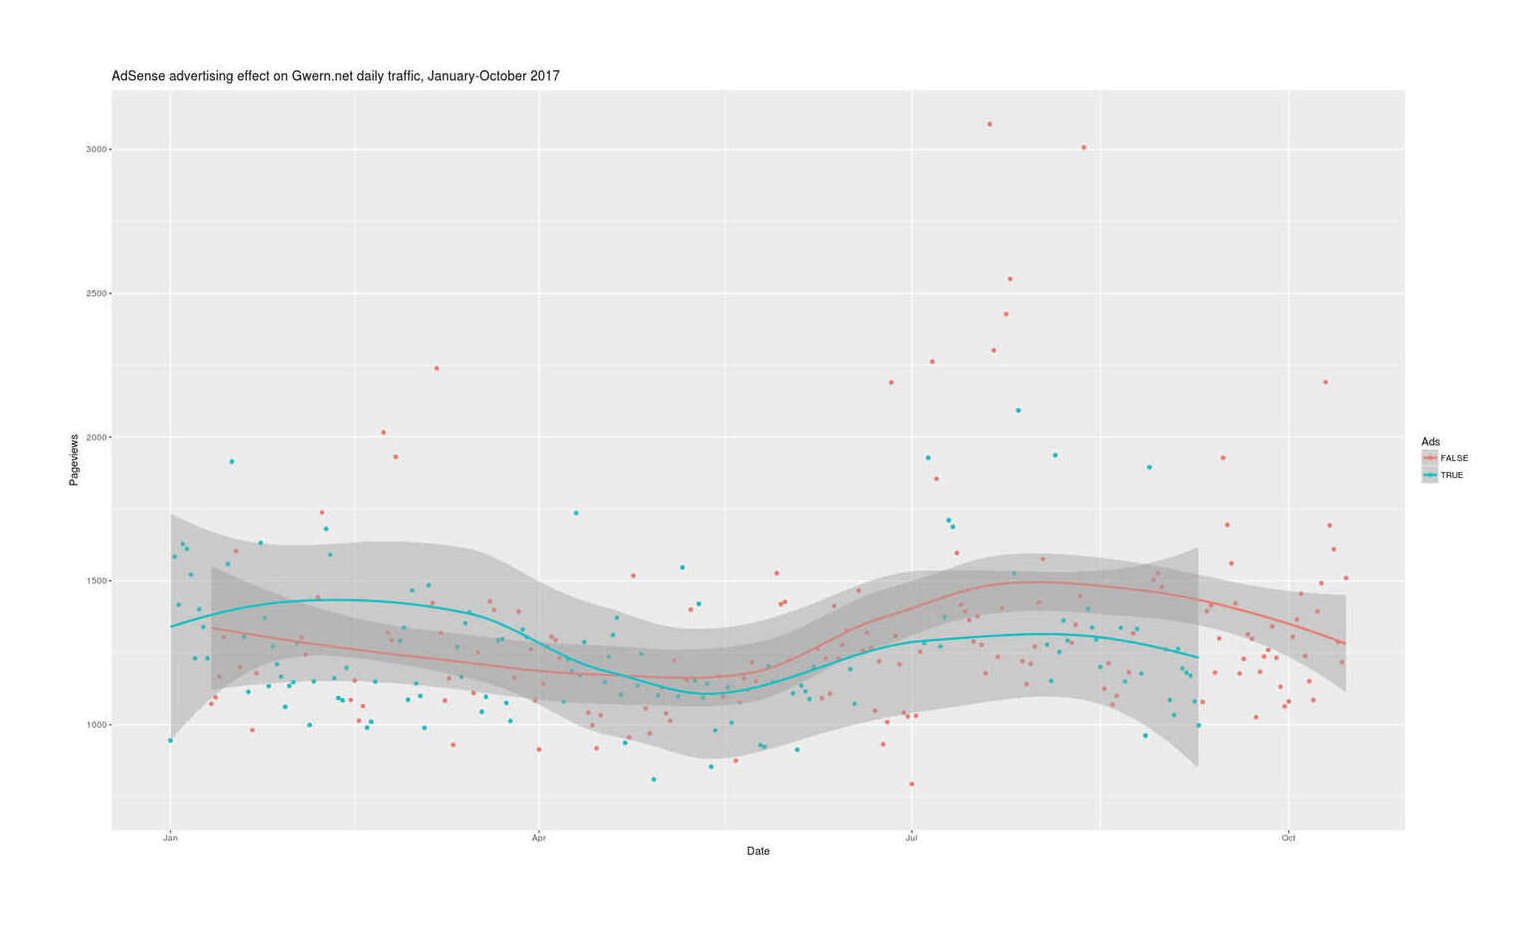
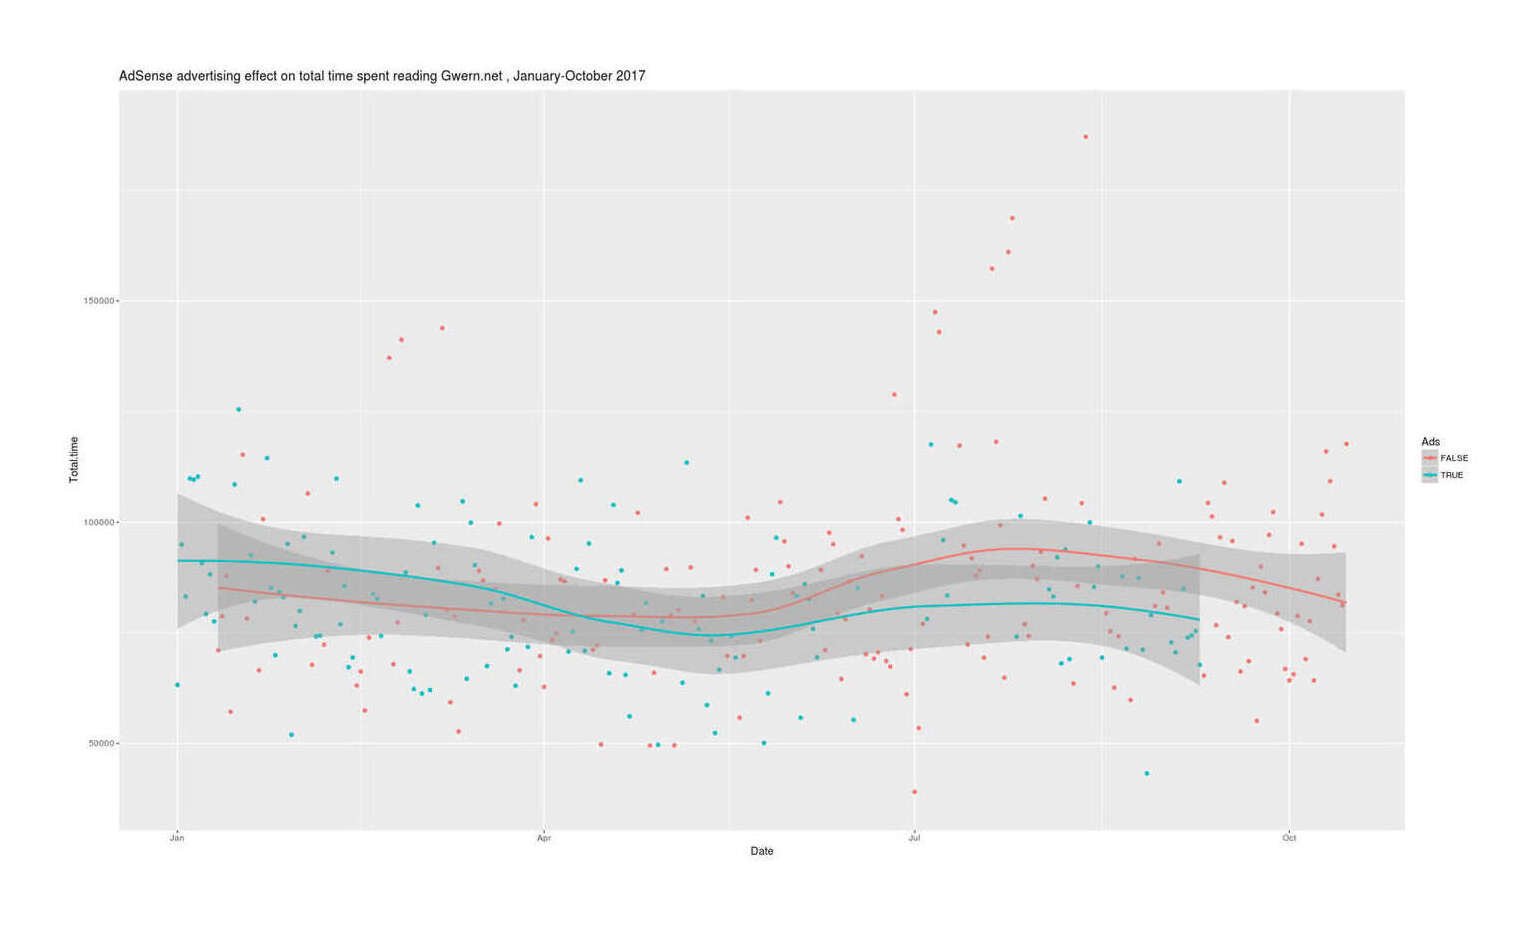
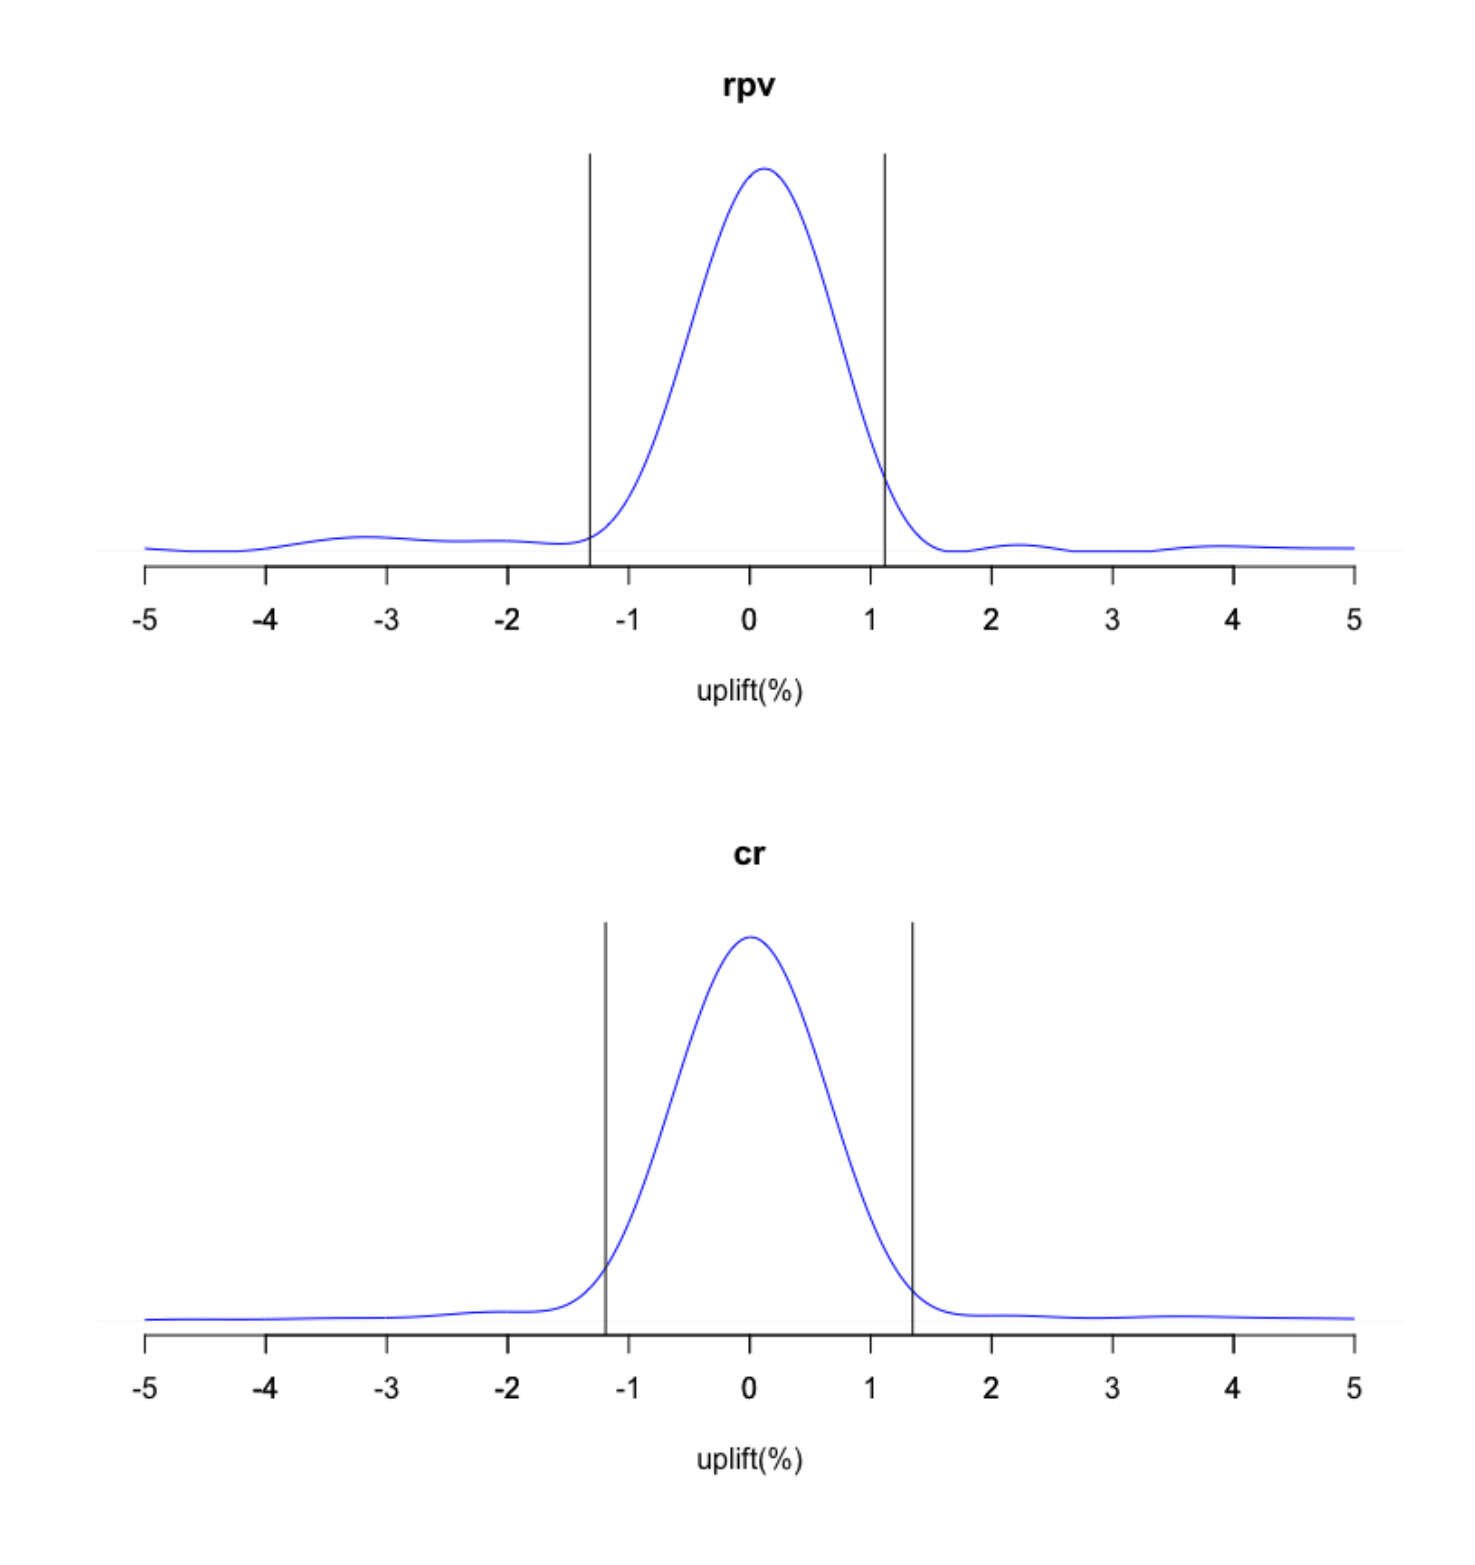
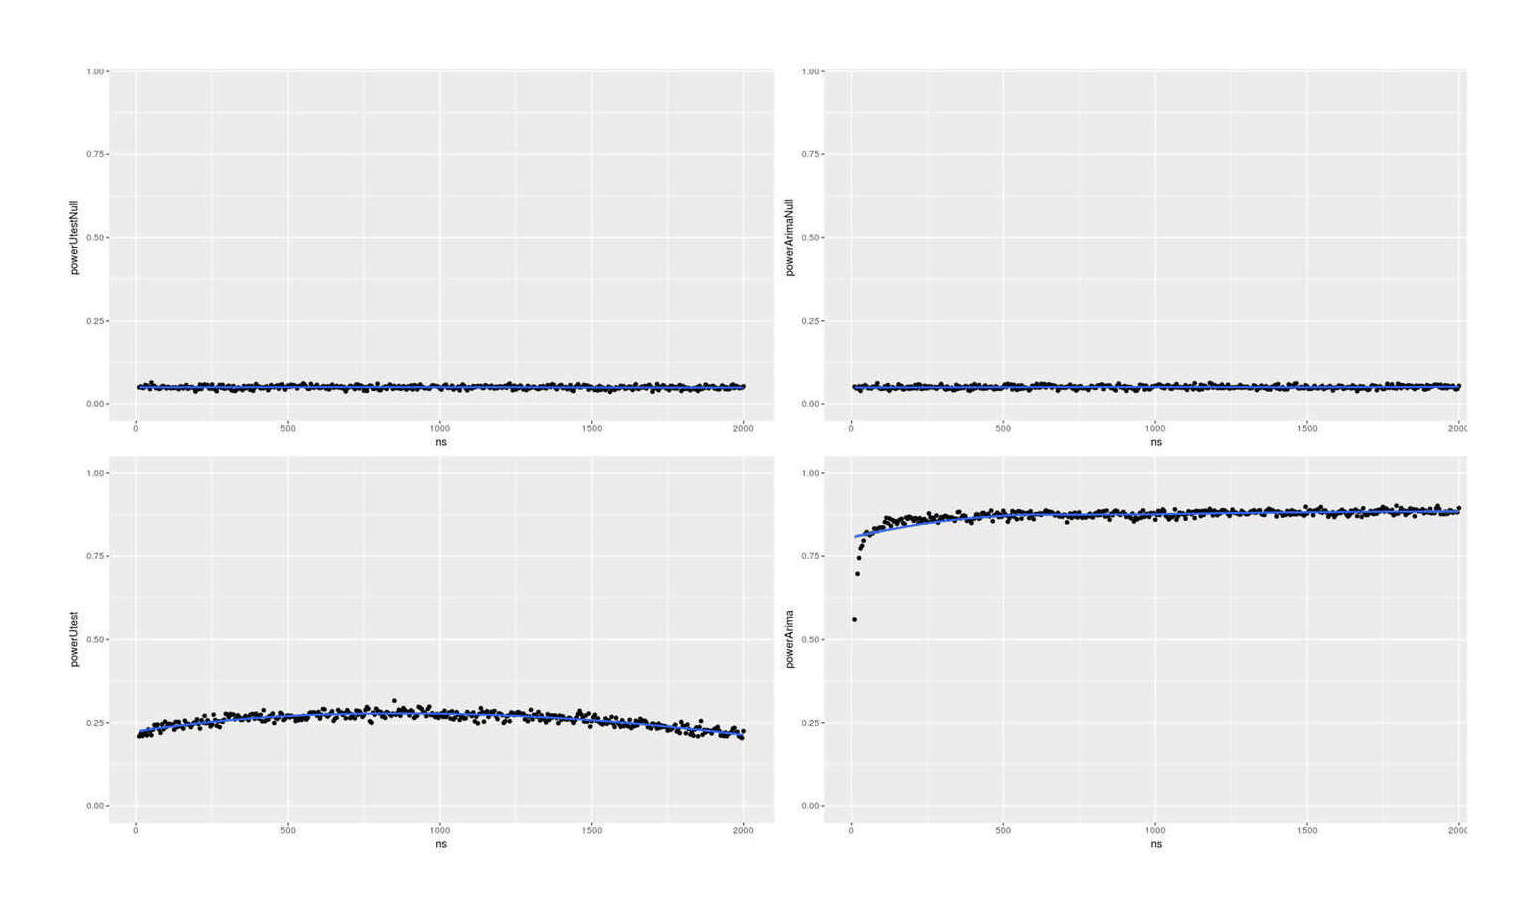
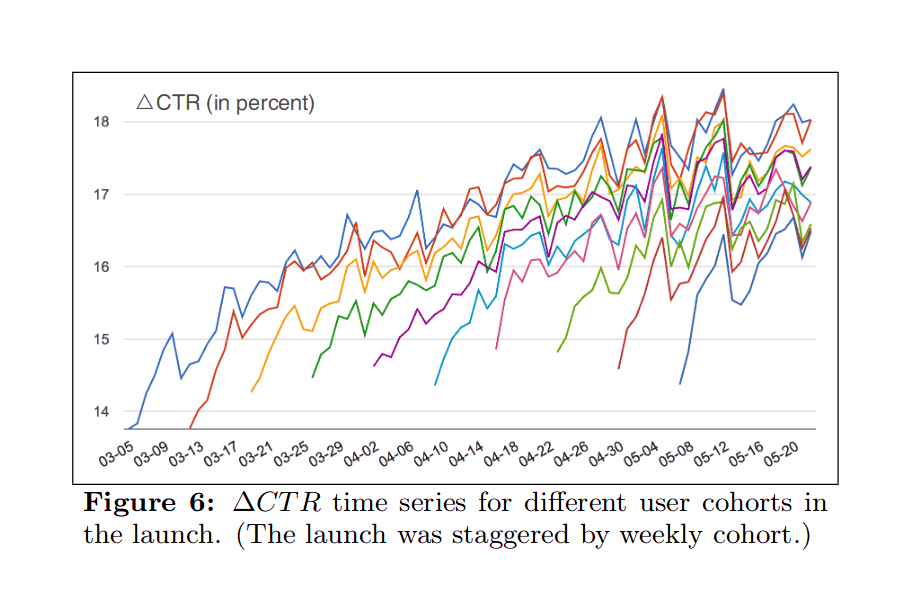
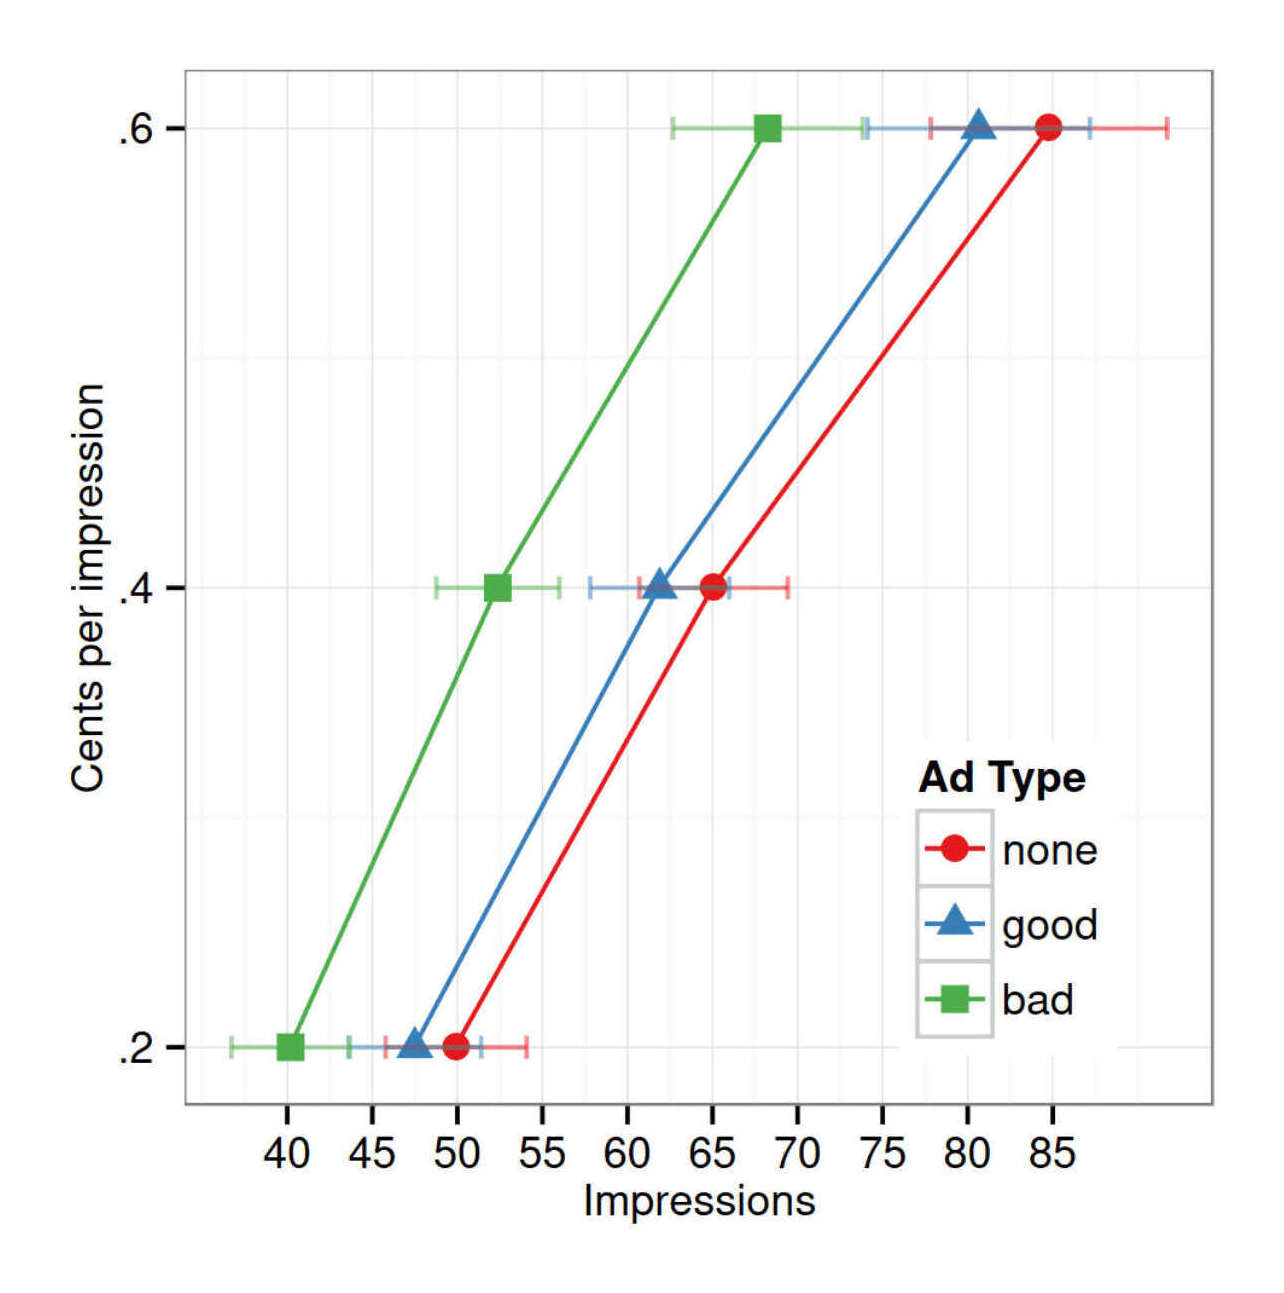
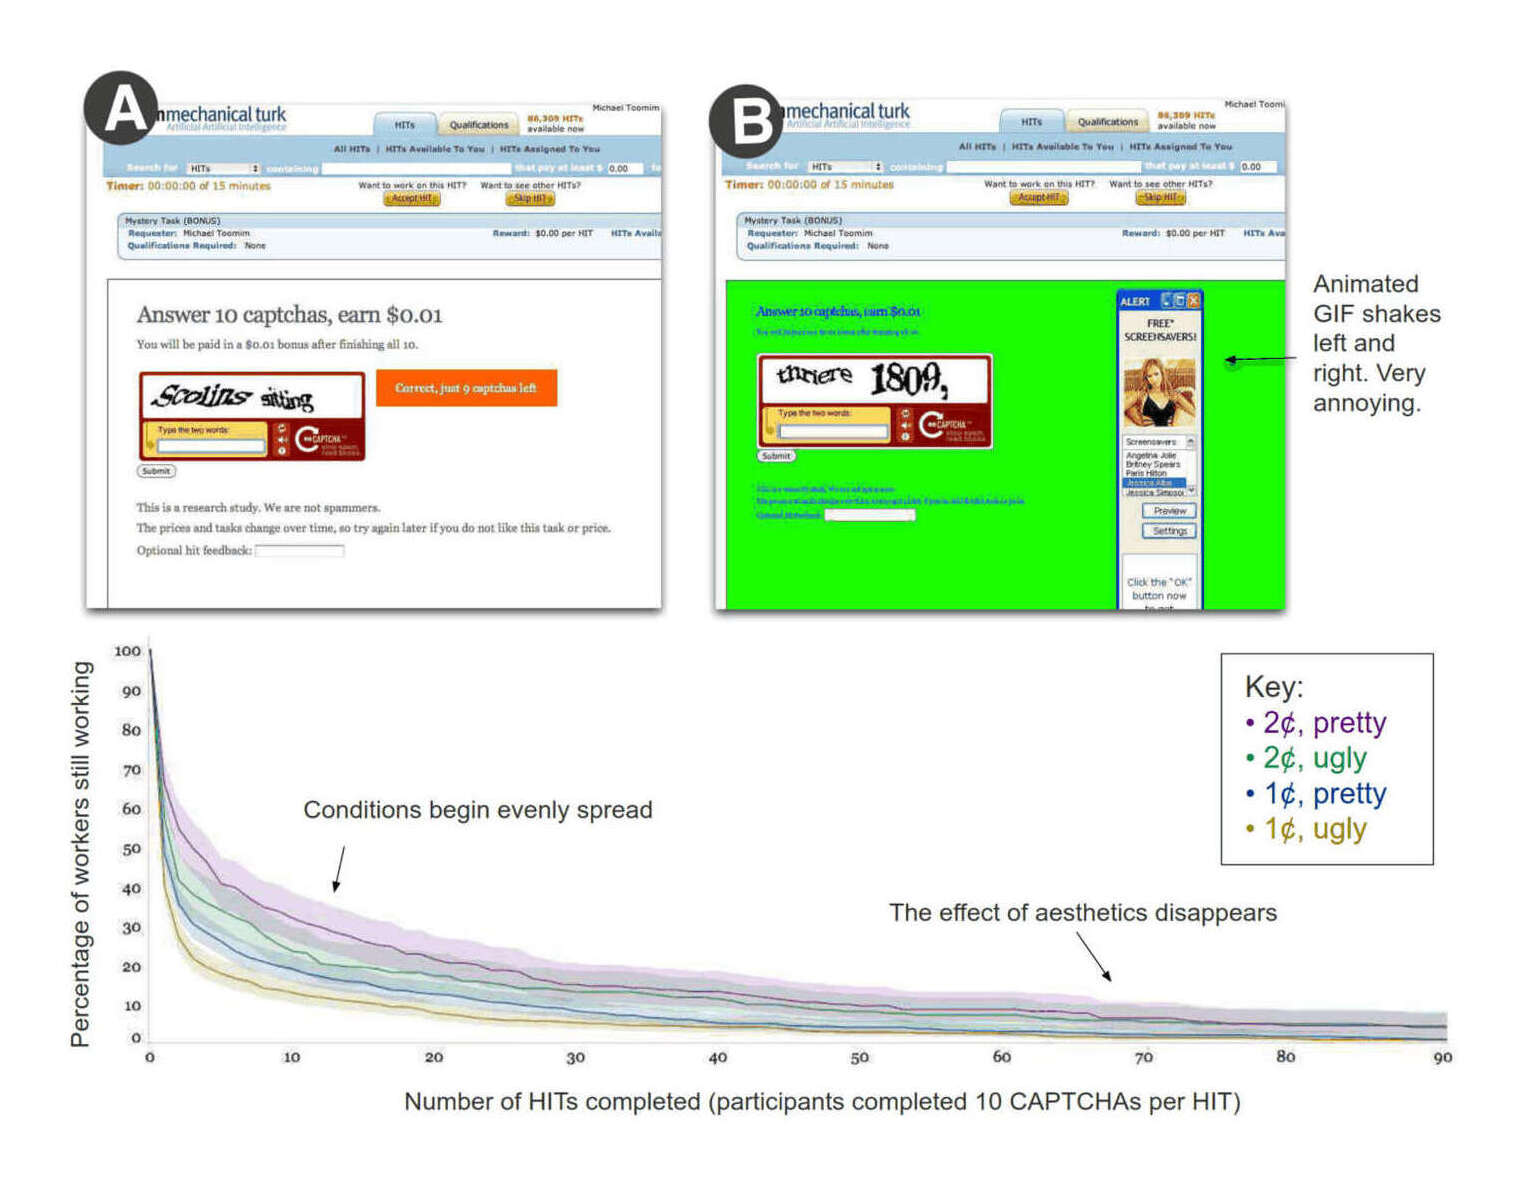
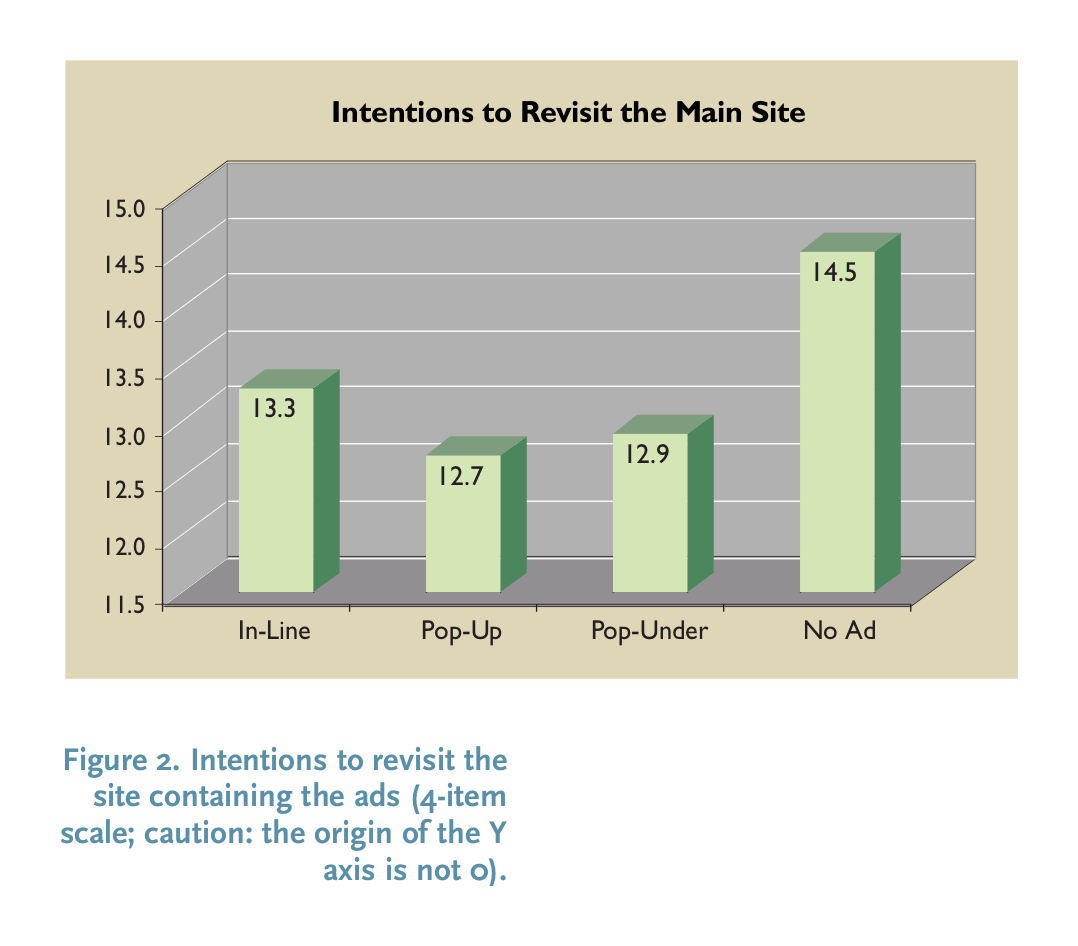
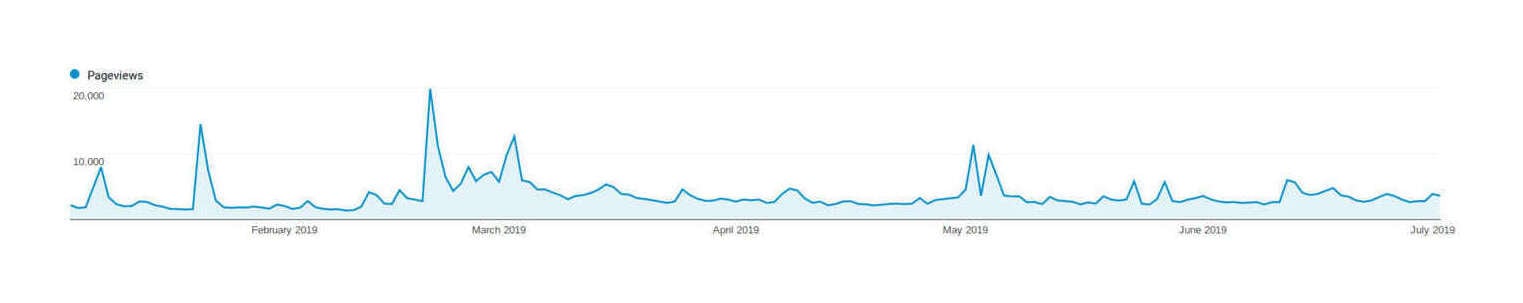