
Dragon Claws/iStock via Getty Images
On Tuesday, August 12, 2025, at 8:30 a.m. Eastern Time, the Bureau of Labor Statistics will release the Consumer Price Index for July 2025. The Trump administration’s firing of the BLS commissioner, however, might overshadow the importance of the report.
Investors should consider putting aside the President’s accusations on the job report for several reasons. The BLS head is not directly involved in the job data collection methodology. Moreover, investors likely expected an increase in healthcare jobs and a decline in government, as analyzed the day before the release. Most importantly, investors and businesses should welcome the data revisions. The BLS reported larger-than-usual May and June revisions totaling 258,000. This is a
“result from additional reports received from businesses and government agencies since the last published estimates and from the recalculation of seasonal factors.”
July Inflation Considerations
The longer the U.S. economy adjusted to existing tariffs, the greater its clarity on price levels. View the latest applicable initial tariffs here, which start at 10%. Inflation did not rise greatly from tariffs for two reasons. First, consumers bought Ford Motor Company (F) vehicles and Apple Inc. (AAPL) iPhones and Macs ahead of tariffs paid by U.S. importers. CEO Tim Cook said that those two products experienced “unusual buying pattern there and that largely occurred in April towards the beginning of the quarter.” This happened largely in the U.S.
Cook did not offer the cost it would absorb in tariffs, which could range from $800 million to $1.1 billion. He is uncertain about what the rates will be, what the supplier inventory levels are, and how the supply chain participants will adjust prices.
Price Increases
June CPI percent changes increased in nearly all categories. Energy, apparel, and transportation reversed their decline from May. Medical care service inflation accelerated, while medical care commodity inflation slowed.
Data from the Bureau of Labor Statistics.
Readers should continue to monitor the increased threat to raise tariffs on pharmaceuticals from 200% to 250%. Fortunately, shares in companies like Merck & Co., Inc. (MRK), Bristol-Myers Squibb Company (BMY), and Pfizer Inc. (PFE) did not react. Pfizer shares rose by nearly 4% after posting strong quarterly results and raising its guidance.
Zooming out on the chart, investor worries persist. In the last month, shares in the three firms had a negative return.

Seeking Alpha
Among the three drug stocks, Bristol-Myers scores an A+ in valuation, growth, and profitability. The weak momentum grade reflects the poor share performance.

Seeking Alpha
Shelter inflation moderated in June. In July, this should come in at between 0.2% and 0.4%. Since it constitutes a big proportion of the overall CPI, low shelter inflation would limit the headline inflation figure. In June, CPI for all items was 2.7%.
Data from the Bureau of Labor Statistics.
Even without the Federal Reserve cutting rates, the 30-year fixed-rate mortgage trended lower in 2025. Lower borrowing rates would lift housing demand.
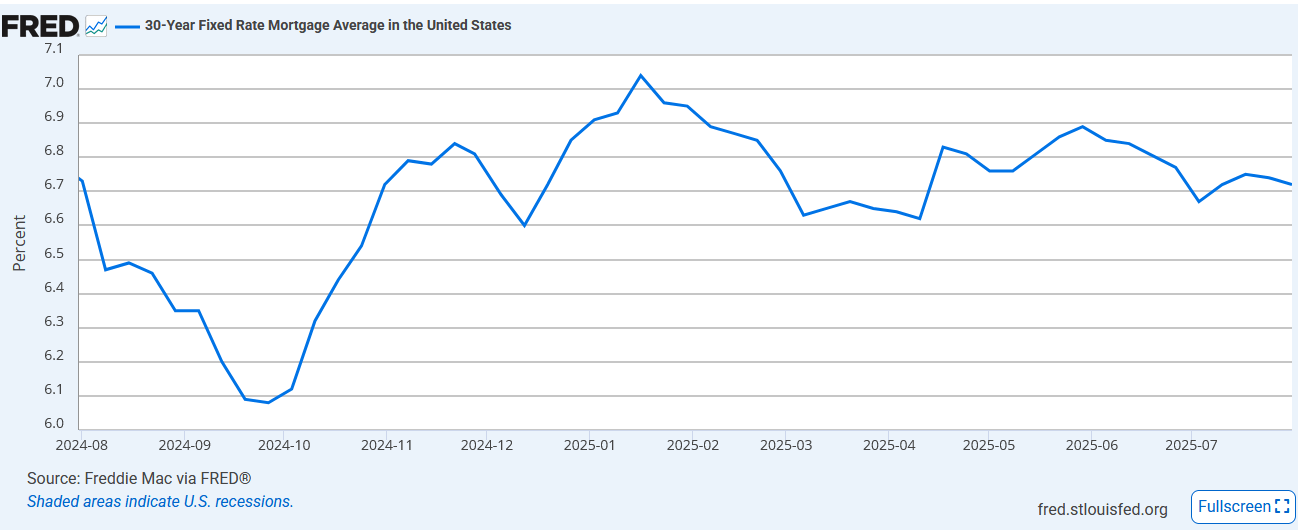
FRED
In the housing sector, D.R. Horton, Inc. (DHI) shares jumped after the firm maintained its homebuilding target. It expects to build between 23,500 to 24,000 homes. It has a strong cash flow to fund a $4.2 billion to $4.4 billion share buyback.
PulteGroup, Inc. (PHM) expects to build 29,000 homes in 2025. Chief Financial Officer James Ossowski said that any impact from tariffs in Q4 will be lower. PHM stock is a compelling holding for investors who want to avoid tariff-related risks.

Seeking Alpha
Above: D.R. Horton has the highest industry rank, while Lennar Corporation (LEN) trails both firms. All three firms score an A- or higher on the profitability grade.
Price Decreases
In July, prices for new and used vehicles should continue to decline. Prices fell in May and June as well.
Lower vehicle prices should help U.S. firms like Ford. The company absorbed $800 million in tariffs in its last quarter. This year, tariffs will cost its shareholders $2 billion. Investors should continue to avoid Stellantis N.V. (STLA), which will incur a EUR1.2 billion (US $1.4 billion) tariff cost.
An accelerated decline in electric vehicle prices might exaggerate the CPI change for auto prices. The rising trade war between the U.S. and China and backlash for CEO Elon Musk with DOGE are hurting Tesla, Inc. (TSLA). Sales fell by 8.4% in July. This contributed to Tesla vehicle prices falling by 8%, albeit based on data from May.
Your Takeaway
Investors face an elevated risk of tariffs showing up in the monthly CPI report. Continue to watch the tariff deals closely. The U.S. and EU deal would have an impact on European vehicle prices. Toyota Motor Corporation (TM) prices are affected by the Asian tariff deal. The U.S. (SP500) and Mexico, iShares MSCI Mexico ETF (EWW) are agreeing to extend the USMCA agreement which delays inflation for auto parts/accessories.
A higher CPI would not likely hurt indices like the iShares Russell 2000 ETF (NYSEARCA:IWM) or the NASDAQ 100-Index (NDX). It raises the odds for the Fed to lower interest rates next month. Before that happens, the market might get insight into Fed policy after its Jackson Hole Policy Symposium. This event is scheduled for August 21-23.
Please Follow me for coverage on deeply discounted stocks. To dive deeper beyond the ideas in this article, get do-it-yourself tips and tricks by clicking on the blue button beside my name. Subscribe to the DIY Value Investing Free Or Full Level to get alerts separate from the alerts you normally get when following me.
Join the full service to unlock access to top core, income, and community-curated stock models, live online chat, and actionable stock alerts.