


Fifth National Climate Assessment
32. Mitigation

Mitigation Goals
To achieve the Paris Agreement (an international treaty on climate change) goal of limiting global warming to well below 2°C above preindustrial levels and pursuing efforts to limit global warming to 1.5°C above preindustrial levels, global CO2 emissions need to reach net zero around 2050 and remain net zero or net negative afterward.2 Thus, US CO2 emissions reaching net zero around midcentury would be consistent with Paris goals, although a wide range of trajectories is possible based on considerations of international equity, burden-sharing, costs, and policy assumptions.3,4,5 This chapter addresses pathways and options for mitigation of US emissions from all sectors consistent with national and international climate goals.
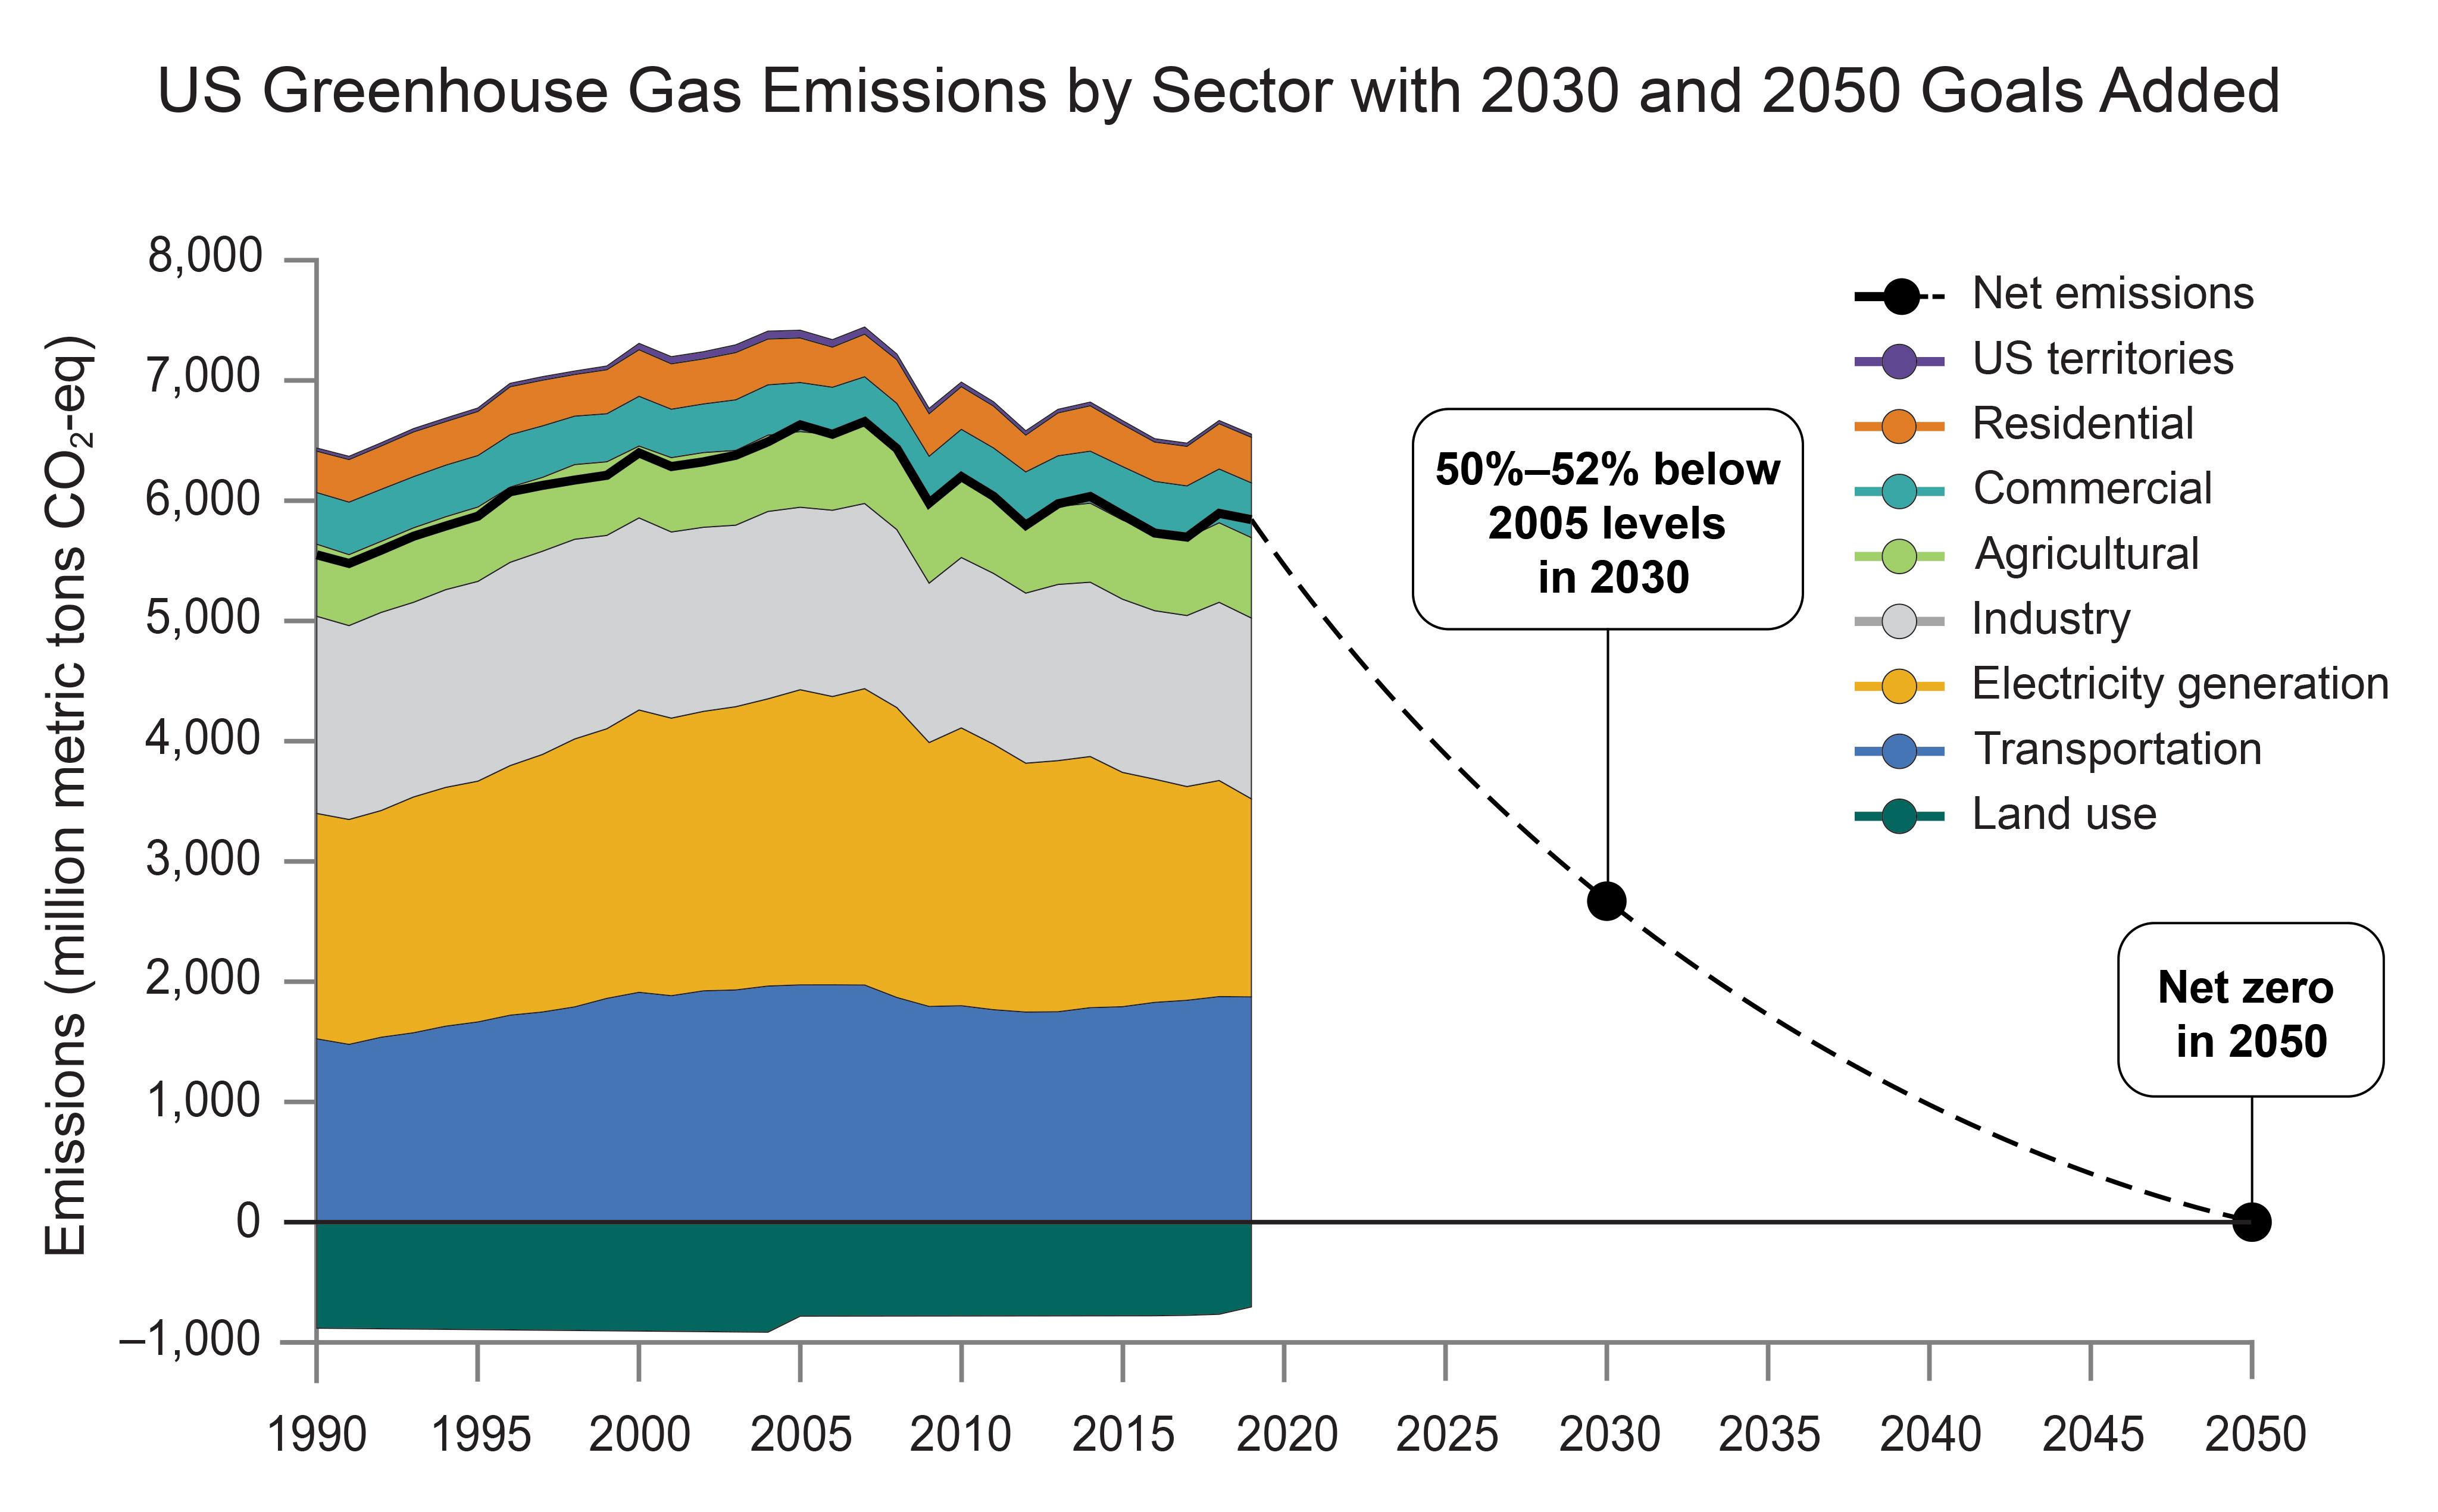
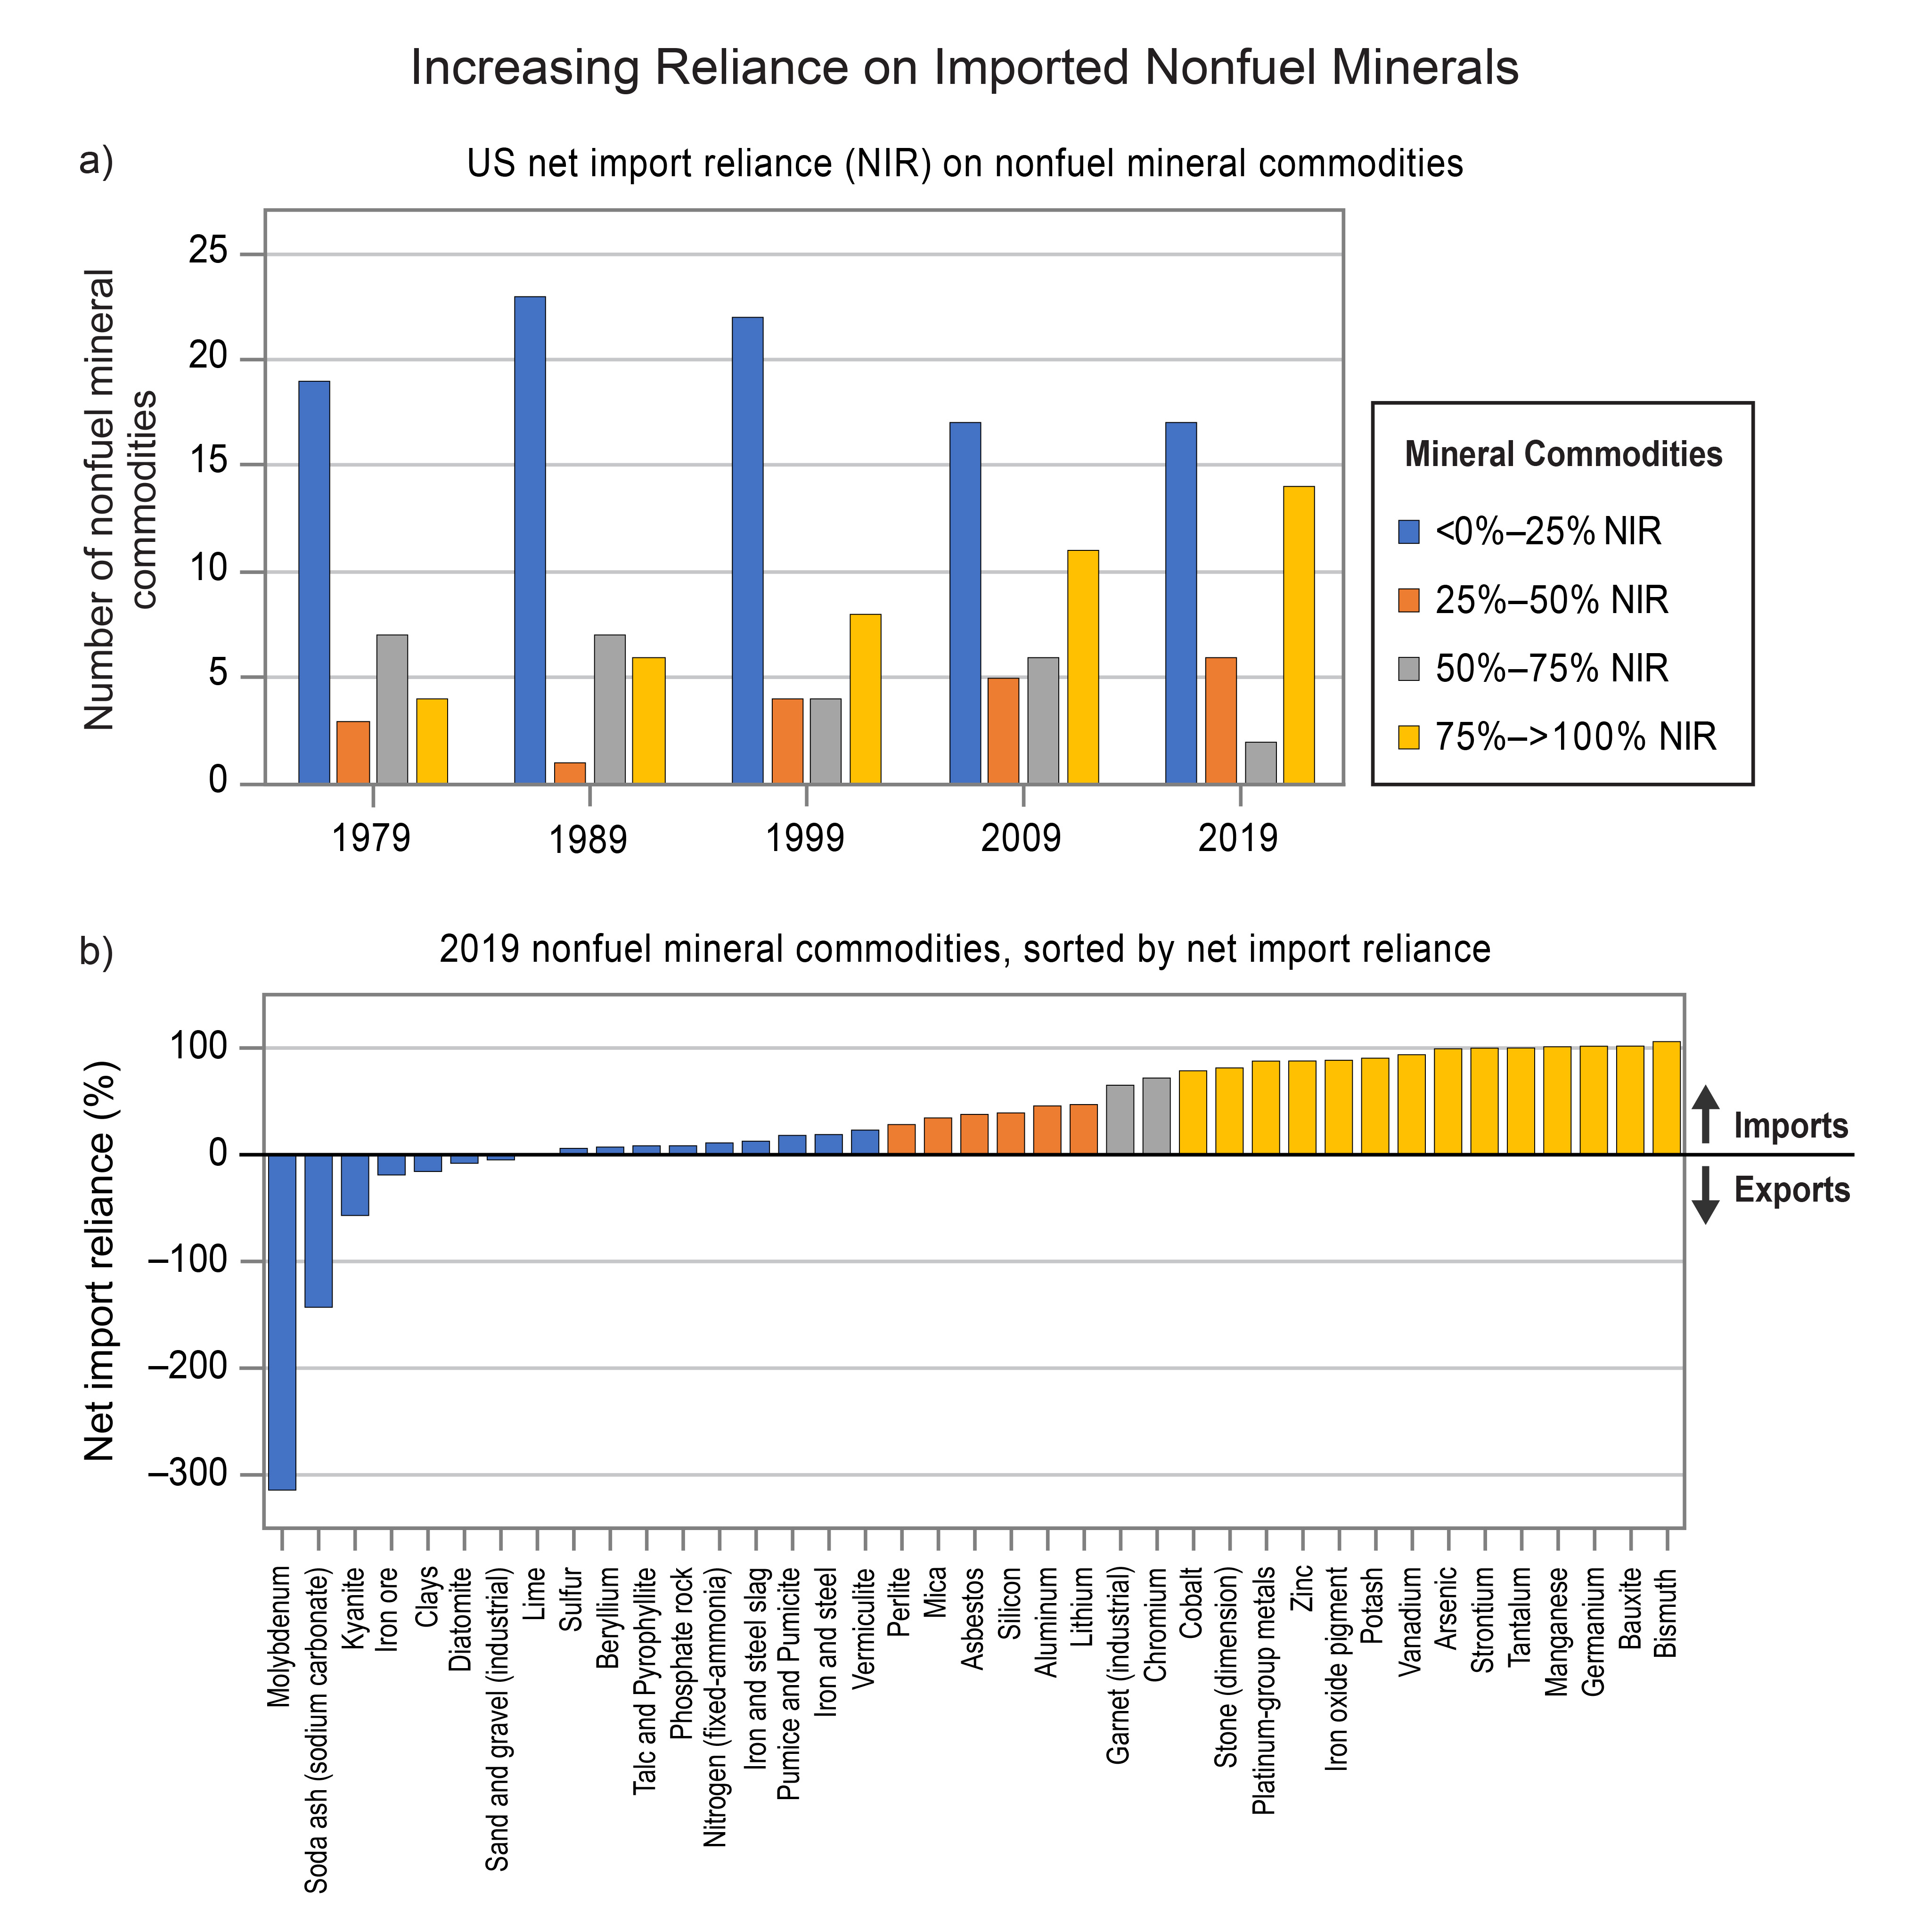
As part of the Paris Agreement, countries communicate nationally determined contributions (NDCs)—emissions-reduction targets that they intend to achieve. The latest NDC communicated by the United States to the United Nations Framework Convention on Climate Change (UNFCCC) Secretariat sets an economy-wide target of reducing all its net GHG emissions (not only CO2) by 50%–52% below 2005 levels in 2030, or roughly –6% per year beginning in 2022, putting the country on a path to achieve the goal of reaching net-zero GHG emissions by no later than 2050 (Figure 32.1).7 In addition, 24 states and Washington, DC, have their own reduction targets (KM 32.5).
Major Trends
Between 1990 and 2019, US CO2 and nitrous oxide (N2O) emissions increased by approximately 3% in each case. Emissions of fluorinated gases increased by 86%, and methane (CH4) emissions decreased by 15%.8 Although the latest EPA inventory reports emissions through 2021,9 this chapter focuses on trends in emissions to 2019 because the COVID-19 pandemic caused substantial but largely temporary changes in energy-related emissions worldwide (see, e.g., Davis et al. 2022; Liu et al. 202010,11). The EPA estimates that US carbon dioxide equivalent (CO2-eq) GHG emissions were about 6.6 billion metric tons (or gigatons; Gt) in 2019, 2% more than in 1990.8,12 The sources of these emissions are primarily electricity generation, transportation, and combustion of fuels in other sectors (i.e., commercial, residential, and industrial), with smaller contributions from agriculture, industrial processes, and waste (Figure 32.1). Major sinks were land-use change and especially forests, which resulted in net uptake of 0.7 Gt of CO2 in 2019. Net GHG emissions from all sources and sinks were thus 5.8 Gt of CO2-eq in 2019.8,9,12
Between 2005 and 2019, US GHG emissions decreased by 12%, mainly because of reductions in electricity generation emissions. Indeed, since 2017, the largest share of GHG emissions has come from the transportation sector (Figure 32.1). Estimates include emissions occurring within all US territories, as annually reported to the UNFCCC Secretariat by the EPA. Independent estimates by other scientific bodies and researchers are similar but not identical.13,14,15,16
Sector-Specific Trends and Drivers
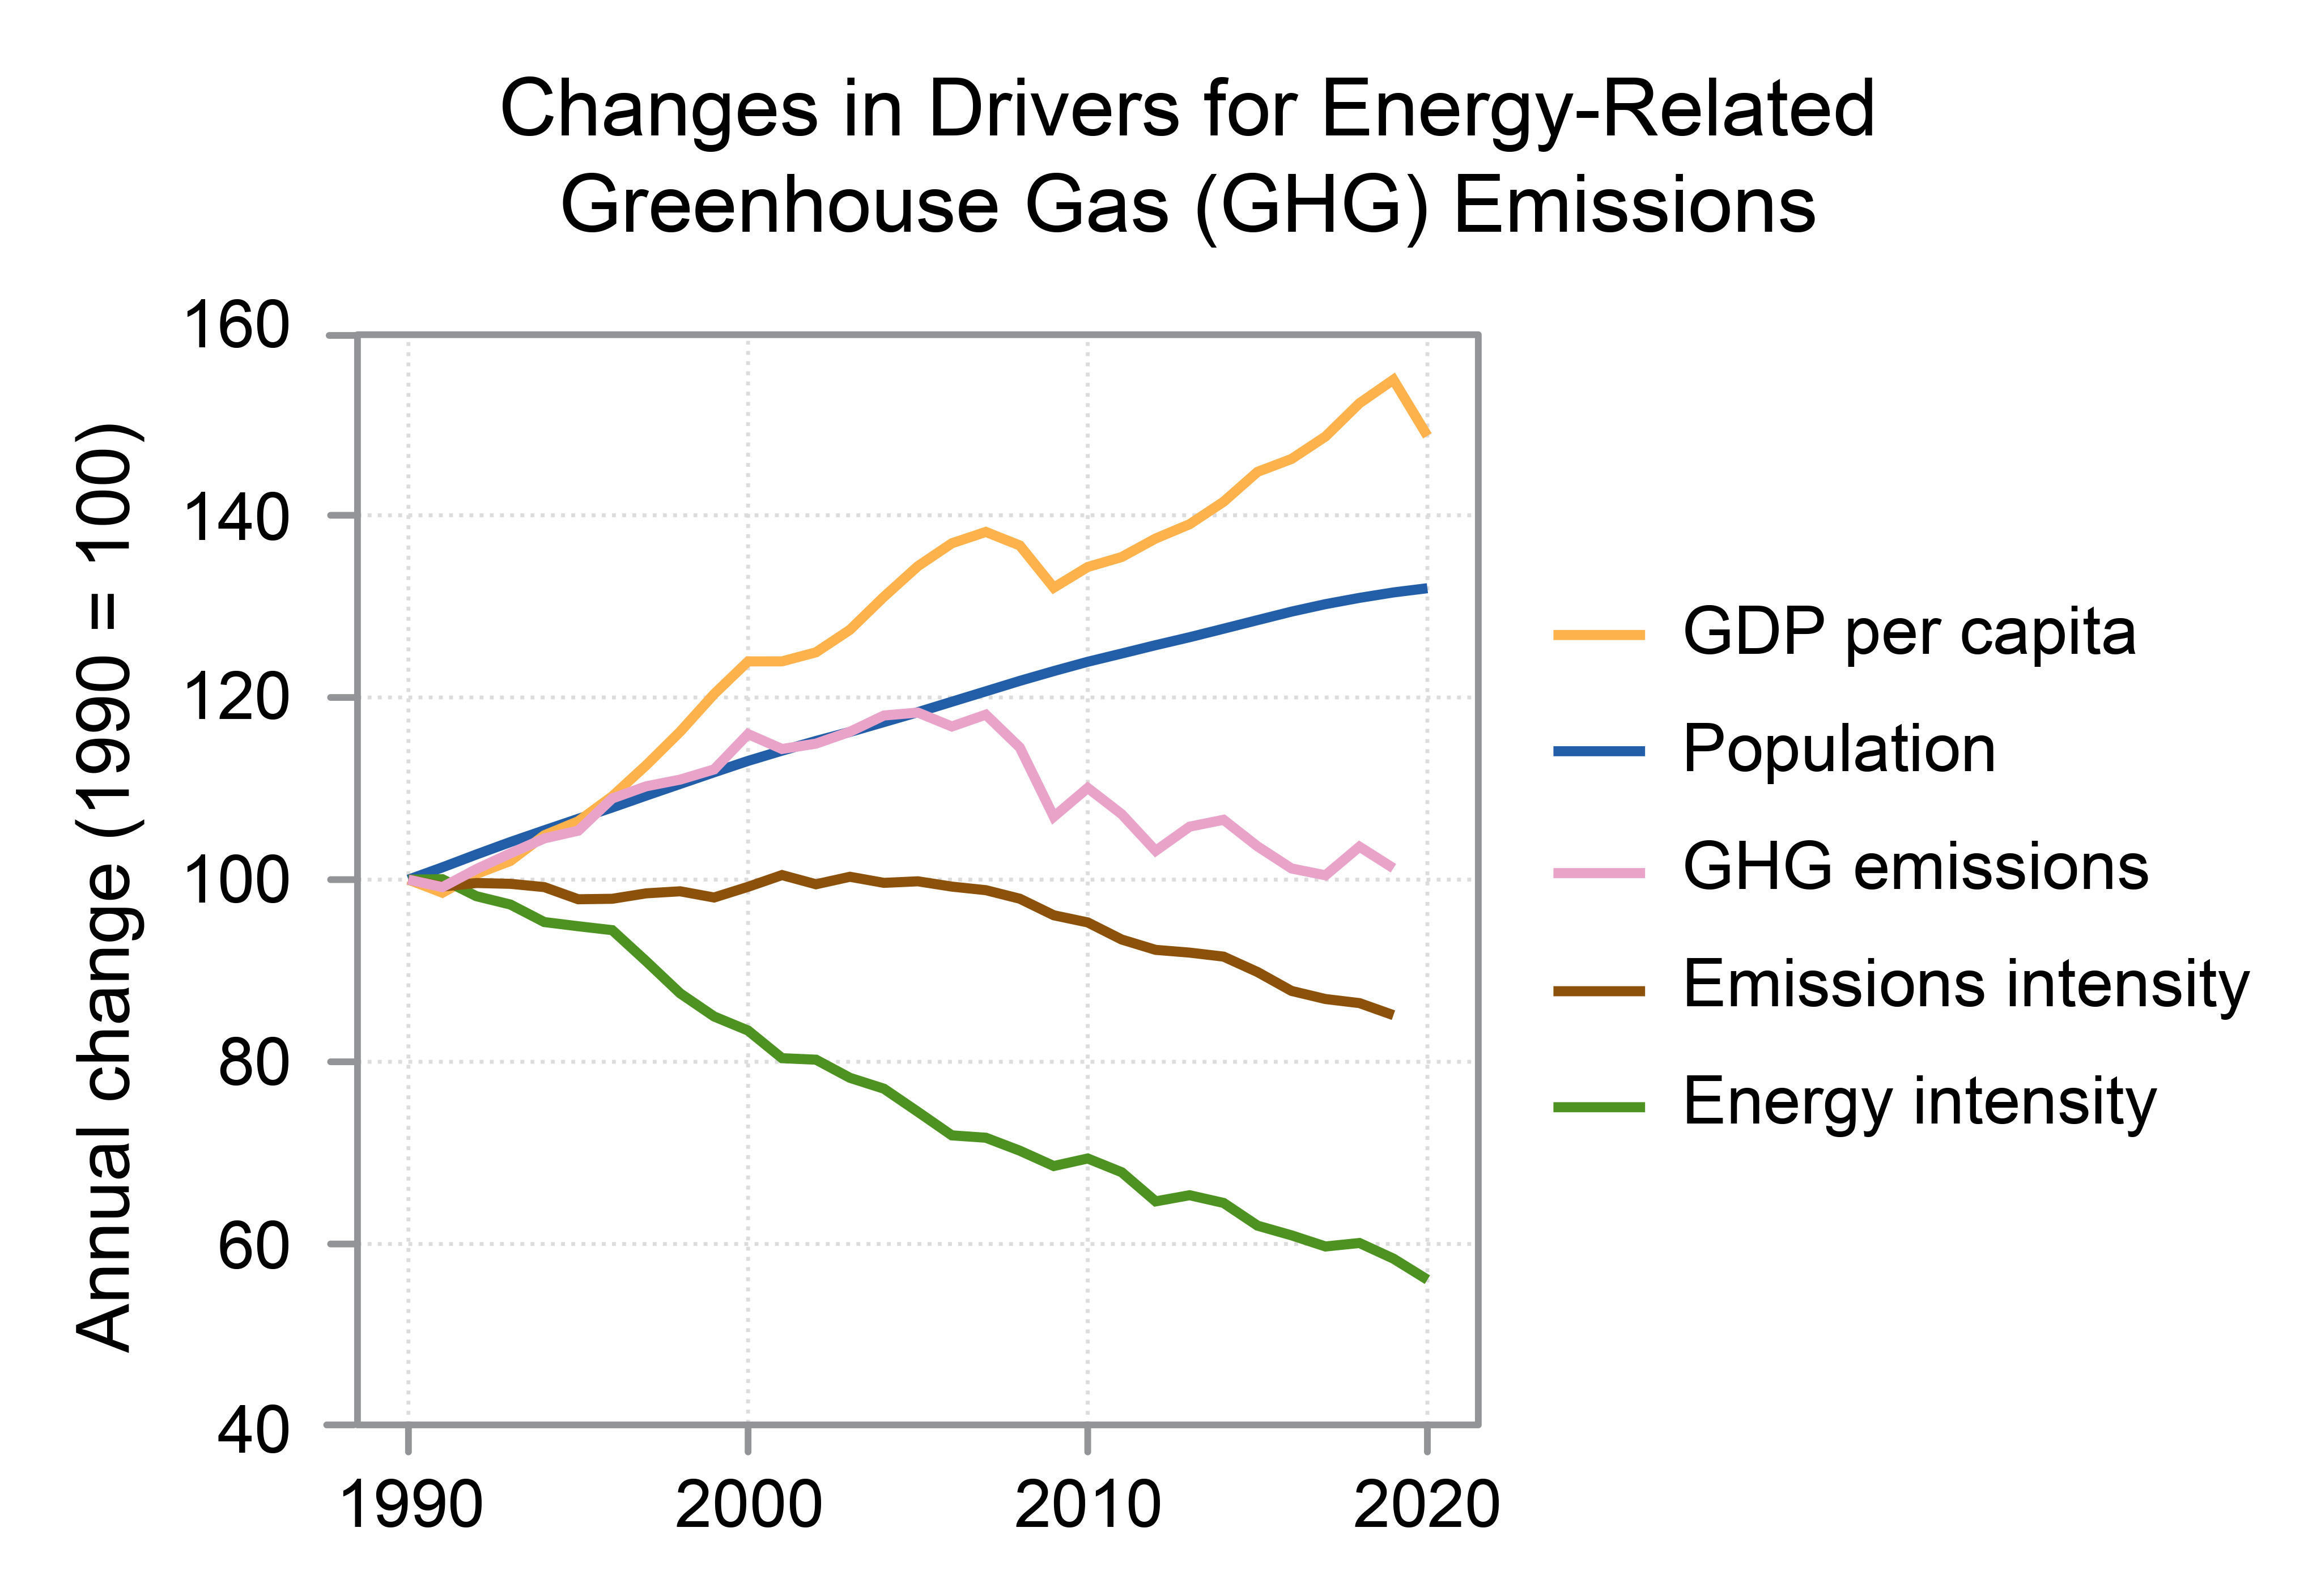
Between 1990 and 2019, economic and population growth have acted to increase US energy-related emissions but have been counterbalanced by reductions in both the energy used per dollar of GDP (or “energy intensity of economic activity”) and the CO2 emissions per unit of energy used (or “emissions intensity of energy”).17 In particular, decreases in energy emissions since 2007 were driven by a steady and substantial fall in CO2 emissions per unit of energy consumed from a maximum of 59 million metric tons (megatons; Mt) of CO2 per exajoule (1018 joules) of energy consumed in 2007 to 51 Mt per exajoule in 2019 (Figure 32.2).
Electricity Sector Emissions
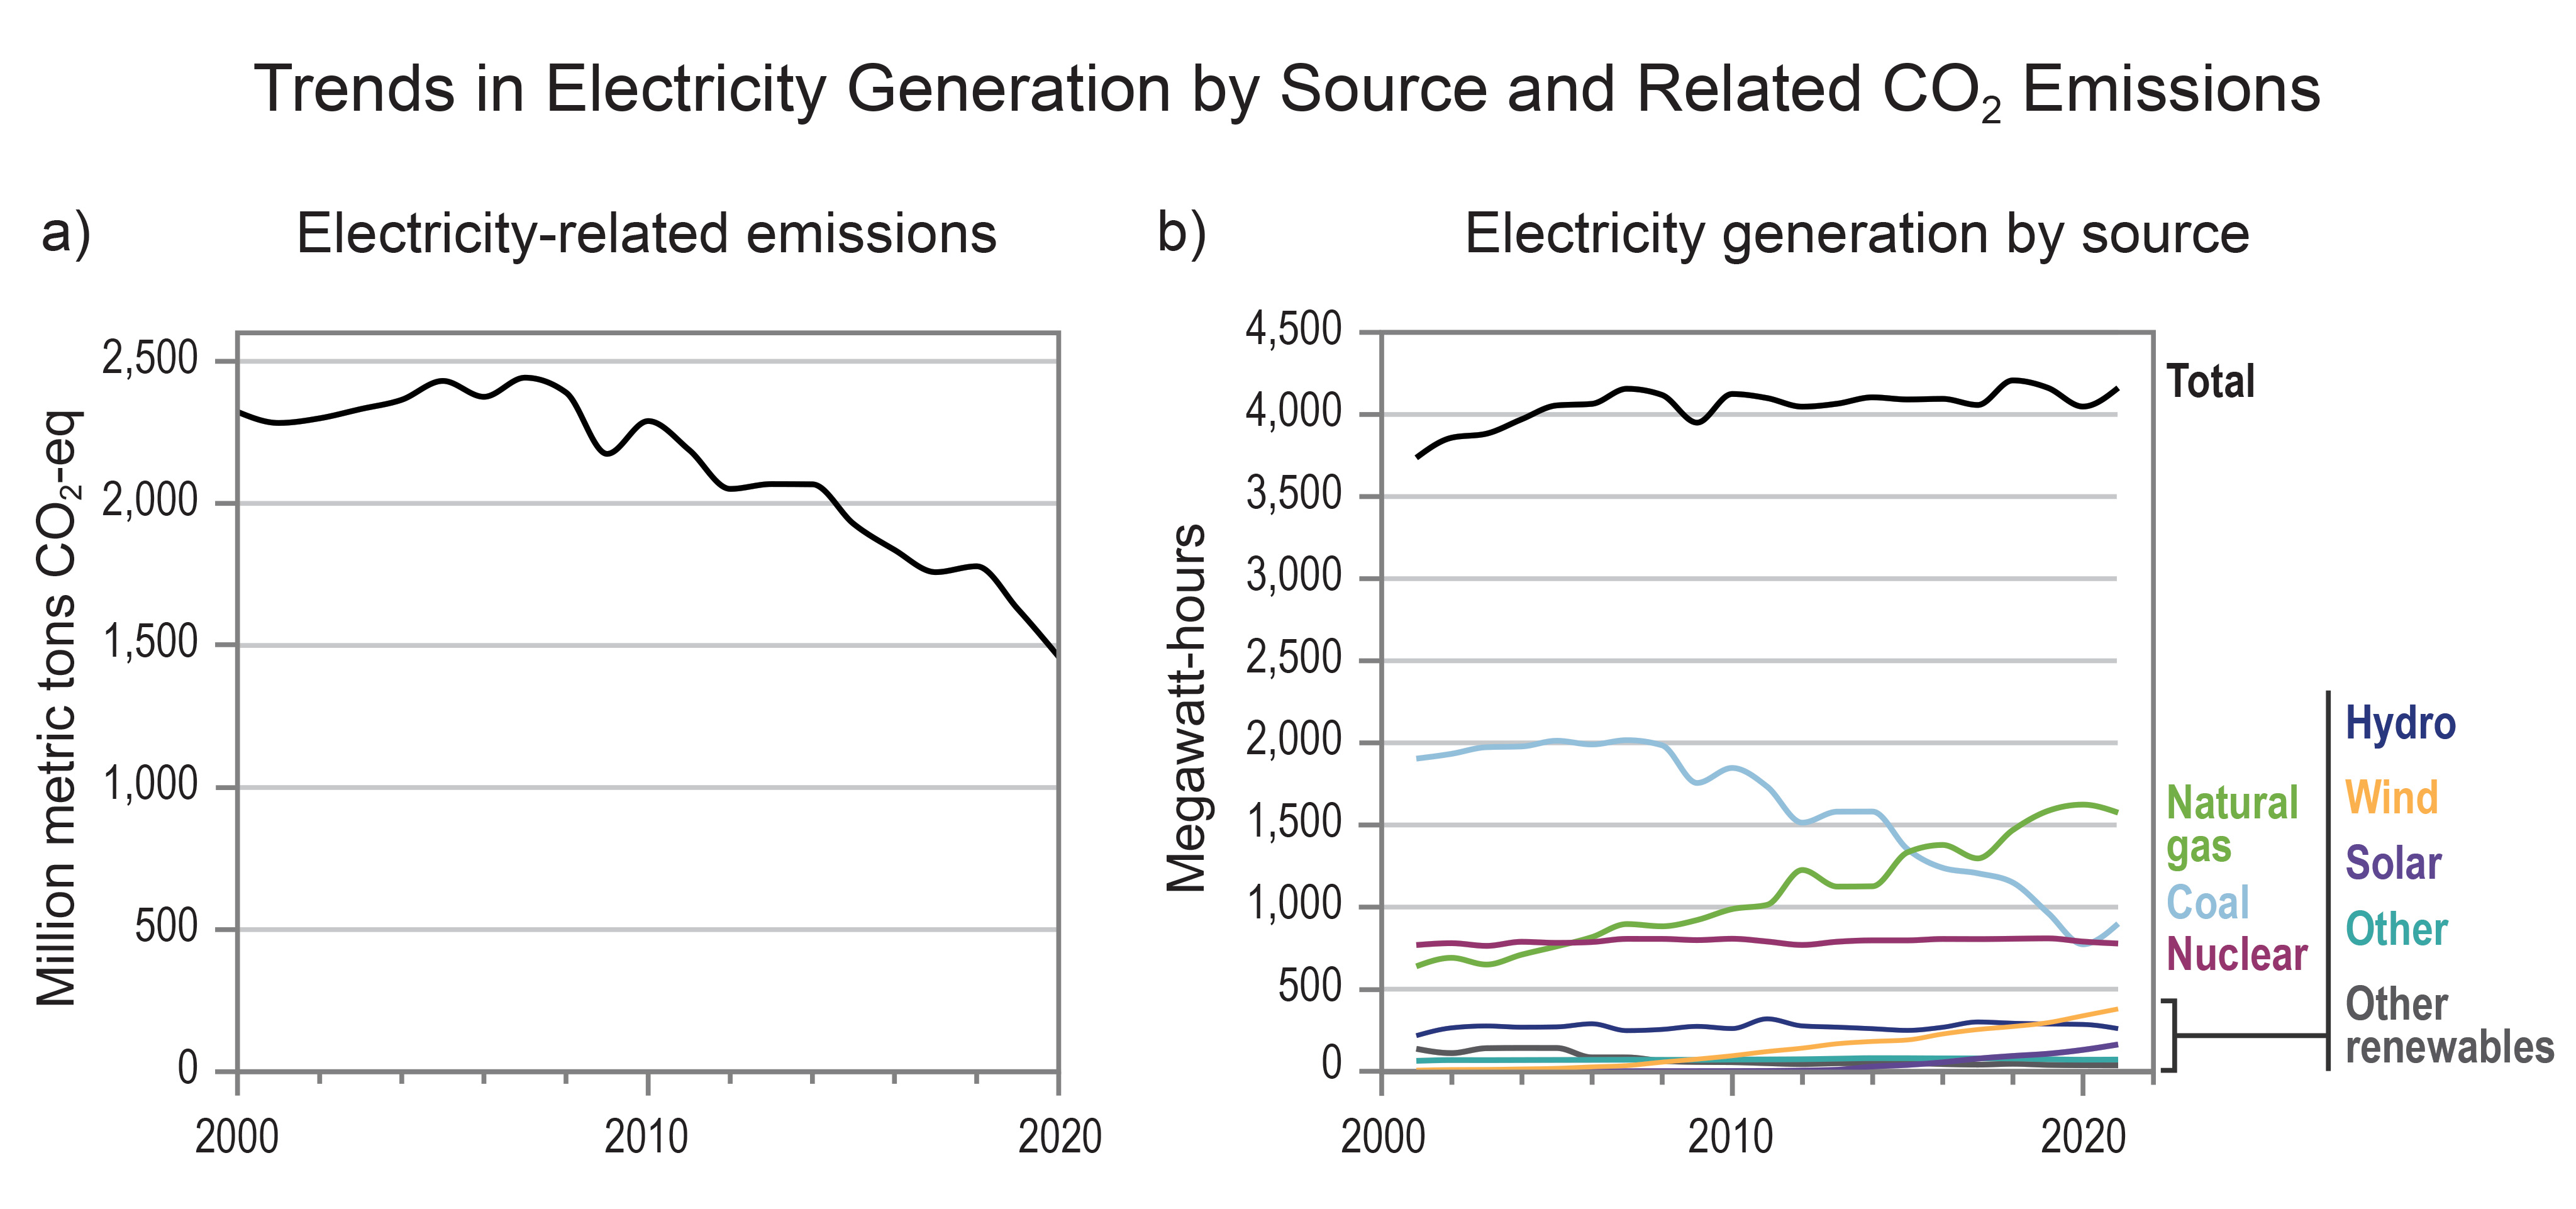
GHG emissions from the electricity sector in 2019 were 1,629 Mt of CO2-eq, or 30% of energy-related emissions.8 Decreases in US energy-related emissions since 2007 mostly reflect changes in the electricity sector, especially the retirement and reduced use of coal-fired power plants and corresponding increases in lower-cost electricity from natural gas–fired power plants (and to a lesser extent renewable technologies; Figure 32.3b). US emissions from electricity generation in 2019 were roughly 40% below 2005 levels (Figure 32.3a).
Transportation Sector Emissions
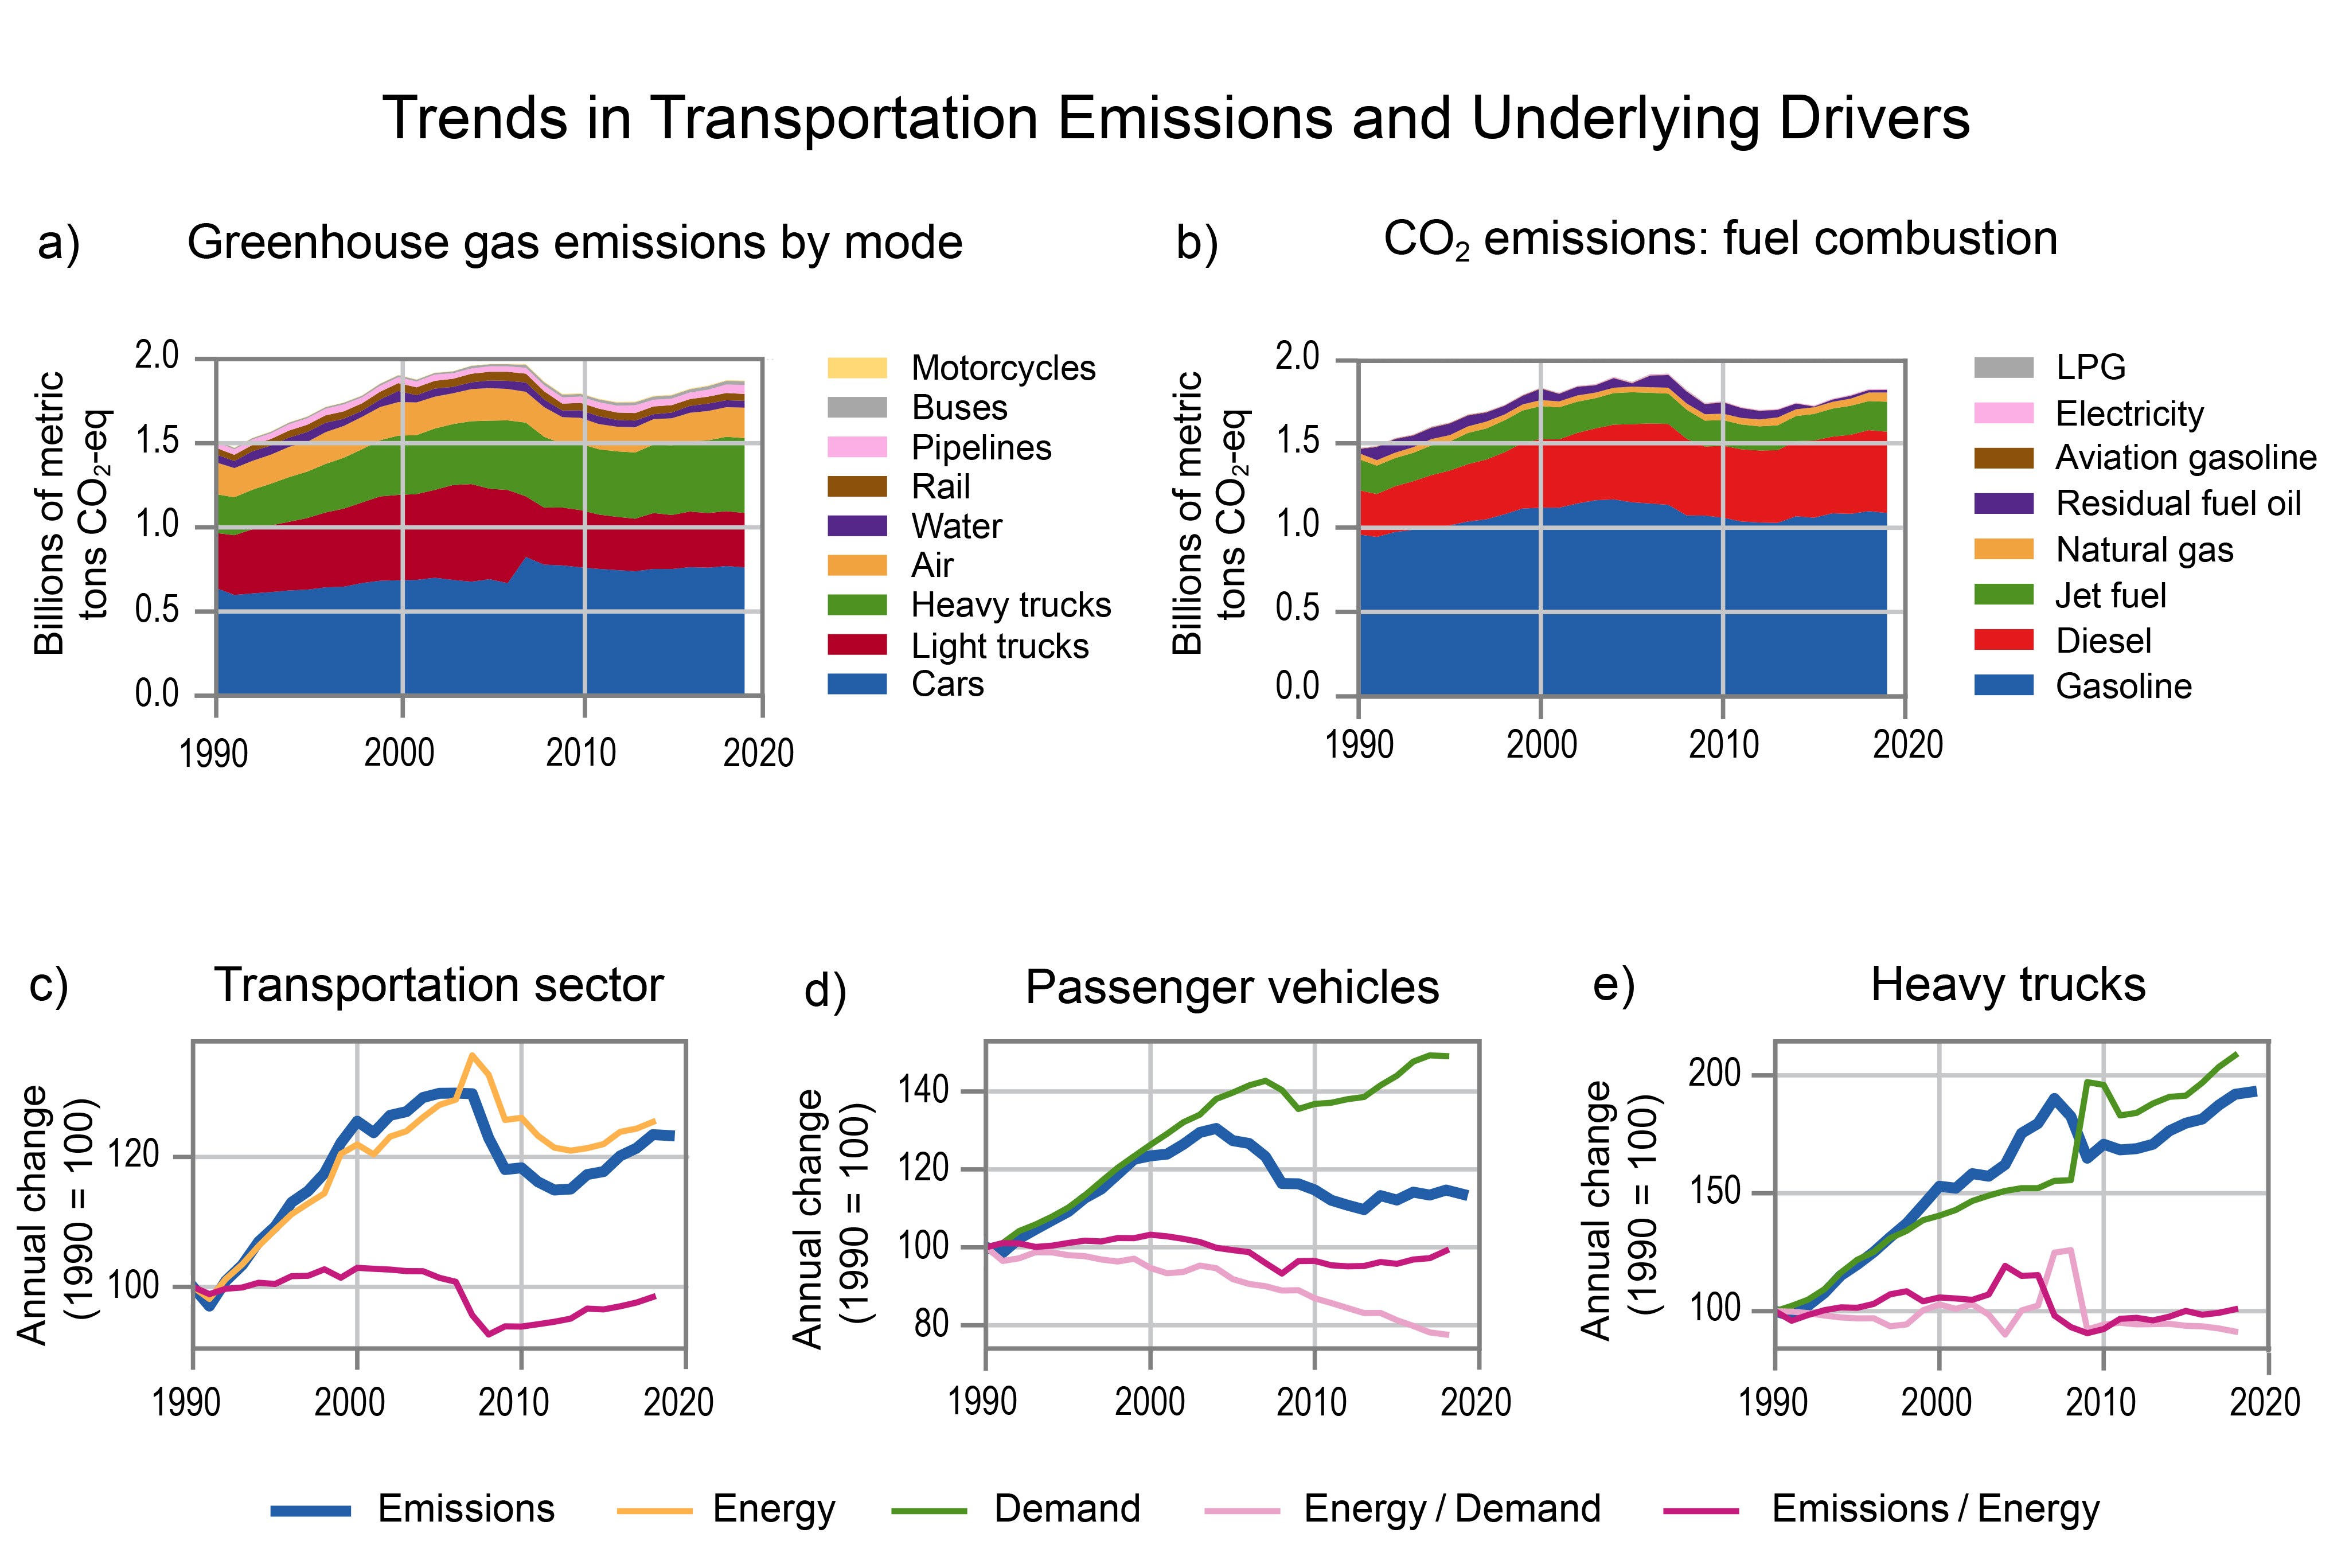
GHG emissions from the transportation sector in 2019 were 1,874 Mt of CO2-eq.8 Most transportation emissions are CO2 emissions from combustion of gasoline (59.6%, mostly for light trucks and cars), diesel (26.4%, mostly for heavy trucks, buses, and trains), and jet fuel (9.8%; Figure 32.4). In contrast to electricity sector emissions, transportation emissions increased by 23% between 1990 and 2018, largely reflecting 49% growth in demand for passenger vehicle transport over the period (measured in passenger-kilometers, or the distance traveled in km multiplied by the number of passengers), which was partially offset by a 22% decrease in energy required per passenger-kilometer. Over the same 1990–2018 time period, demand for heavy trucks (measured in vehicle-kilometer, or the total distance traveled by the truck fleet) more than doubled, and improvements in energy per vehicle-kilometer were more modest (an 8.6% decrease in energy required per vehicle-kilometer).
Residential- and Commercial-Building Sector Emissions
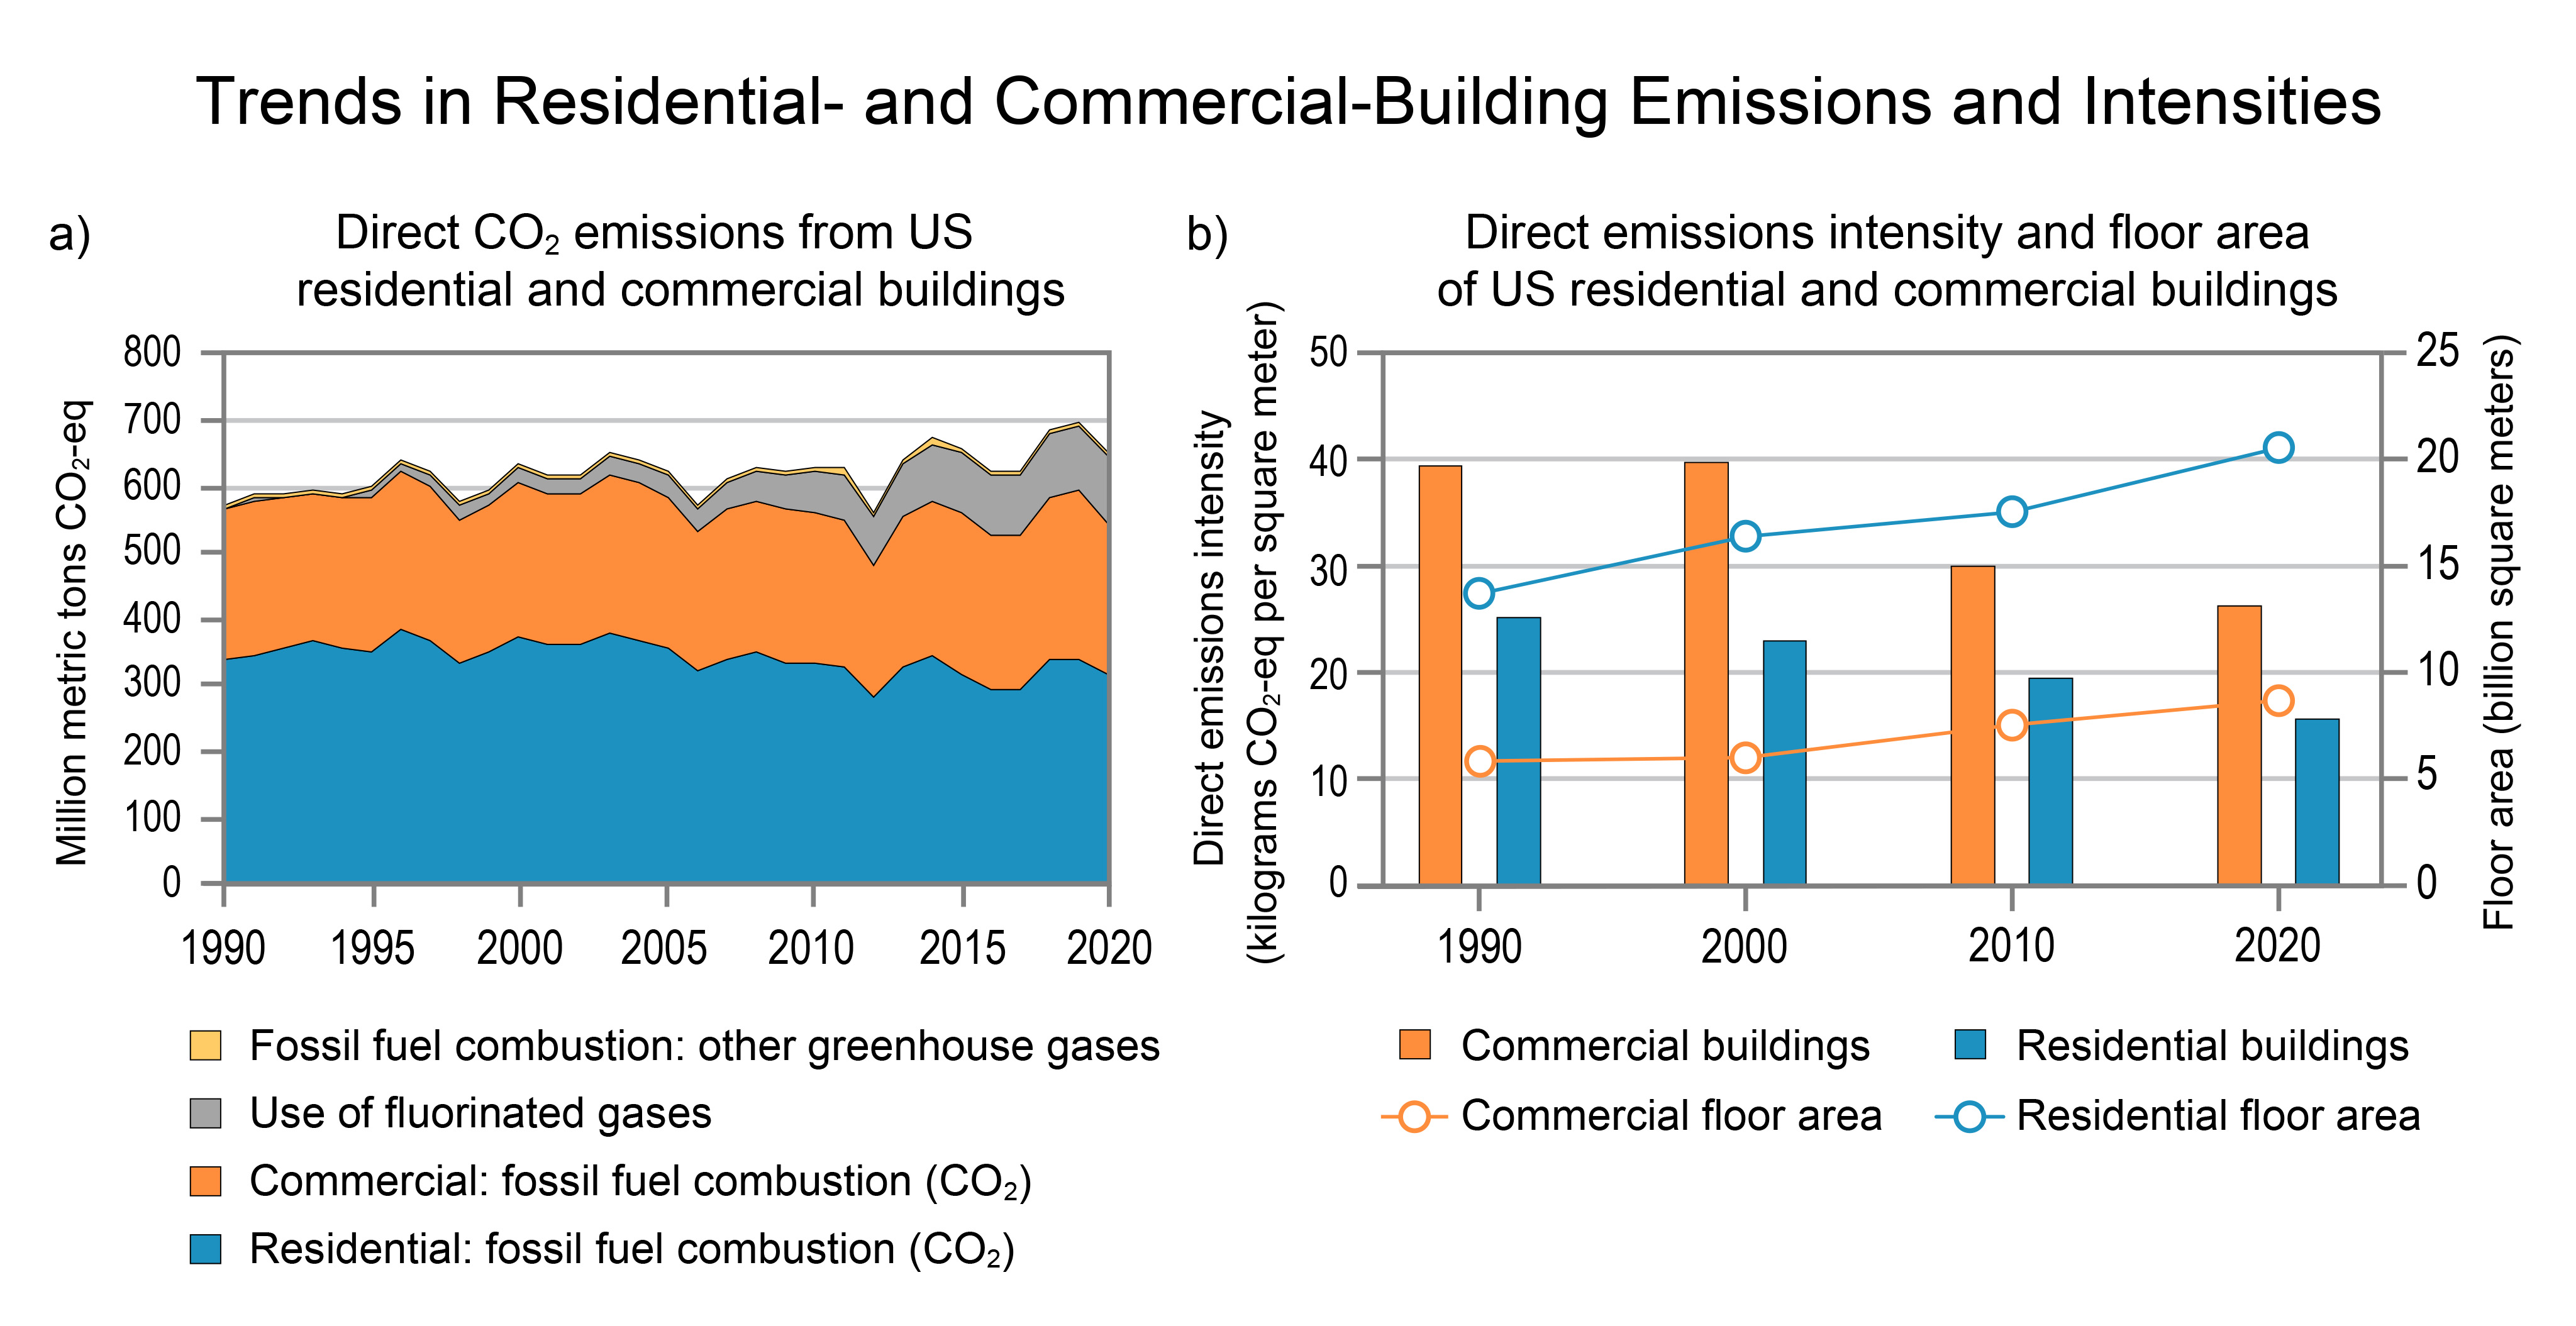
Direct GHG emissions from residential and commercial buildings were 699 Mt CO2-eq in 2019. Since 1990, direct emissions from US residential and commercial buildings (i.e., excluding electricity) have risen by roughly 14% (Figure 32.5). The increase is primarily related to steady growth of fugitive emissions of fluorinated gases from building cooling systems.9 Over the same period, energy efficiency improvements and increasing electrification have kept flat direct CO2 emissions from onsite fuel combustion despite 50% increases in both residential and commercial building floor area (Figure 32.5).19,20
Industrial Sector Emissions
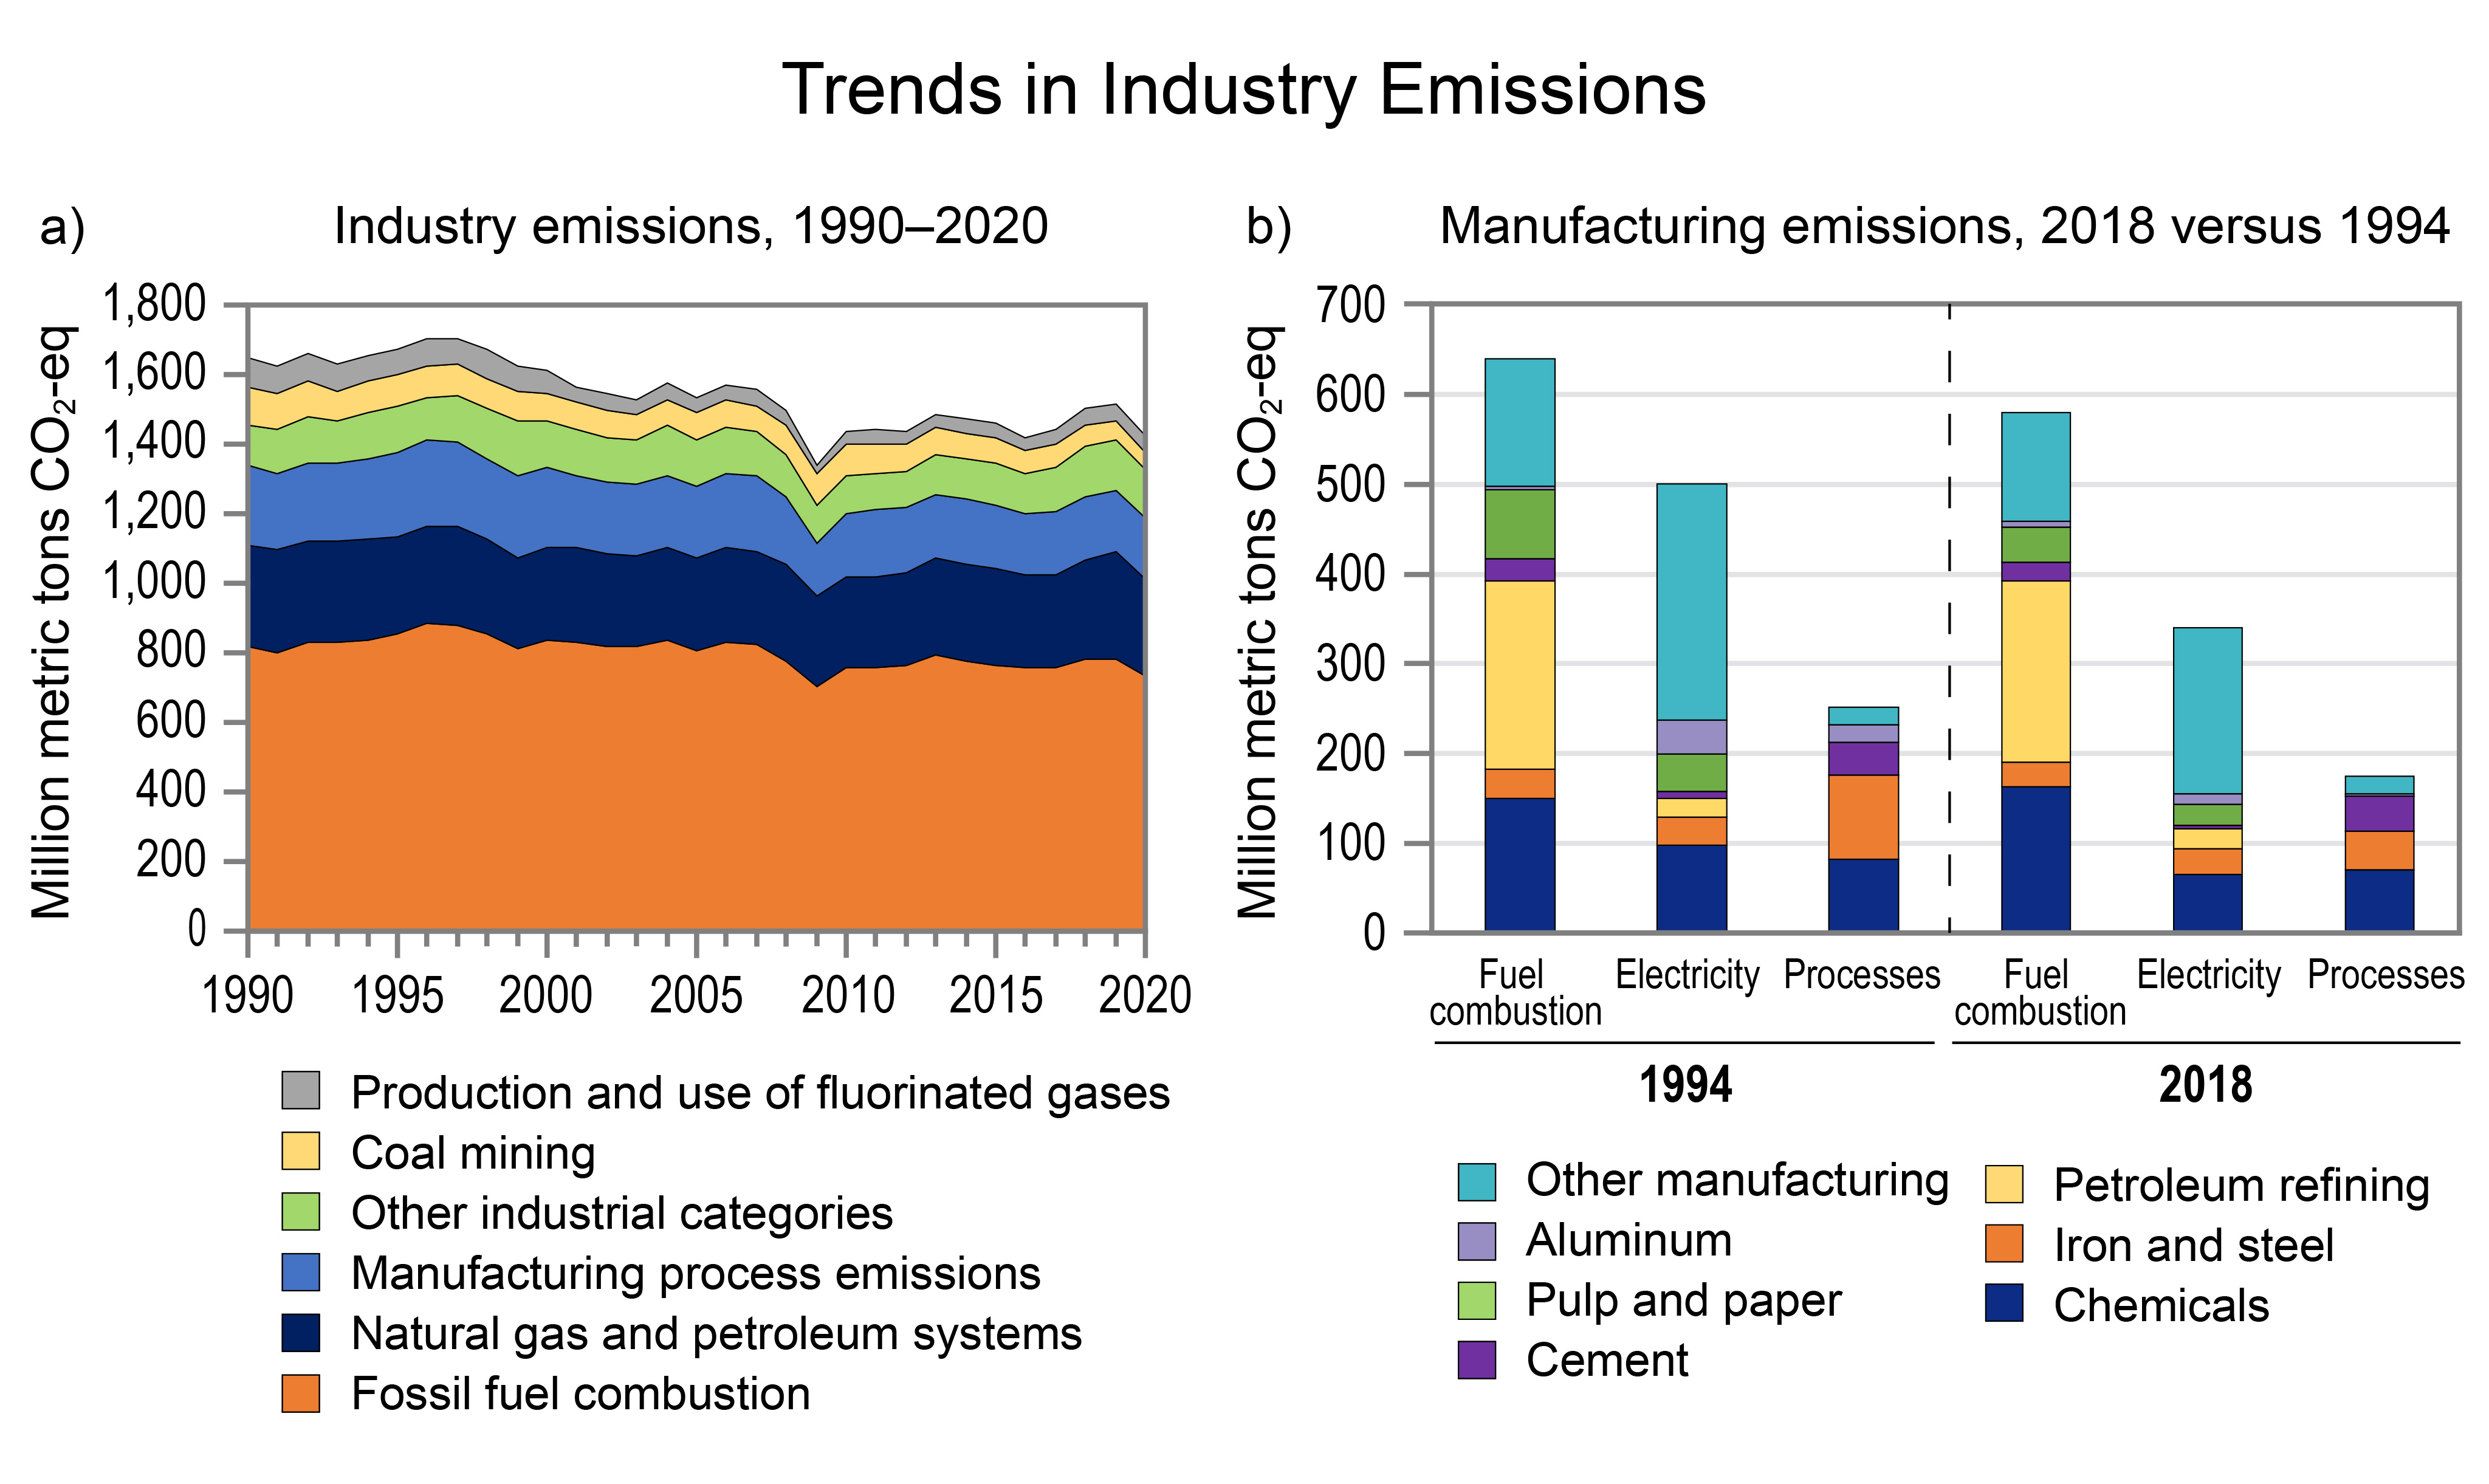
GHG emissions from the industrial sector were 1,568 Mt of CO2-eq in 2019.9 Direct emissions from the industrial sector, including onsite fuel combustion as well as all process and fugitive GHG emissions (e.g., emissions from calcination of limestone in cement production and methane leakage from oil and gas infrastructure), decreased by 14% between 1990 and 2020, primarily due to decreases in total fossil fuel combustion, fluorinated gas production and use, and metals-related process emissions (Figure 32.6). The manufacturing sector (i.e., production of goods and materials) is the largest source of direct emissions within the overall industrial sector and accounts for substantial electricity sector emissions related to purchases of power and heat (Figure 32.6b). Six key manufacturing subsectors (petroleum refining, chemicals, cement, iron and steel, aluminum, and forest products) account for around 70% of all emissions attributable to the manufacturing sector (Figure 32.6b).
Between 1994 and 2018, electricity-related emissions from US manufacturing have decreased by about 32% due to improved process efficiencies, deployment of combined heat and power systems, and decarbonization of purchased electricity. However, direct emissions from onsite fossil fuel combustion have decreased by only 10% over the same period and now account for about three-quarters of direct manufacturing emissions (Figure 32.6b).
Land-Related Emissions
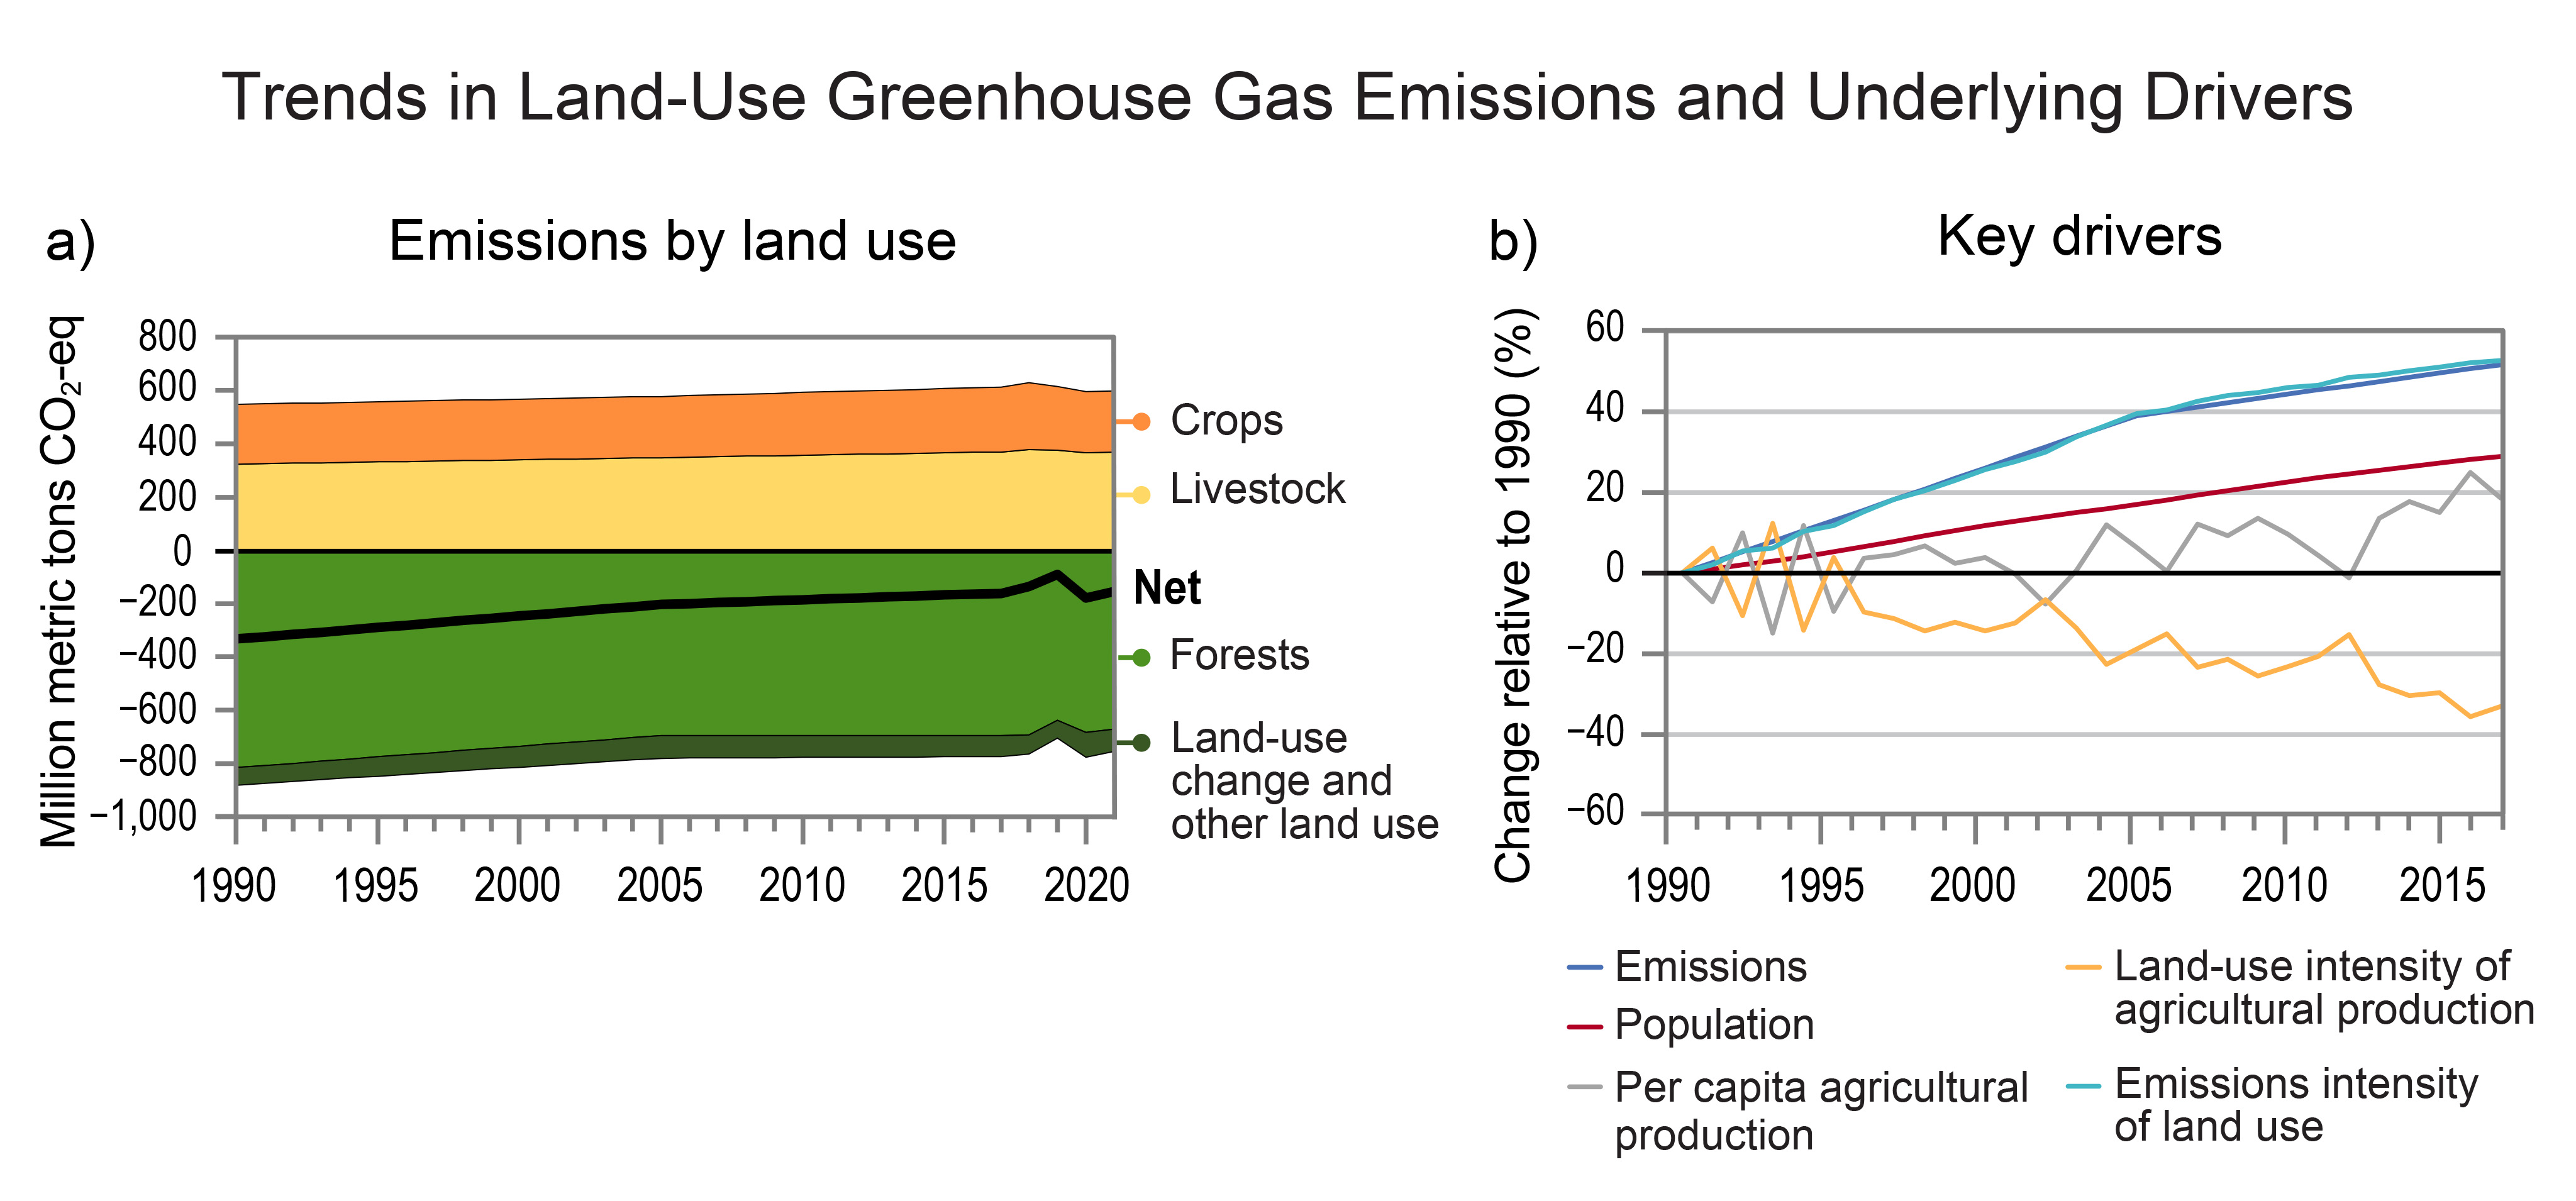
Annual US GHG emissions related to land use in 2019 can be split into emissions of 615 Mt of CO2-eq from agriculture and uptake of 704 Mt of CO2-eq by other land use and land-use change (including forests; Figure 32.7). Thus in 2019, there was a net land-related uptake (i.e., negative emissions) of 90 Mt CO2-eq. Forests take up carbon, but the amount of carbon sequestered by US forest land has decreased from 816 Mt CO2 in 1990 to 638 Mt CO2 in 20199 due to a combination of drought, wildfire, and disturbances by insects and disease (Box 7.2; KM 6.1).21,22,23 Agricultural emissions (excluding fuel combustion) increased slightly from 548 Mt CO2-eq in 1990 to 615 Mt CO2-eq in 2019. The net uptake of 90 Mt CO2-eq from US lands in 2019 represents a 73% decrease from the uptake of 333 Mt CO2-eq in 1990.9

Established Opportunities to Reduce Energy-Related Emissions
In modeling studies, deeply decarbonized and net-zero-emissions energy systems share several common characteristics, but regional approaches may depend on differences in resources,24,25 industrial bases,26 existing infrastructure,27,28 geography,29 governance and politics,30 public acceptance,31 and broader policy priorities.32
Improve Energy Efficiency
Improving energy efficiency means supplying the same level of end-use services or output while using less energy. Efficiency of buildings and appliances can be improved by design or retrofits (e.g., better insulation),33 as well as by optimizing control and management of devices (e.g., HVAC and lighting; KM 12.3; Figure 5.5).34 Further efficiency gains are available in the transportation sector: urban design can reduce travel demands;35,36 public and active transportation modes can greatly reduce energy use per passenger-mile;37,38 and advanced engines, electrification, reducing the weight of vehicles, and aerodynamic improvements can reduce energy use per passenger-mile (KM 13.3).39,40,41 In model scenarios of energy systems that successfully reach net-zero CO2 emissions, total US energy use often decreases relative to current levels, despite economic and population growth.42,43
One of the concerns with energy efficiency is whether it can induce rebound effects of different types. Studies have shown that the direct rebound effect (i.e., use of more of a good or service as it becomes more affordable) is low in the context of energy goods and services, but there is more uncertainty regarding indirect rebound effects (i.e., how an increase in energy efficiency of a good or service may lead to a change in the use of other goods and services or changes in the overall economy).44,45
Decarbonize the Electricity Sector
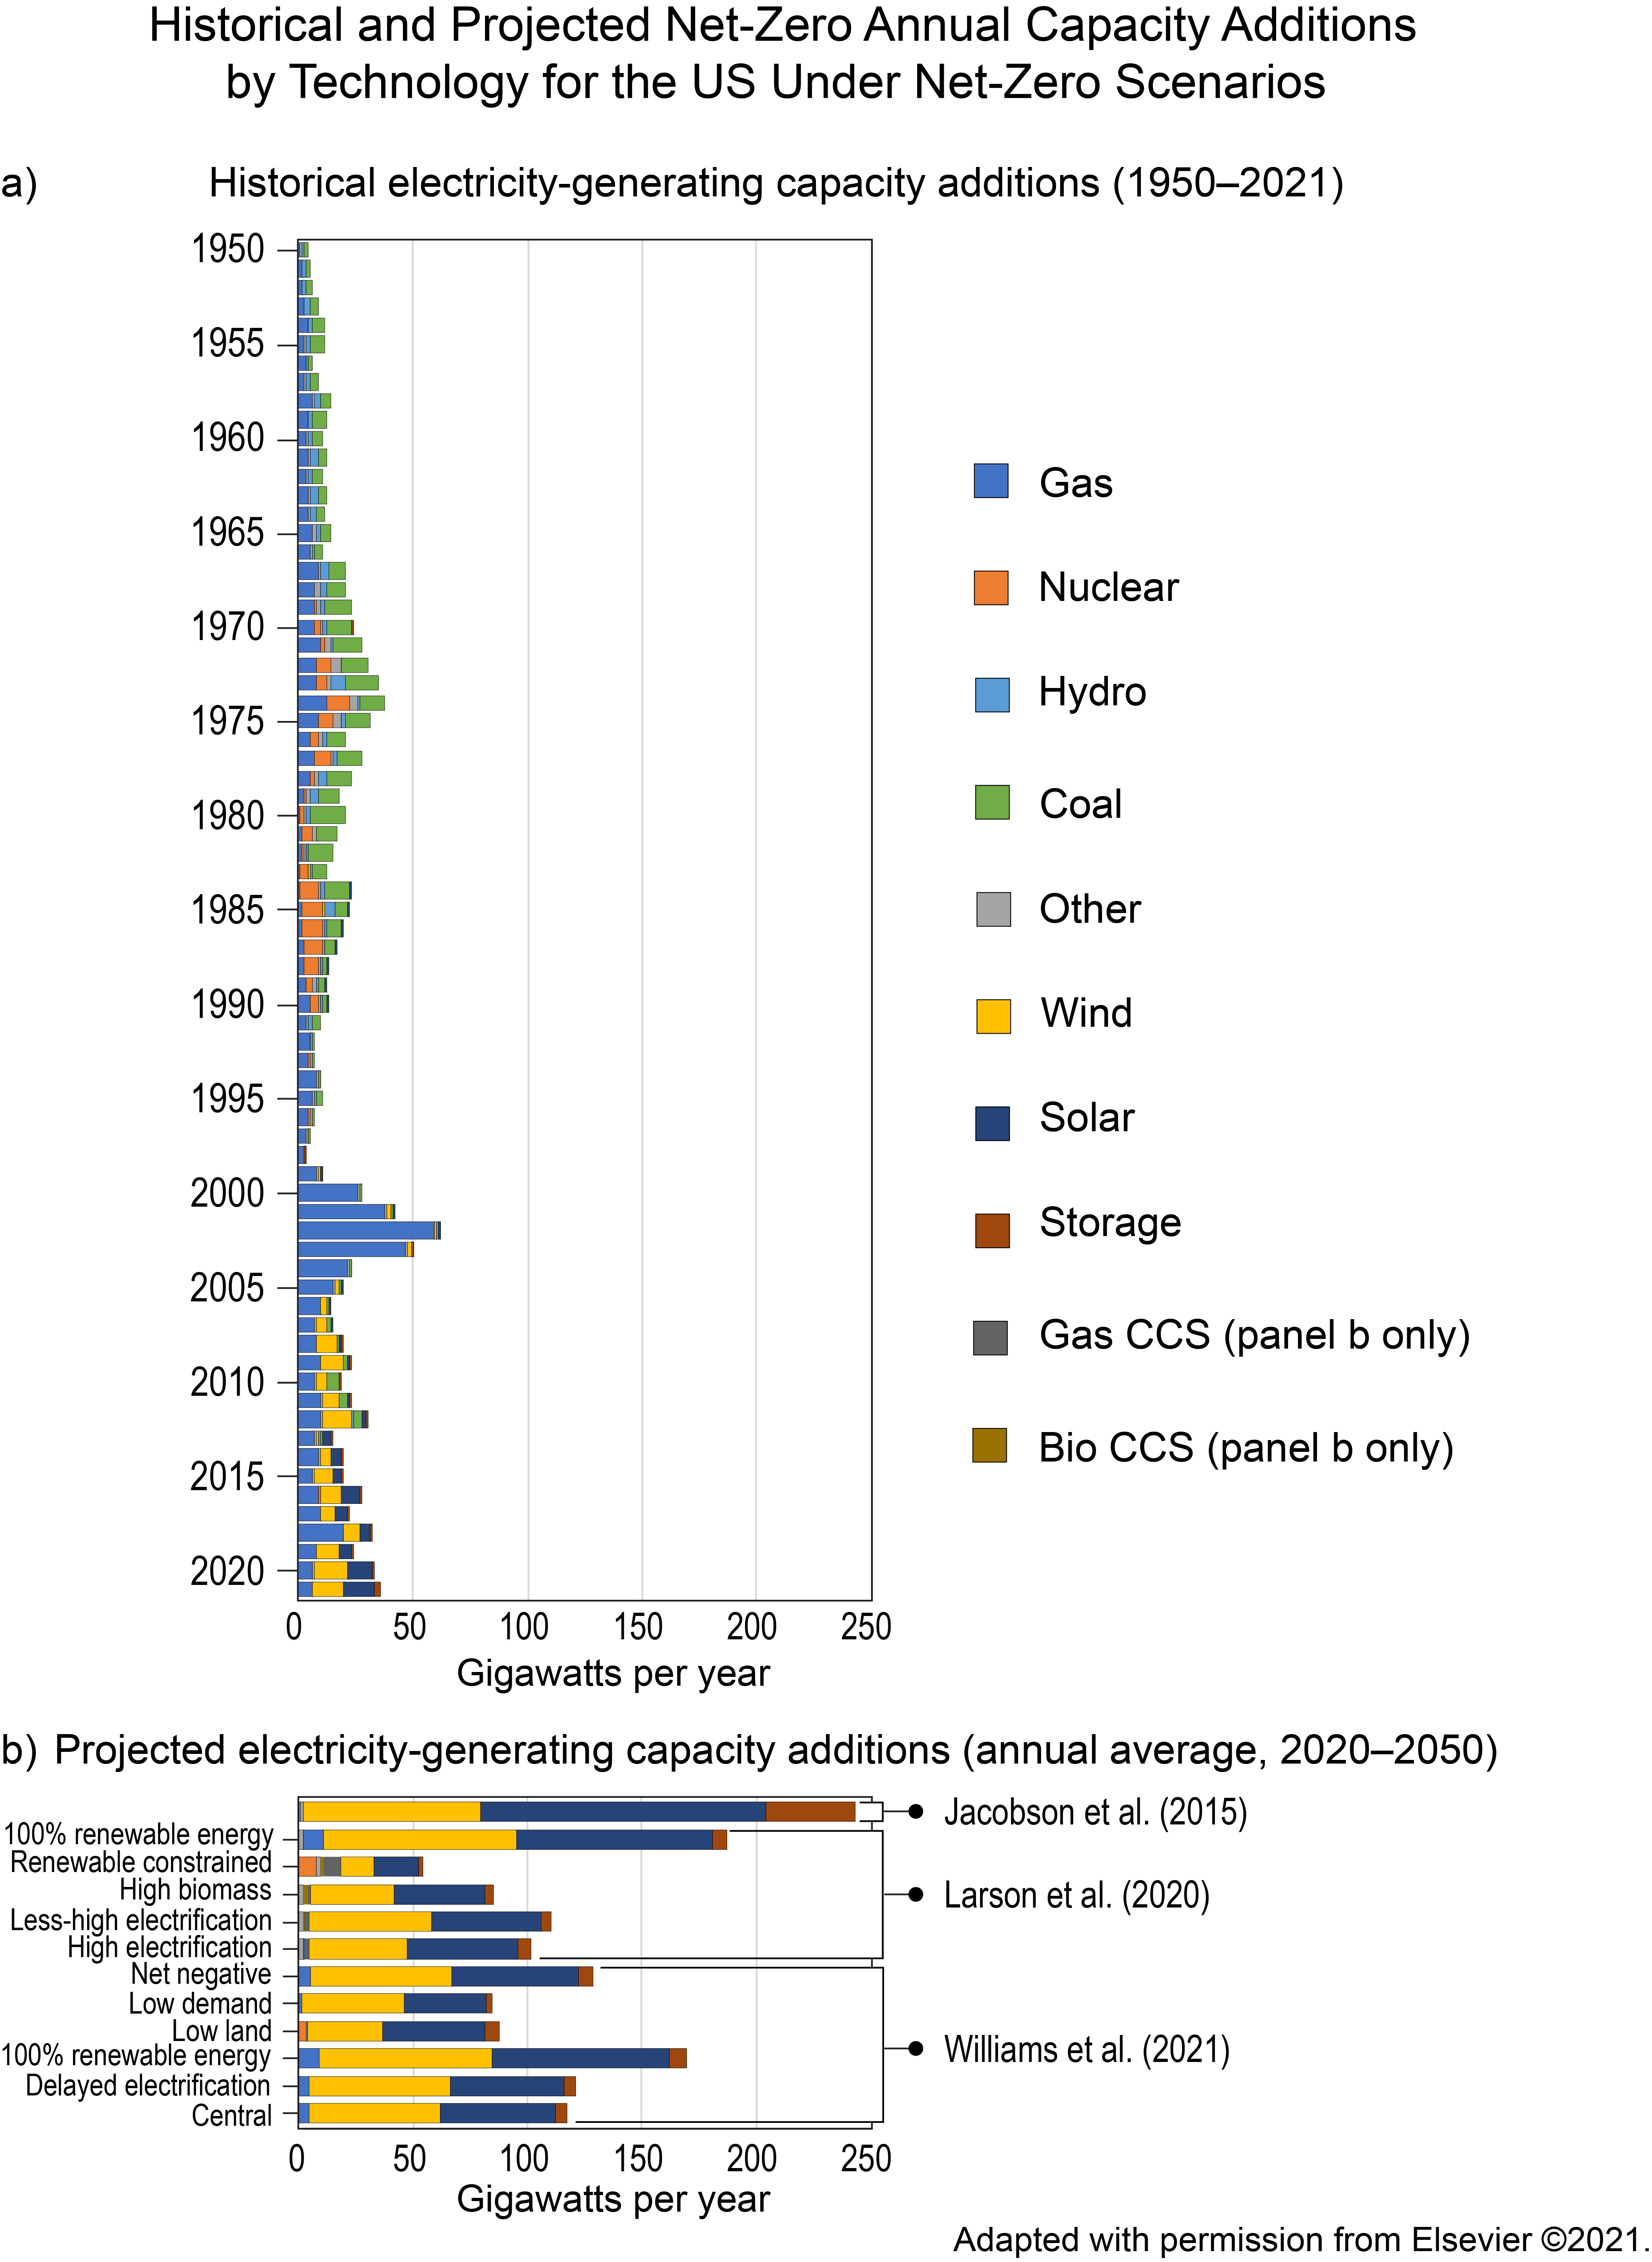
Options for reducing electricity system emissions include variable renewables (e.g., solar and wind resources, which are not available on demand; KM 5.3), dispatchable or “firm” renewables (e.g., biomass, hydropower, and geothermal, which can be available on demand), and other low-emitting dispatchable resources (e.g., nuclear and carbon capture and storage [CCS]–equipped fossil-fired generators); energy storage technologies; improved transmission (both upgrading conductors and new rights-of-way); and demand management. The rate and scale at which these technologies may be deployed in the future depend on the uncertain trajectories of their costs and energy markets, as well as a host of non-economic factors (KM 32.4).46,47,48,49,50,51,52,53,54
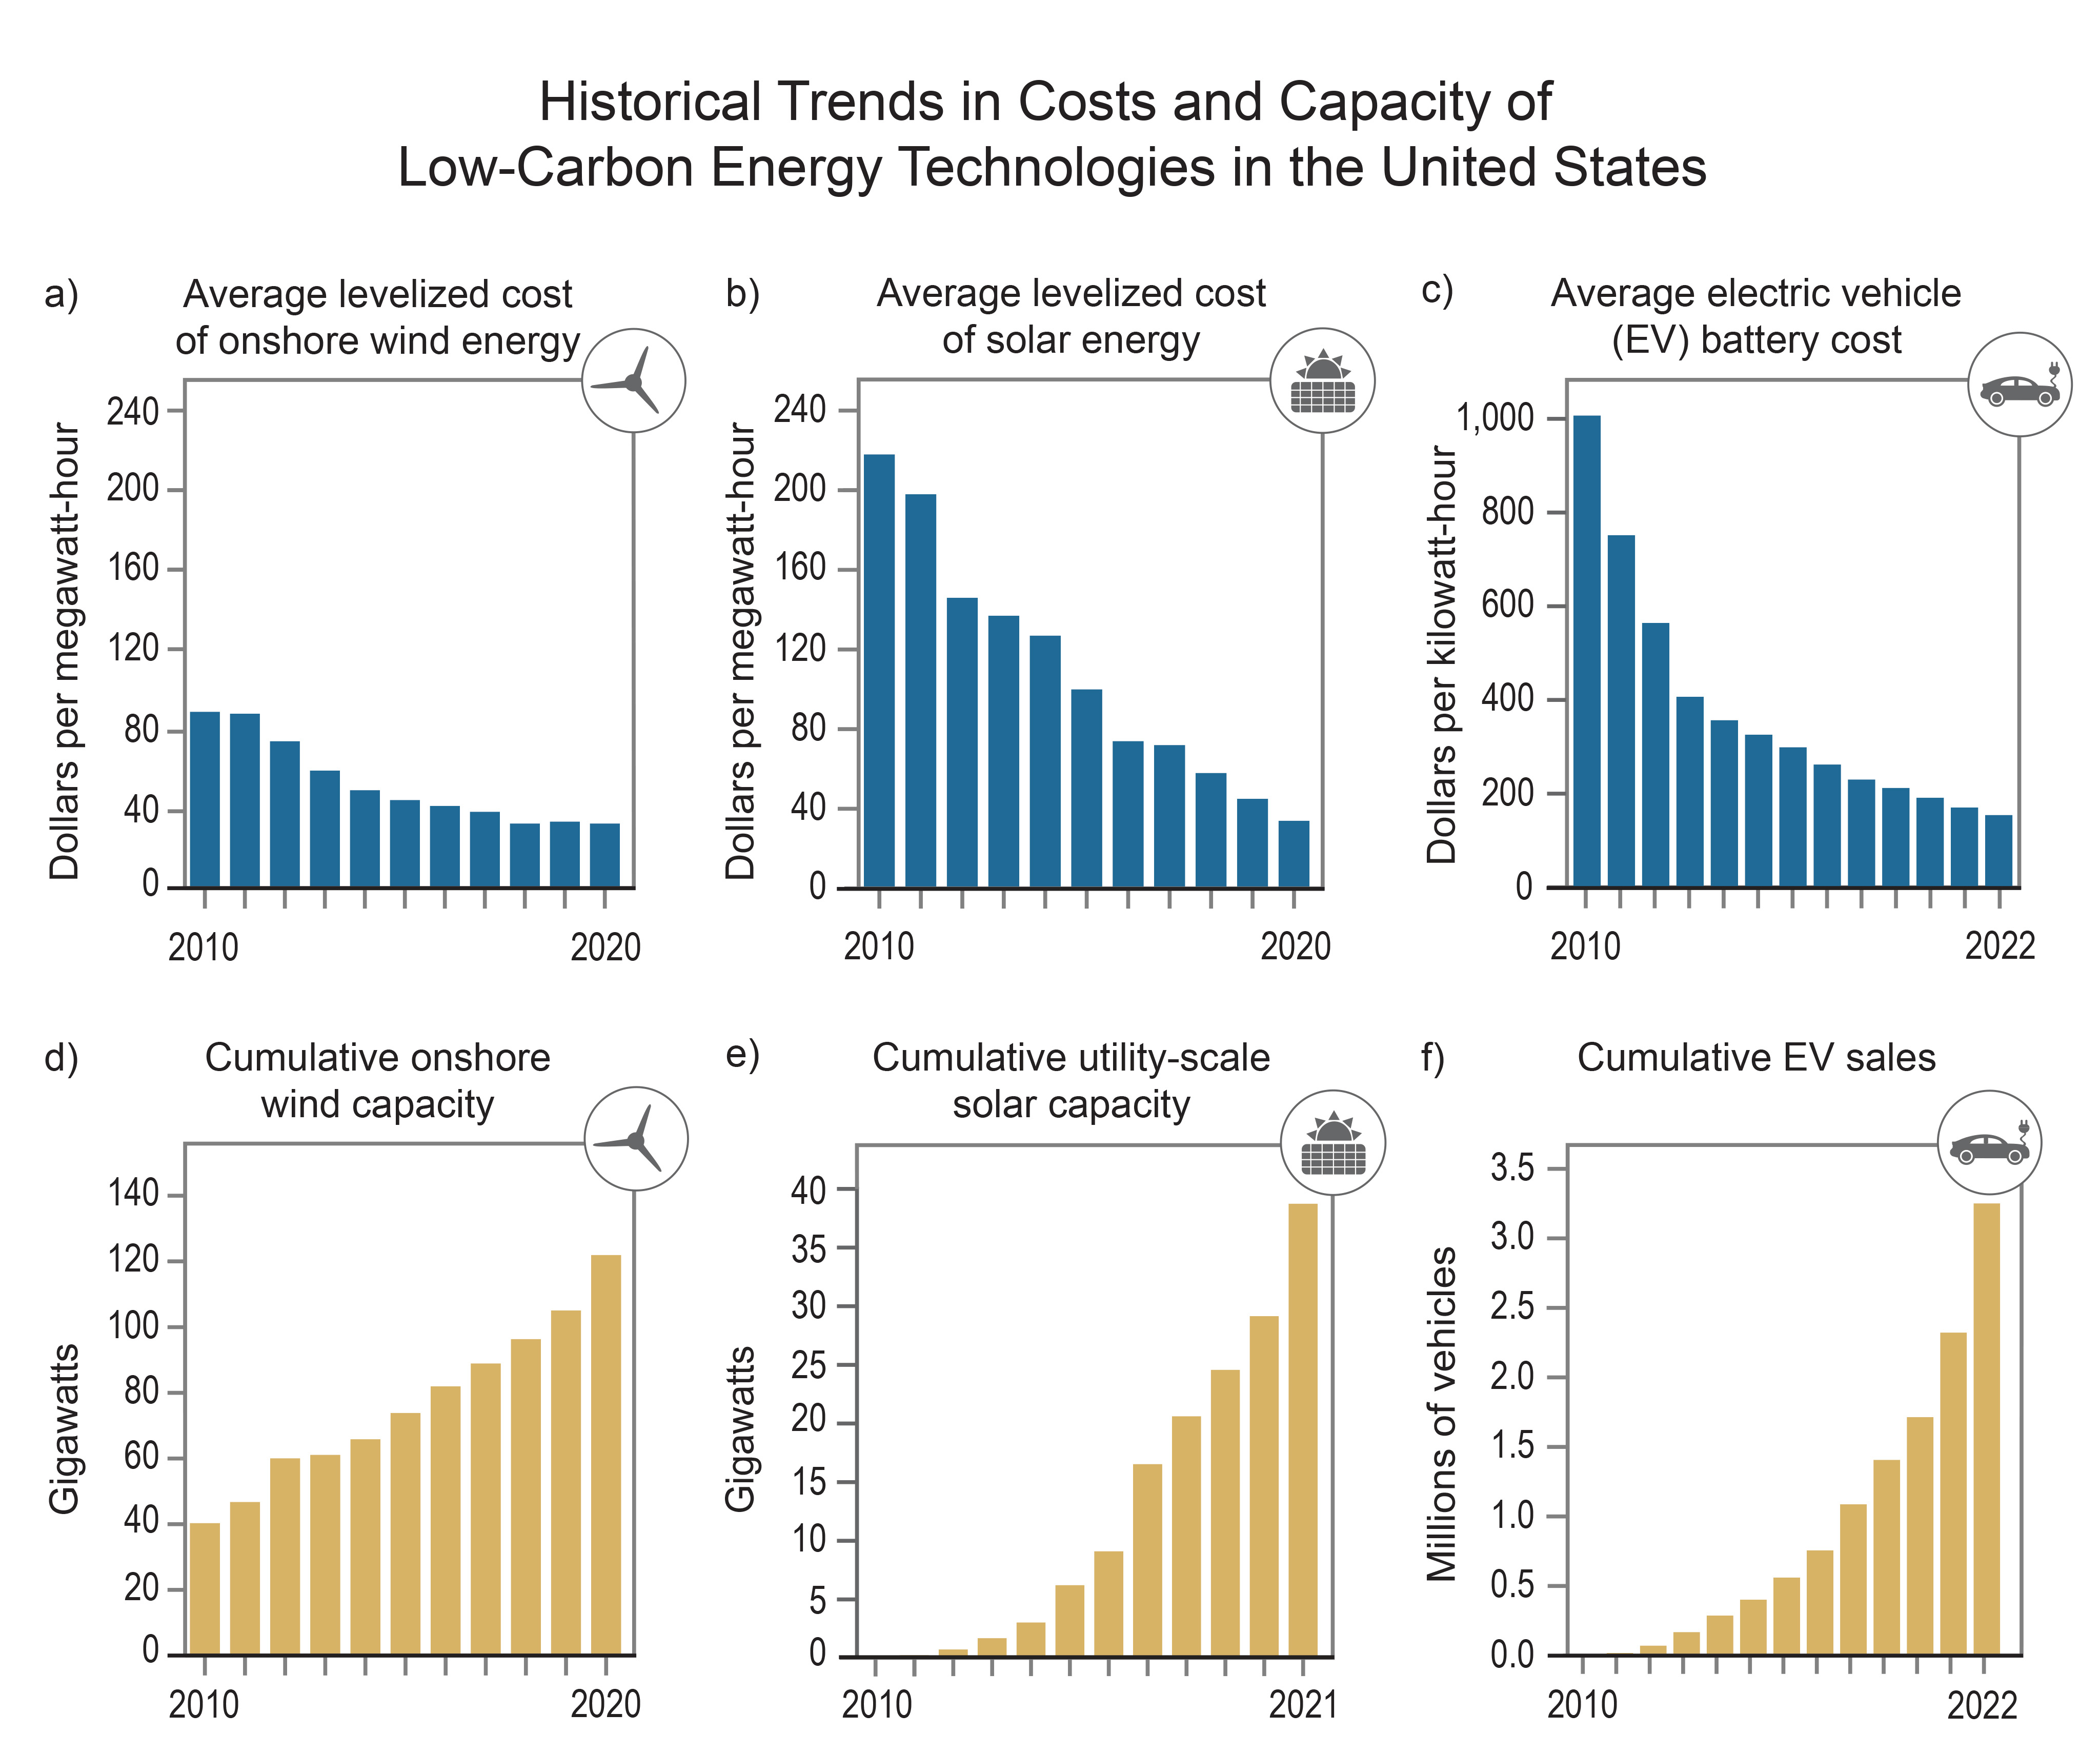
However, given their plummeting costs (Figure 32.8a, b) and growing policy support (e.g., the Inflation Reduction Act of 202255), variable renewable-energy resources—especially wind and photovoltaic solar generation—are expected to play central roles in decarbonizing electricity systems across the United States. Energy system models project that the capacity of wind and solar would need to increase 2 to 10 times faster each year than maximum historical rates (Figure 32.9b) to reach the 2030 target of halving economy-wide GHG emissions and midcentury net-zero targets (Figure 32.1).42,43 In such scenarios, expansion of energy storage generally supports greater reliance on wind and solar (Figure 32.1).42,43
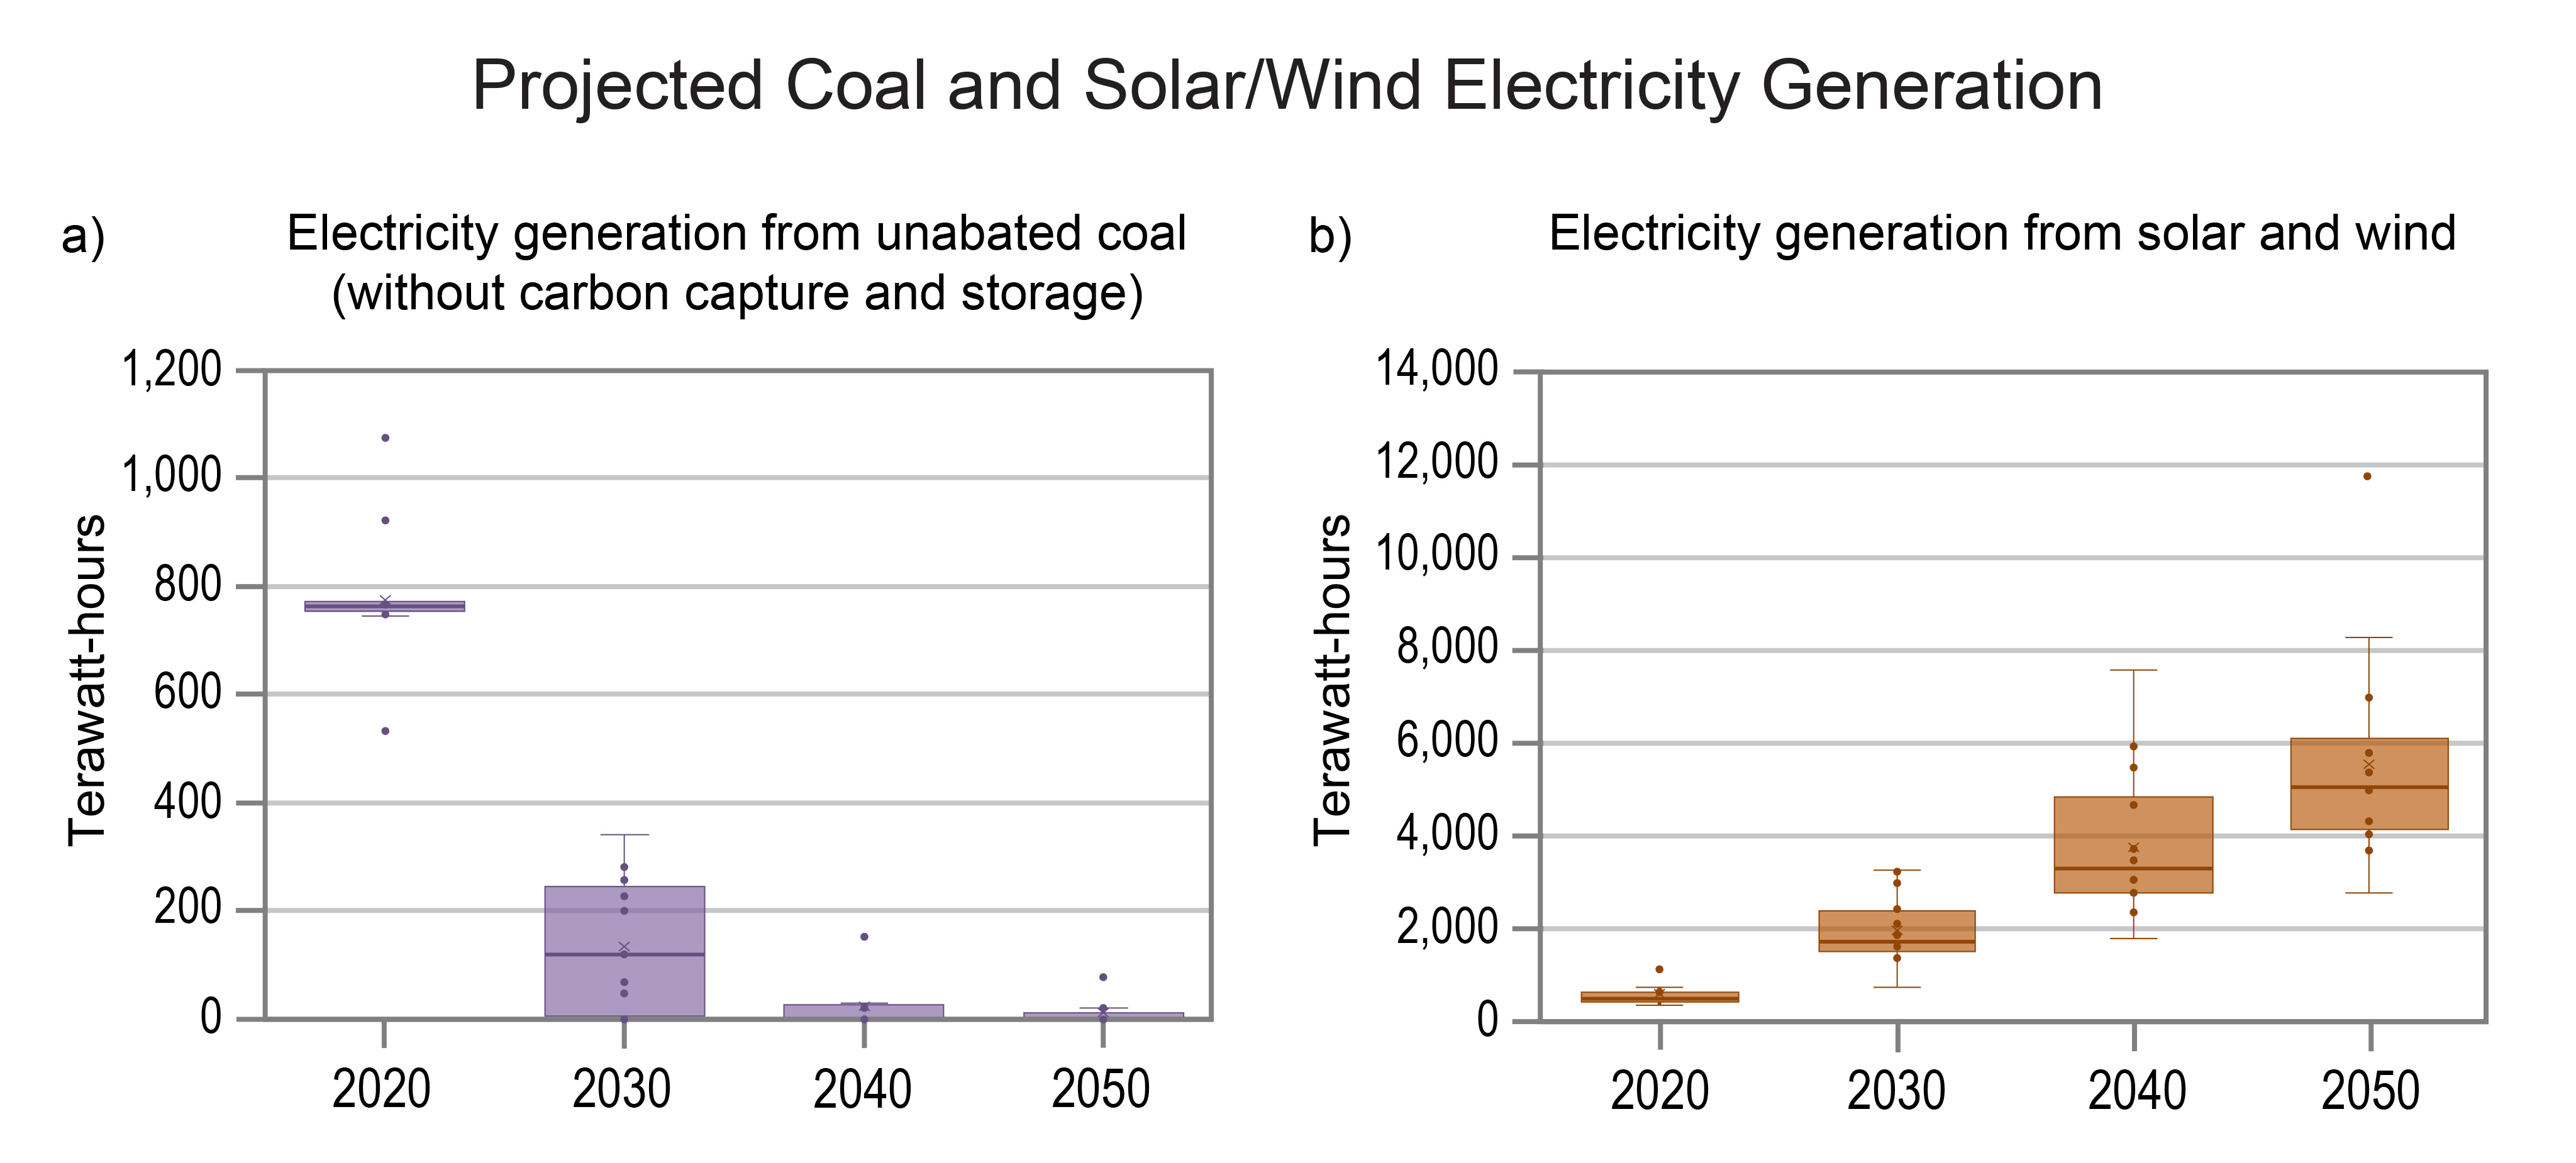
The same model scenarios consistently project the rapid decline of coal-fired electricity generation in decarbonized systems to near zero by 2030 (Figure 32.10).42,43 In contrast, natural gas–fired electricity generation declines more slowly in most of these net-zero emissions scenarios, facilitating penetration of variable renewables but operating less frequently over time unless equipped with CCS.53,56,57
Finally, net-zero CO2 emissions scenarios often maintain—but do not greatly expand—existing nuclear and hydropower capacity in the absence of significant cost declines (such as improved economics from small modular designs; KM 5.3) and/or constraints on the deployment of other technologies.42,43,58 In contrast, both transmission infrastructure (i.e., power lines) and international and interregional transfers of electricity often increase in decarbonization scenarios, although the scale of such increases varies.42,43,59
Electrify Energy End Uses
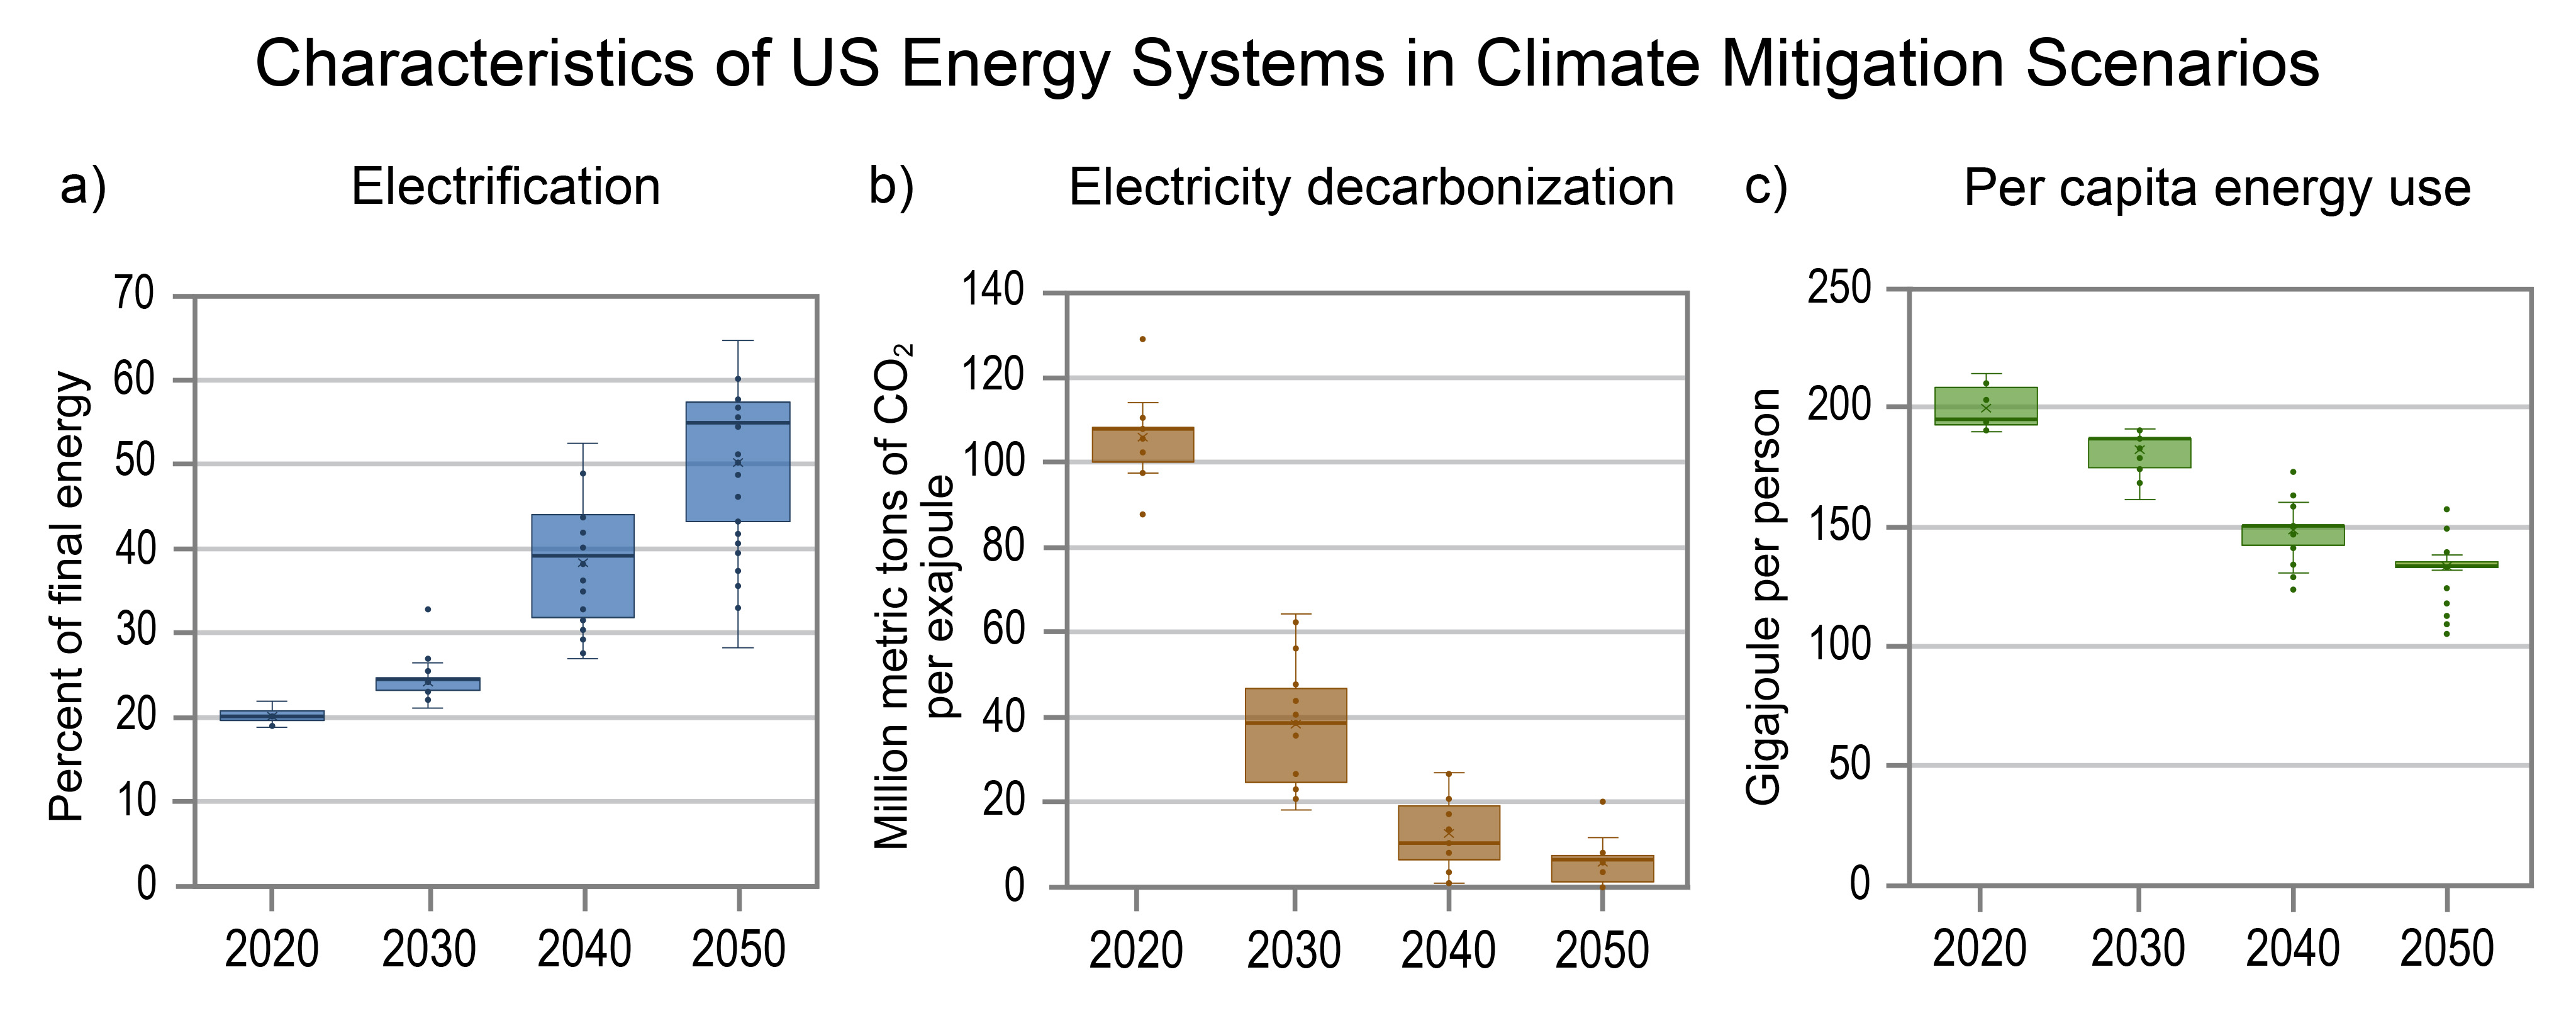
As electricity systems are decarbonized, energy model scenarios consistently project widespread electrification of energy end uses such as on-road transportation and heat for buildings and industry (KM 5.1).42,43,50,52,53,54,62 Electricity may also be used to produce low-carbon fuels, such as hydrogen and e-fuels (liquid fuels produced by combining carbon captured from the atmosphere with hydrogen produced by electrolysis), for difficult-to-electrify applications (Box 32.1).63 The share of US final energy demands (i.e., energy used) met by electricity in net-zero-emissions energy systems will depend on the costs of low-carbon alternatives such as biofuels and hydrogen, but estimates range from 30%–60% in 2050, up from about 20% today (Figure 32.11).42,43
In transportation, light-duty electric vehicles (EVs) have had policy support (e.g., tax refunds) at both the state and federal level for a long time, and new EV sales have increased in recent years (Figure 32.8).64,65,66,67 The EV share of new light-duty vehicle sales in the US is expected to grow quickly,67,68 which is the case in model scenarios that reach net-zero emissions by midcentury.42,43 Many medium- and heavy-duty vehicles can also be electrified,69 although some applications (e.g., long-distance trips) may present special challenges.70,71,72,73,74 Decarbonization of the most difficult-to-electrify transportation sectors (e.g., aviation, international shipping) may require liquid biofuels or fuels synthesized using electrolytic hydrogen and carbon captured from the atmosphere.75,76
Insofar as electricity is generated from non-emitting sources, electrification of space and water heating would drastically reduce direct emissions from residential and commercial buildings in the United States (where these end uses account for the bulk of natural gas and oil consumption).77,78,79 Similarly, most industrial energy demand could be electrified using existing technologies,80 although achieving net-zero emissions in some industries may present special challenges81,82,83,84—particularly related to the costs of supplying high-temperature heat with electricity85 and/or fundamental changes in processes such as switching to direct reduction of iron ore with electrolytic hydrogen or installing carbon capture and storage on thousands of cement kilns worldwide.86
Established Opportunities to Reduce Land-Related Emissions
Despite increasing demand for food and the headwinds of climate change impacts on agriculture, there are multiple options for decreasing land-use emissions and protecting and enhancing terrestrial carbon sinks (Ch. 11).
Use Most-Productive Land for Agriculture
Agriculture requires more land, by far, than any other human activity.87 One way to reduce the land required to grow food is to continue farming the most productive lands (those that grow more crops per land area). Removing the most productive areas from cultivation would lead to an increase in the overall land area required for agriculture.88 Loss of productive US farmland to sprawl or even restoration could thus lead to substantial land-use change and related GHG emissions elsewhere (e.g., if demanded agricultural goods are imported from other regions).89,90 For these reasons, studies have suggested mitigation efforts should prioritize restoration of marginal (i.e., not the most productive) lands.91
Reduce Food Waste
More than a third of all food in the US is currently wasted, more than 40% of which is food discarded by retailers and consumers (Box 11.2; Figure 11.12).92,93 Multiyear campaigns (from 4 to 11 years long) in five other developed countries successfully reduced food waste per person by 8%–29% through public education and public and private initiatives.92 Assuming similar reductions could be achieved, US agricultural land and land-related GHG emissions could be reduced by 4%–13%.
Shift Diets
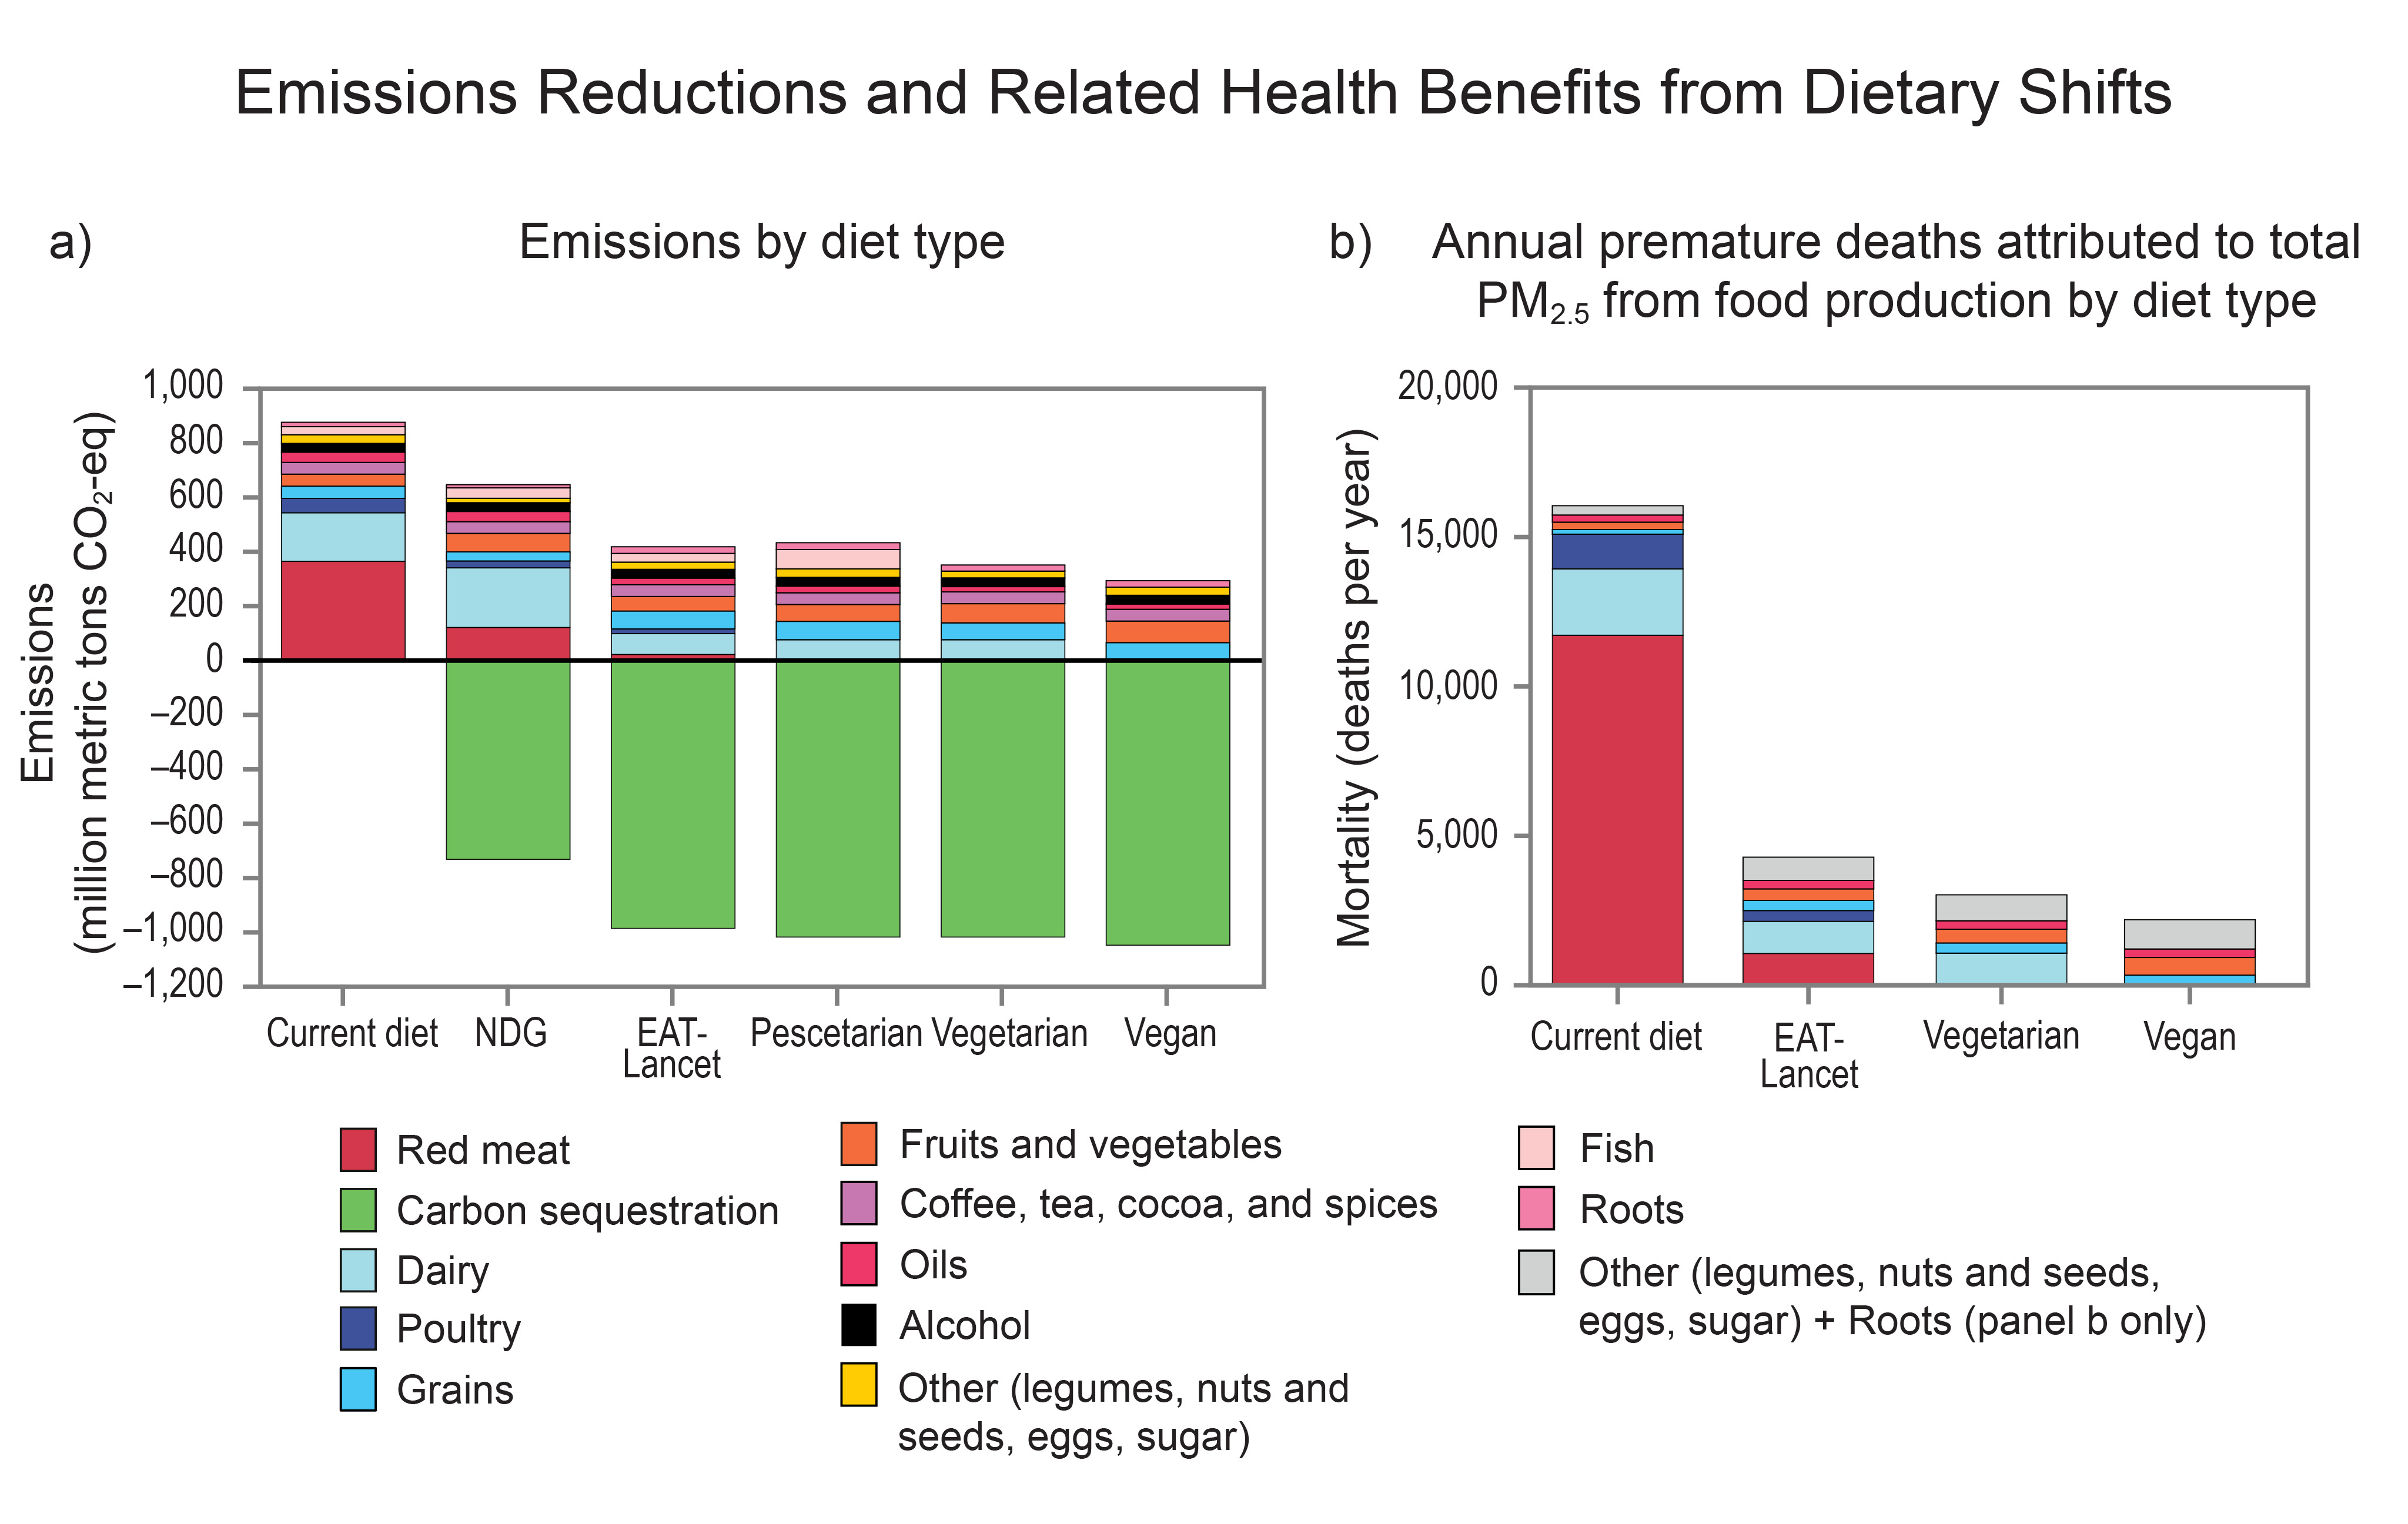
GHG emissions produced during food production, distribution, transportation, and sale at retail or restaurants vary across different foods, so that different diets will entail different levels of life-cycle GHG emissions.94,95,96,97 In particular, although meat is a good source of protein and micronutrients, it generally produces more emissions per calorie than plant-based foods because energy is lost at each trophic level.94 Emissions related to meat production also vary: for example, ruminant animals usually produce much more GHG emissions per calorie of meat and per gram of protein than poultry (Figure 11.8).98 By reducing demand for emissions-intensive food, shifts to pescatarian, vegetarian, vegan, Mediterranean, or “flexitarian” (less meat consumption but not strictly vegetarian) diets can reduce land-related GHG emissions while providing direct health benefits (Figure 32.12),95,99,100,101 although analyses and models differ as to the level of future food demand related to such diets and other socioeconomic changes.102 Shifting diets and associated changes in agricultural practices have implications for land-use change as well as supply chains, air pollution, and human health.103 Consideration of energy and other inputs per unit of production and the resulting impacts on net GHG emissions is important for comparison of different dietary choices.
However, 10.4% of American households are food insecure (Box 11.1),104 so any approach to reduce the consumption of higher-emissions foods that results in higher food prices could disproportionately harm these households. Instead, policies might encourage less emissions-intensive diets while also reducing food costs and increasing consumer choice by making a diversity of plant-based and other lower-emissions, nutritious, and affordable options more widely available.
Improve Management of Croplands and Pasture
There are numerous opportunities to decrease the intensity of emissions (and/or increase sequestration; see Box 32.2) of croplands and pasture, including 1) improving soil health, 2) improving nitrogen fertilizer management, 3) increasing the number of trees and other perennials on the landscape (e.g., by agroforestry; see Ch. 11),105,106,107 and 4) avoiding methane emissions. Soil health and carbon sequestration can also be improved by amendments (including biochar; Figure 11.5), cover crops, reduced tillage,108 and diversification of crop rotations.109 Careful and sustained implementation of these practices can increase not only soil carbon but also yields, resilience, and profitability.
Better aligning the timing and amount of fertilization with plants’ needs can reduce fertilizer use110,111 and thereby also reduce both nitrous oxide (N2O) emissions from the soil and fossil fuel emissions from fertilizer production. Fertilizers with synthetic nitrification inhibitors can further reduce N2O emissions.112 Increased fertilizer efficiency and inhibition of nitrification processes in soil together can reduce N2O emissions by roughly 50%.113,114
There are also feasible options for reducing agricultural (livestock and rice) and waste (landfill and wastewater) sources of methane emissions.115 Methane is a relatively short-lived GHG that has contributed to at least 25% of climate warming to date.116,117 Consequently, technically feasible near-term methane emissions reductions could slow global decadal warming by 30%, avoiding a quarter degree Celsius of warming by midcentury.115 In addition to land-related sources of methane, there are large reductions possible from the oil and gas sector,118 primarily by repairing leaks at little or no net cost115 and ideally prioritizing disproportionately large sources (i.e., super-emitters).119,120,121
Avoid Conversion and Monitor Carbon Fluxes on Unmanaged Land
Between 50 and 150 Mt of annual CO2 emissions could be avoided by stopping conversions of unmanaged land in the United States (i.e., natural forests, grasslands, wetlands, or other ecosystems where there has been no substantial human influence or intervention).122 Strategies for stopping such conversions include densification of already-developed areas, zoning, and property tax incentives, as well as land protection such as conservation easements and public parks.123,124,125,126 Related to this opportunity, the recent decrease in carbon sequestration by US forests (KM 32.1) is a concern. Further weakening of this carbon sink would make reaching net zero proportionally that much more difficult. Improved monitoring of forest carbon fluxes and their drivers is therefore important, including those on unmanaged land and in boreal Alaska (KM 7.2).127,128,129

Potential Opportunities to Reduce Energy-Related Emissions
There are many uncertainties and outstanding questions related to mitigation of energy-related emissions. These uncertainties are reflected by the large differences in the scale and mix of energy sources and use as well as carbon management across modeled net-zero-emissions energy systems, which highlight potential mitigation opportunities.
The Mix of Electricity Sources in Net-Zero-Emissions Energy Systems
In recently modeled net-zero-emissions US energy systems, the share of electricity demand met by variable renewables—as opposed to firm sources—varied from 45%–89% depending on the availability of energy storage, transmission, and the mix of solar and wind.42,43 Although grid managers are gaining experience planning and operating electricity systems with large amounts of solar and wind generation, questions persist as to the maximum share of these resources that should be included in reliable and resilient decarbonized systems130 and the best approaches for dealing with their natural variability.131 Large shares of variable renewables can be incorporated in electricity grids through the use of 1) batteries, hydrogen, and other types of energy storage; 2) transmission and interregional transfers of electricity; 3) firm low-carbon electricity sources; and 4) greater demand-side responses. The costs and effectiveness of these approaches for managing variability differ and are related to the spatial and temporal variability of solar and wind resources,25,76,132,133,134,135,136,137 in addition to a host of non-cost factors (KM 32.4). Moreover, energy sources and technologies will interact in complex ways to fulfill the different functions in electricity systems (e.g., providing energy, capacity, and ancillary services over different timescales), depending on their relative costs and system benefits, policy stringency and design, geophysical resources and infrastructure, environmental co-benefits, and societal preferences.56,57,138 Further research, development, and demonstration of technologies and approaches are needed to resolve uncertainties, identify key sensitivities, and clarify the most attractive options for providing reliable, resilient, and affordable electricity in net-zero-emissions energy systems (Figure 5.6).
Alternative Fuels for Difficult-to-Electrify Sectors
As with electricity, there is considerable uncertainty about the scale and mix of other energy carriers (e.g., hydrogen, bioenergy, e-fuels) that may be needed by difficult-to-electrify sectors such as long-distance transportation of freight, long-haul aviation, high-temperature industrial heating, and space heating in very cold climates.76,85,139,140,141 Hydrogen, ammonia, alcohols, and carbon-based fuels (e.g., methane, petroleum, methanol) can all be produced with low and eventually net-zero CO2 emissions (Box 32.1). However, it is not clear whether producing and burning these fuels would be lower in cost and more sustainable than continuing to use fossil fuels and managing the related emissions through CCS or carbon dioxide removal (CDR; removal of CO2 from the atmosphere).63 Here again, further research, development, and demonstration of technologies will help reveal critical dependencies and trade-offs and clarify the most sustainable and cost-effective pathways to net-zero-emissions fuels.
Carbon Management
Most model scenarios that reach net-zero emissions in the United States entail substantial use of CDR technologies, not as a replacement for emissions reductions but instead to offset continuing emissions from the most difficult-to-decarbonize sectors and processes, such as aviation and cement making (sources of emissions that may be much more expensive to eliminate), to offset non-energy GHG emissions, and to reduce GHG concentrations in the atmosphere. The degree and form of CDR deployment, including the balance between industrial carbon capture and intentional enhancement of natural carbon sinks, remain highly uncertain, however, and depend on technological readiness, economics, public acceptance, and institutional and political considerations (Box 32.2).
Changes in Transportation Modes and Behavior
Uncertain changes in mobility and travel behavior could facilitate or hinder mitigation. For example, autonomous vehicles are rapidly evolving but still need to overcome challenges of consistent safety measures, standardization of technology liability, and security and privacy concerns.210,211 Studies have shown that autonomous vehicles could increase or decrease energy use and GHG emissions depending on the conditions of adoption and use.212,213,214 New mobility services (e.g., ride-hailing or transit services with a monthly subscription) are becoming widespread and have the potential to transform current patterns of travel behavior, but they still face challenges of cost-competitiveness and consumer acceptance.215,216,217 And as with automation, these mobility services may reduce emissions under a limited set of conditions (e.g., electrification and shared use cases).214,218,219,220
Sector Coupling
The integration of different parts of energy systems, sometimes referred to as sector coupling, involves coordinated planning, operations, and markets for electricity, fuels, and thermal resources to meet end-use service demands. Linking energy industries, processes, and geographies could lower costs, reduce environmental impacts, and increase the reliability of low-carbon energy systems.76,221,222
Potential Opportunities to Reduce Land-Related Emissions
Modern Foods
Recent innovations aim to increase food choices with plant-based and cultured meat223,224,225 and foods synthesized chemically without photosynthetic inputs226,227 that may be able to displace demand for foods with substantially higher emissions per calorie. However, the potential benefits will depend on the scalability and public demand for such products.
Interventions to Reduce Methane and Nitrous Oxide Emissions
There are a number of options for reducing non-CO2 GHG emissions from agriculture whose potential remains uncertain. Ruminant feed supplements may suppress methane emissions (although some such supplements have not yet been approved for use in the United States).228,229 Methane from manure lagoons can be captured and used for bioenergy or reduced through flaring.230 Seasonally flooded rice paddies can undergo temporary drainage to reduce emissions by about 40%.231 And crops may be bred to produce root exudates that inhibit nitrification and thereby reduce N2O emissions from croplands.232

A number of important dimensions rarely represented in mitigation scenarios may nonetheless determine the pace, feasibility, likelihood, efficacy, and cost-effectiveness of mitigation opportunities.
Air Pollution
Air pollutants that impact human health are often co-emitted with greenhouse gases. Exposure to ambient fine particulate matter (PM2.5) and ozone, which are among the largest risk factors for disease, causes 60,000–300,000 excess deaths per year in the United States (KM 14.5),233,234,235,236,237,238,239 with health effects observed at concentrations below the current national standard.240,241,242 Racial, ethnic, and socioeconomic disparities in air-pollution exposure are well documented235,243,244,245,246,247,248 and have persisted despite overall decreases in air pollution.235,241
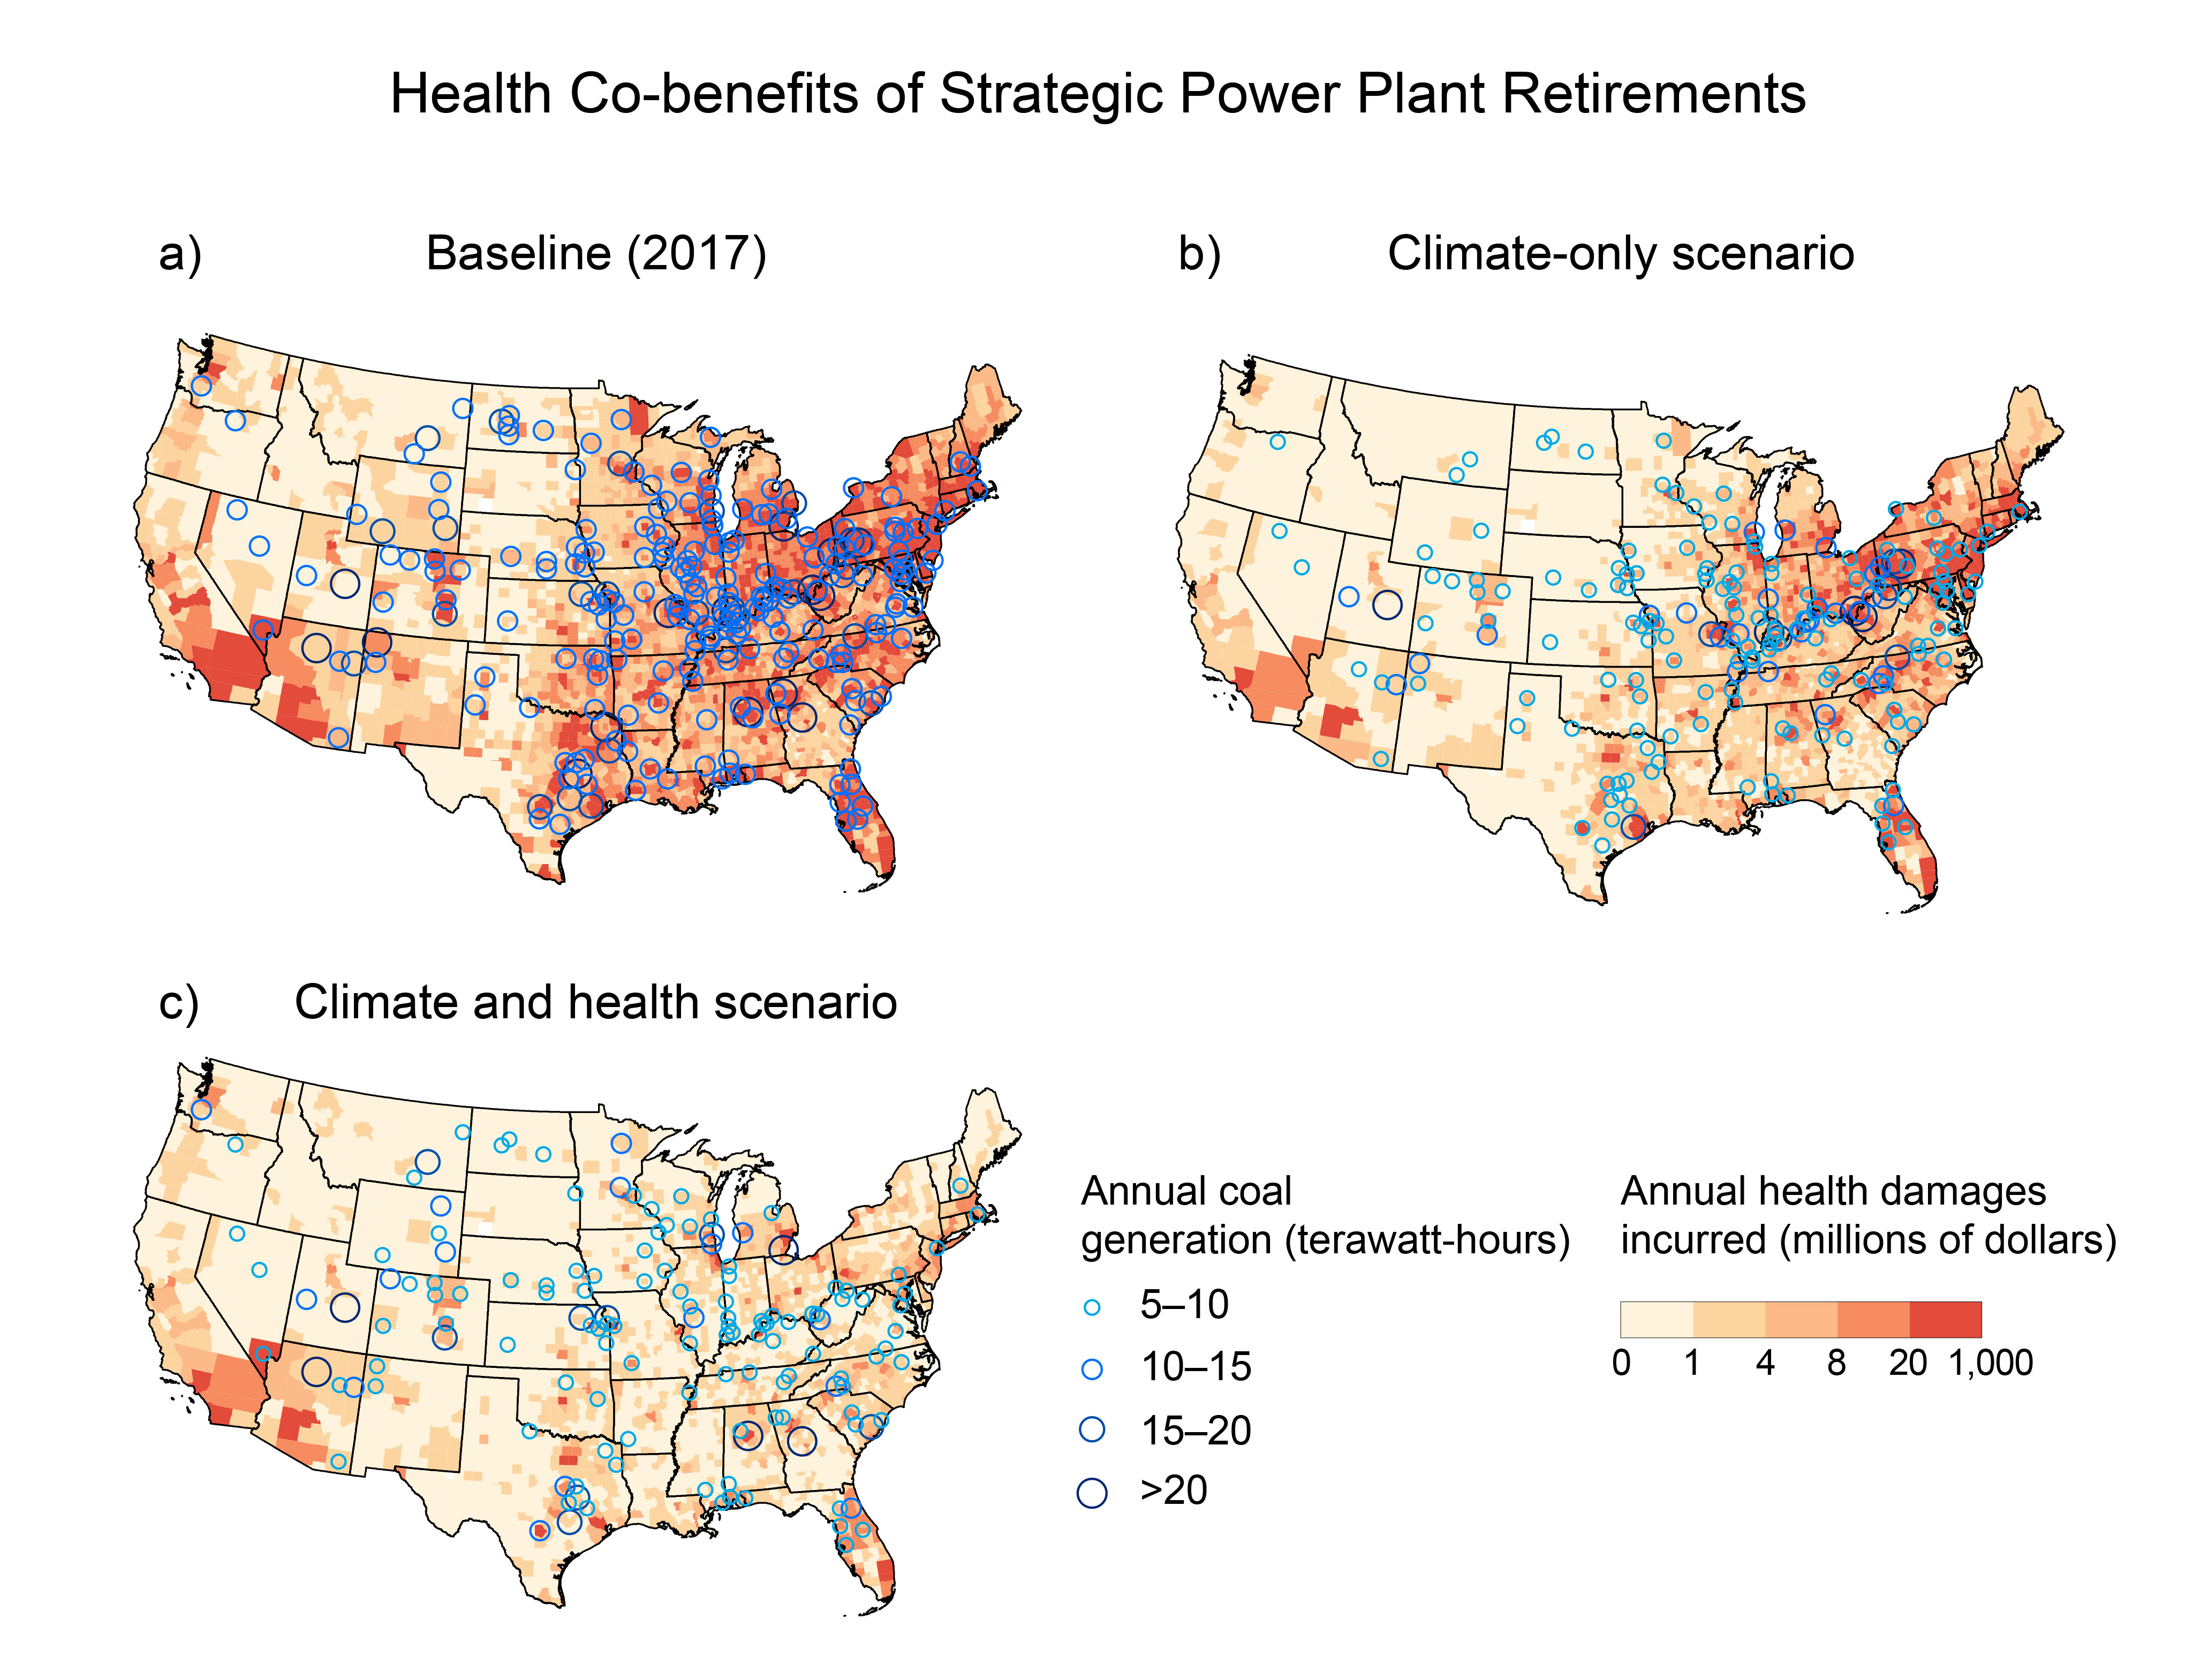
Transitioning to a net-zero-emissions energy system has the potential to generate substantial air pollution benefits. Estimates of cumulative net benefits by 2050 range from roughly 200,000 to 2,000,000 avoided deaths,234,249,250,251 the monetized value (i.e., statistical value) of which could exceed the total expected costs of the transition to net zero.50,252 However, the distribution and magnitude of air pollution benefits over the transition period depend on the pace of electrification, technology selection, and siting decisions,50,253,254,255 especially regarding retirement of fossil fuel power plants (Figure 32.15)255,256,257,258,259,260,261 and vehicle electrification.262,263 Electrification of heating,257,264 reduction in fossil fuel production, electrification of the industrial sector, and shifting diets103 can also all generate meaningful air pollution benefits. Carbon capture and hydrogen technologies may also reduce air pollutant emissions, although it is not yet clear by how much.
It is also possible that mitigation efforts could increase air pollution at local and regional scales, for example, due to increases in bioenergy, residential wood heating, and domestic manufacturing to meet demands for materials and products (e.g., Gallagher and Holloway 2020; Commane and Schiferl 2022253,265).
Siting and Land Use
Net-zero-emissions energy systems may require large land areas, with land requirements in rough proportion to the share of wind and solar energy. Cumulative US land use for solar and wind energy in recent net-zero scenarios ranges from about 250,000 to more than 1 million square kilometers (including the entire area of solar and wind farms),42,43,53 with solar concentrated in the Northeast and Southeast and wind in the Midwest, Great Plains, and Texas (KM 6.3).50 Even at the low end of this range, the projected scale of land use is massive, and may face public opposition. For example, the visual impact and competition for land of such extensive systems would need to gain and maintain the support of many communities; this recently has been a challenge in the siting of solar and wind projects.266,267 Similar challenges may apply to siting and demonstration of other infrastructure regardless of its land footprint, such as new electricity transmission,266 CCS,268 and CDR.269 Others express concern over the potential environmental impacts of solar and wind farms, including land-cover change, loss of plant and animal habitats, barriers to migration and collision deaths of birds and bats,270,271,272 and competition for land between agriculture and renewables.273 Notably, competition with agriculture has also long been a concern about bioenergy, which may be alleviated if demand for corn ethanol decreases due to electrification of transport.274,275 Researchers have thus begun developing pathways that take some of these concerns and constraints into account,50,276 as well as identifying changes in governance and administrative law that may help streamline siting processes;277 however, siting may prove a key obstacle for renewables-based net-zero-emissions systems.278 Engagement with community groups and stakeholders early in the planning process has the potential to reduce project delays and cancellations.279
Water Use
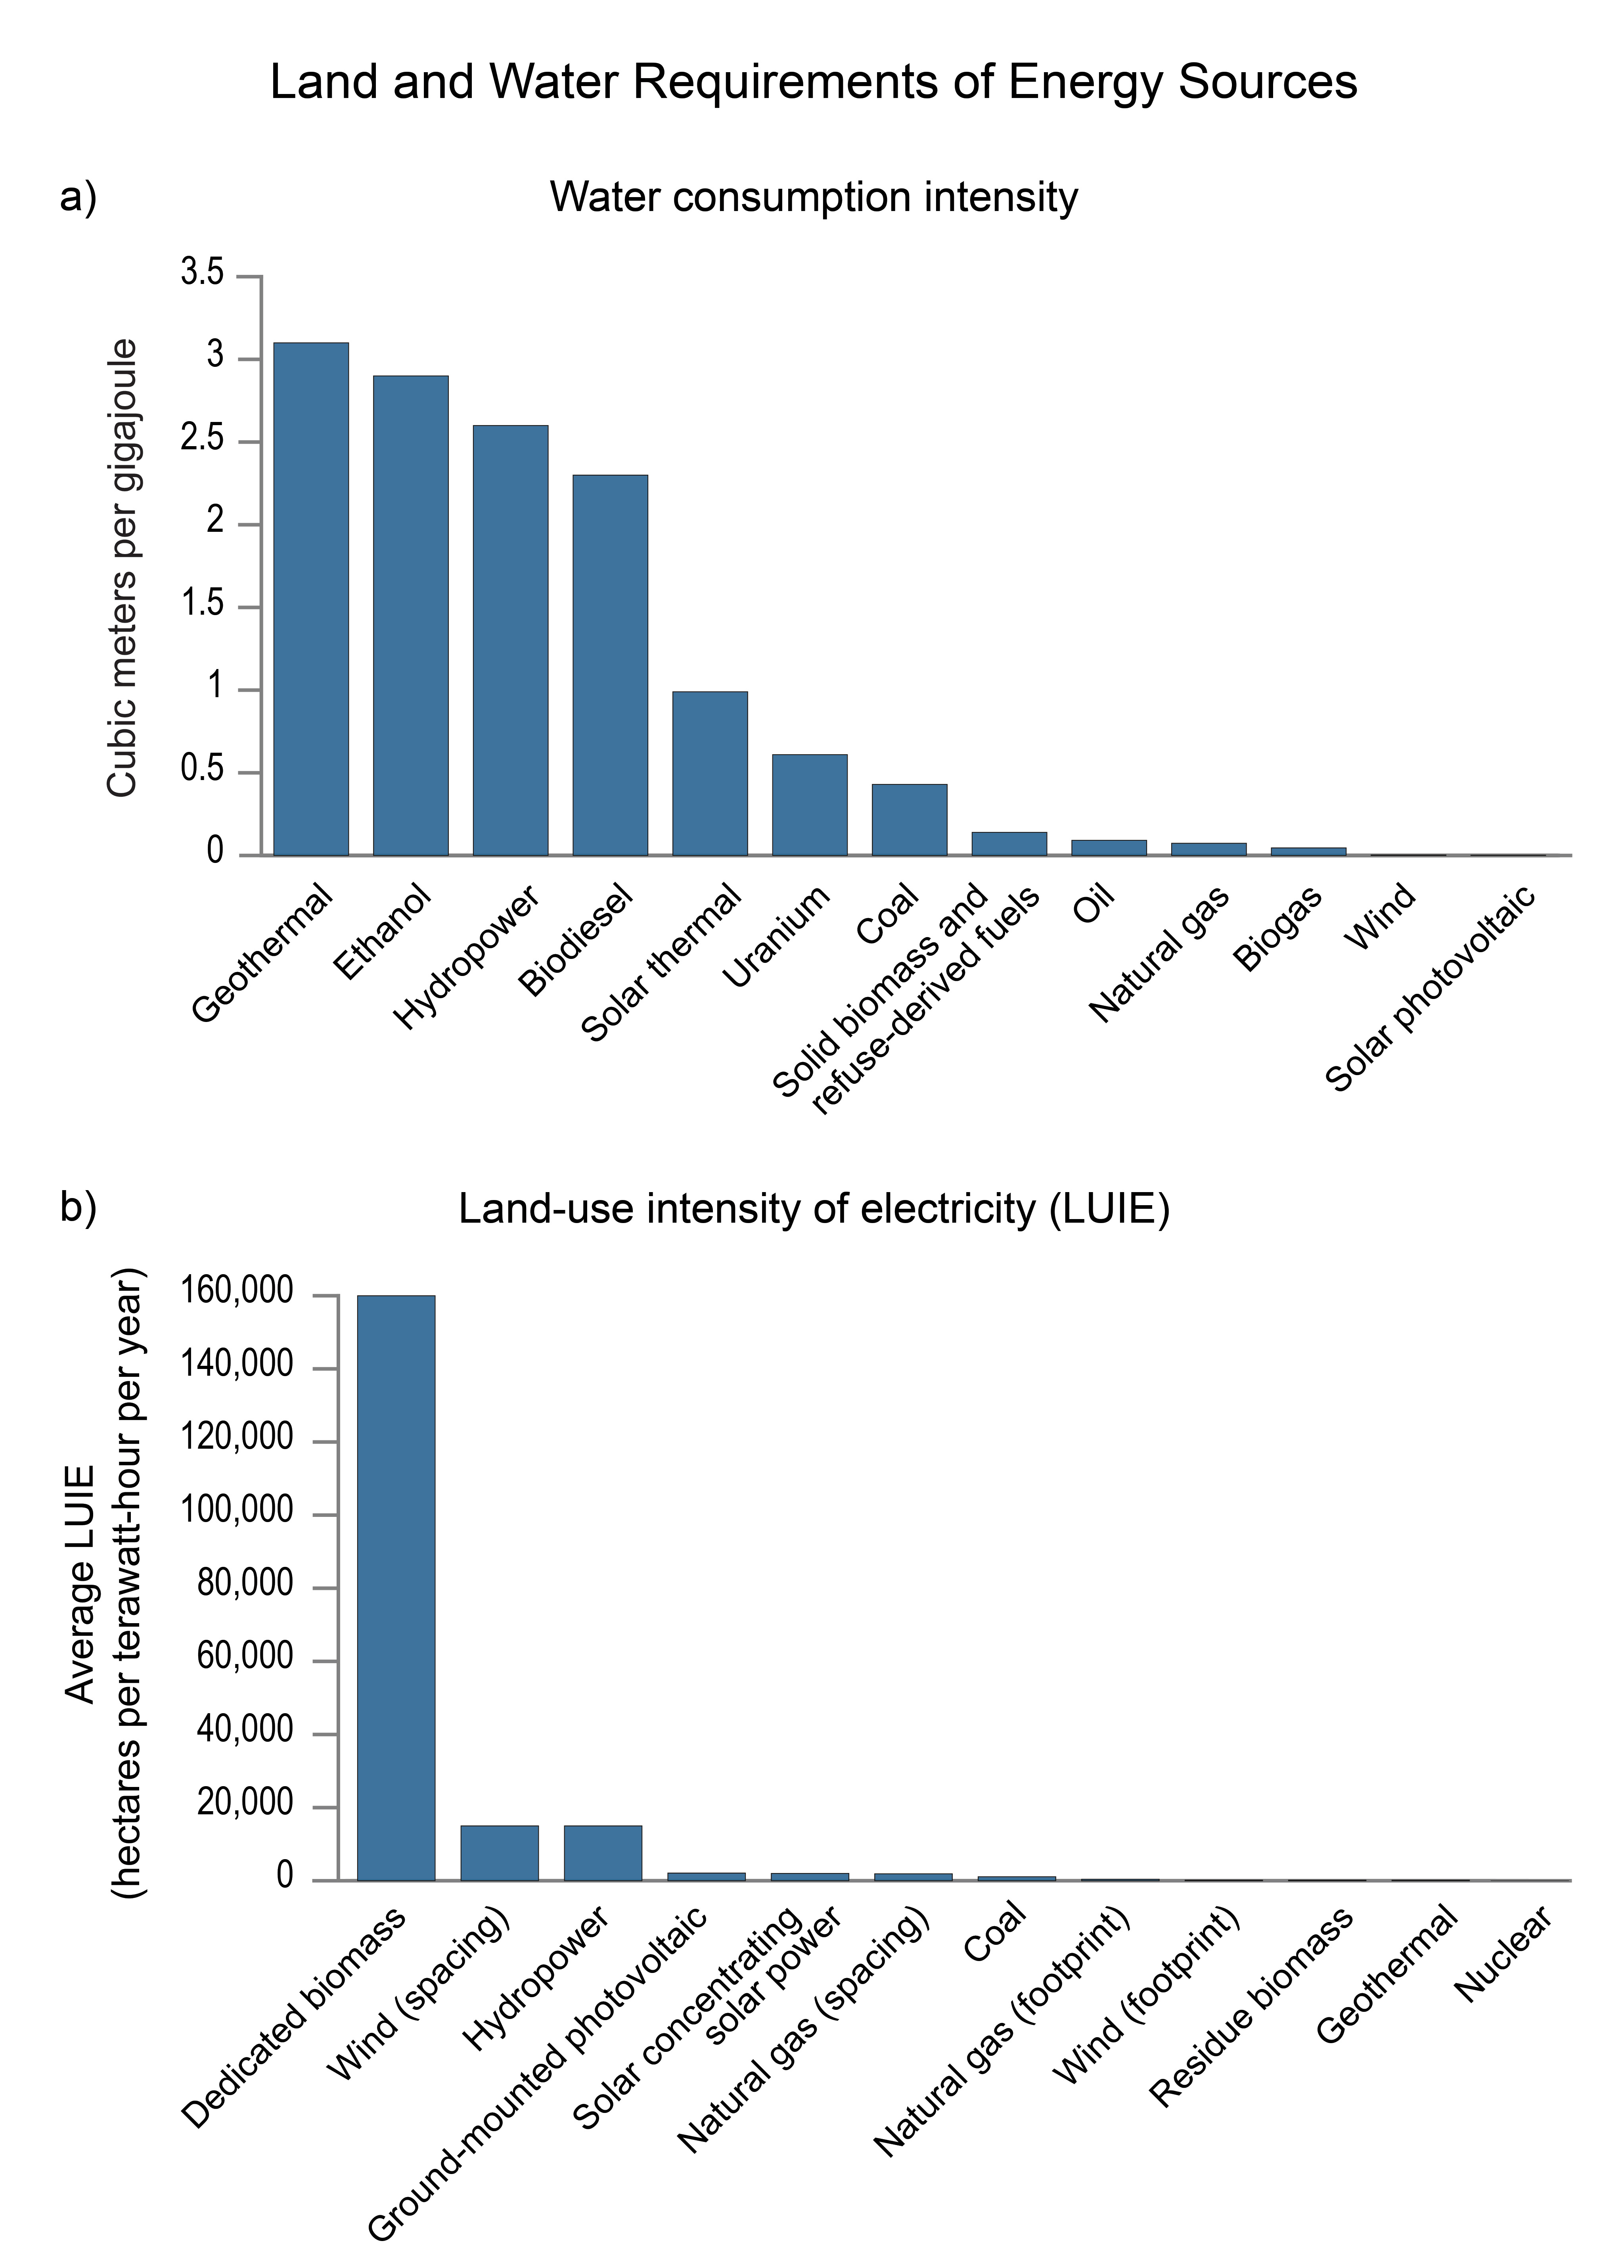
The water requirements of net-zero-emissions energy systems could be lower than current consumption,280 largely because wind and solar require little water (Figure 32.16; KM 5.1).281,282,283,284 However, some processes for energy conversion and carbon management, such as electrolysis for hydrogen production, chemical synthesis of hydrocarbons (e.g., by the Fischer-Tropsch process), and CCS, are water intensive and could offset water savings from fuel switching. Ultimately, water use (and related quality), temporal, and locational needs, depend heavily on the mix of resources and processes used to achieve net-zero emissions.285,286,287
Labor
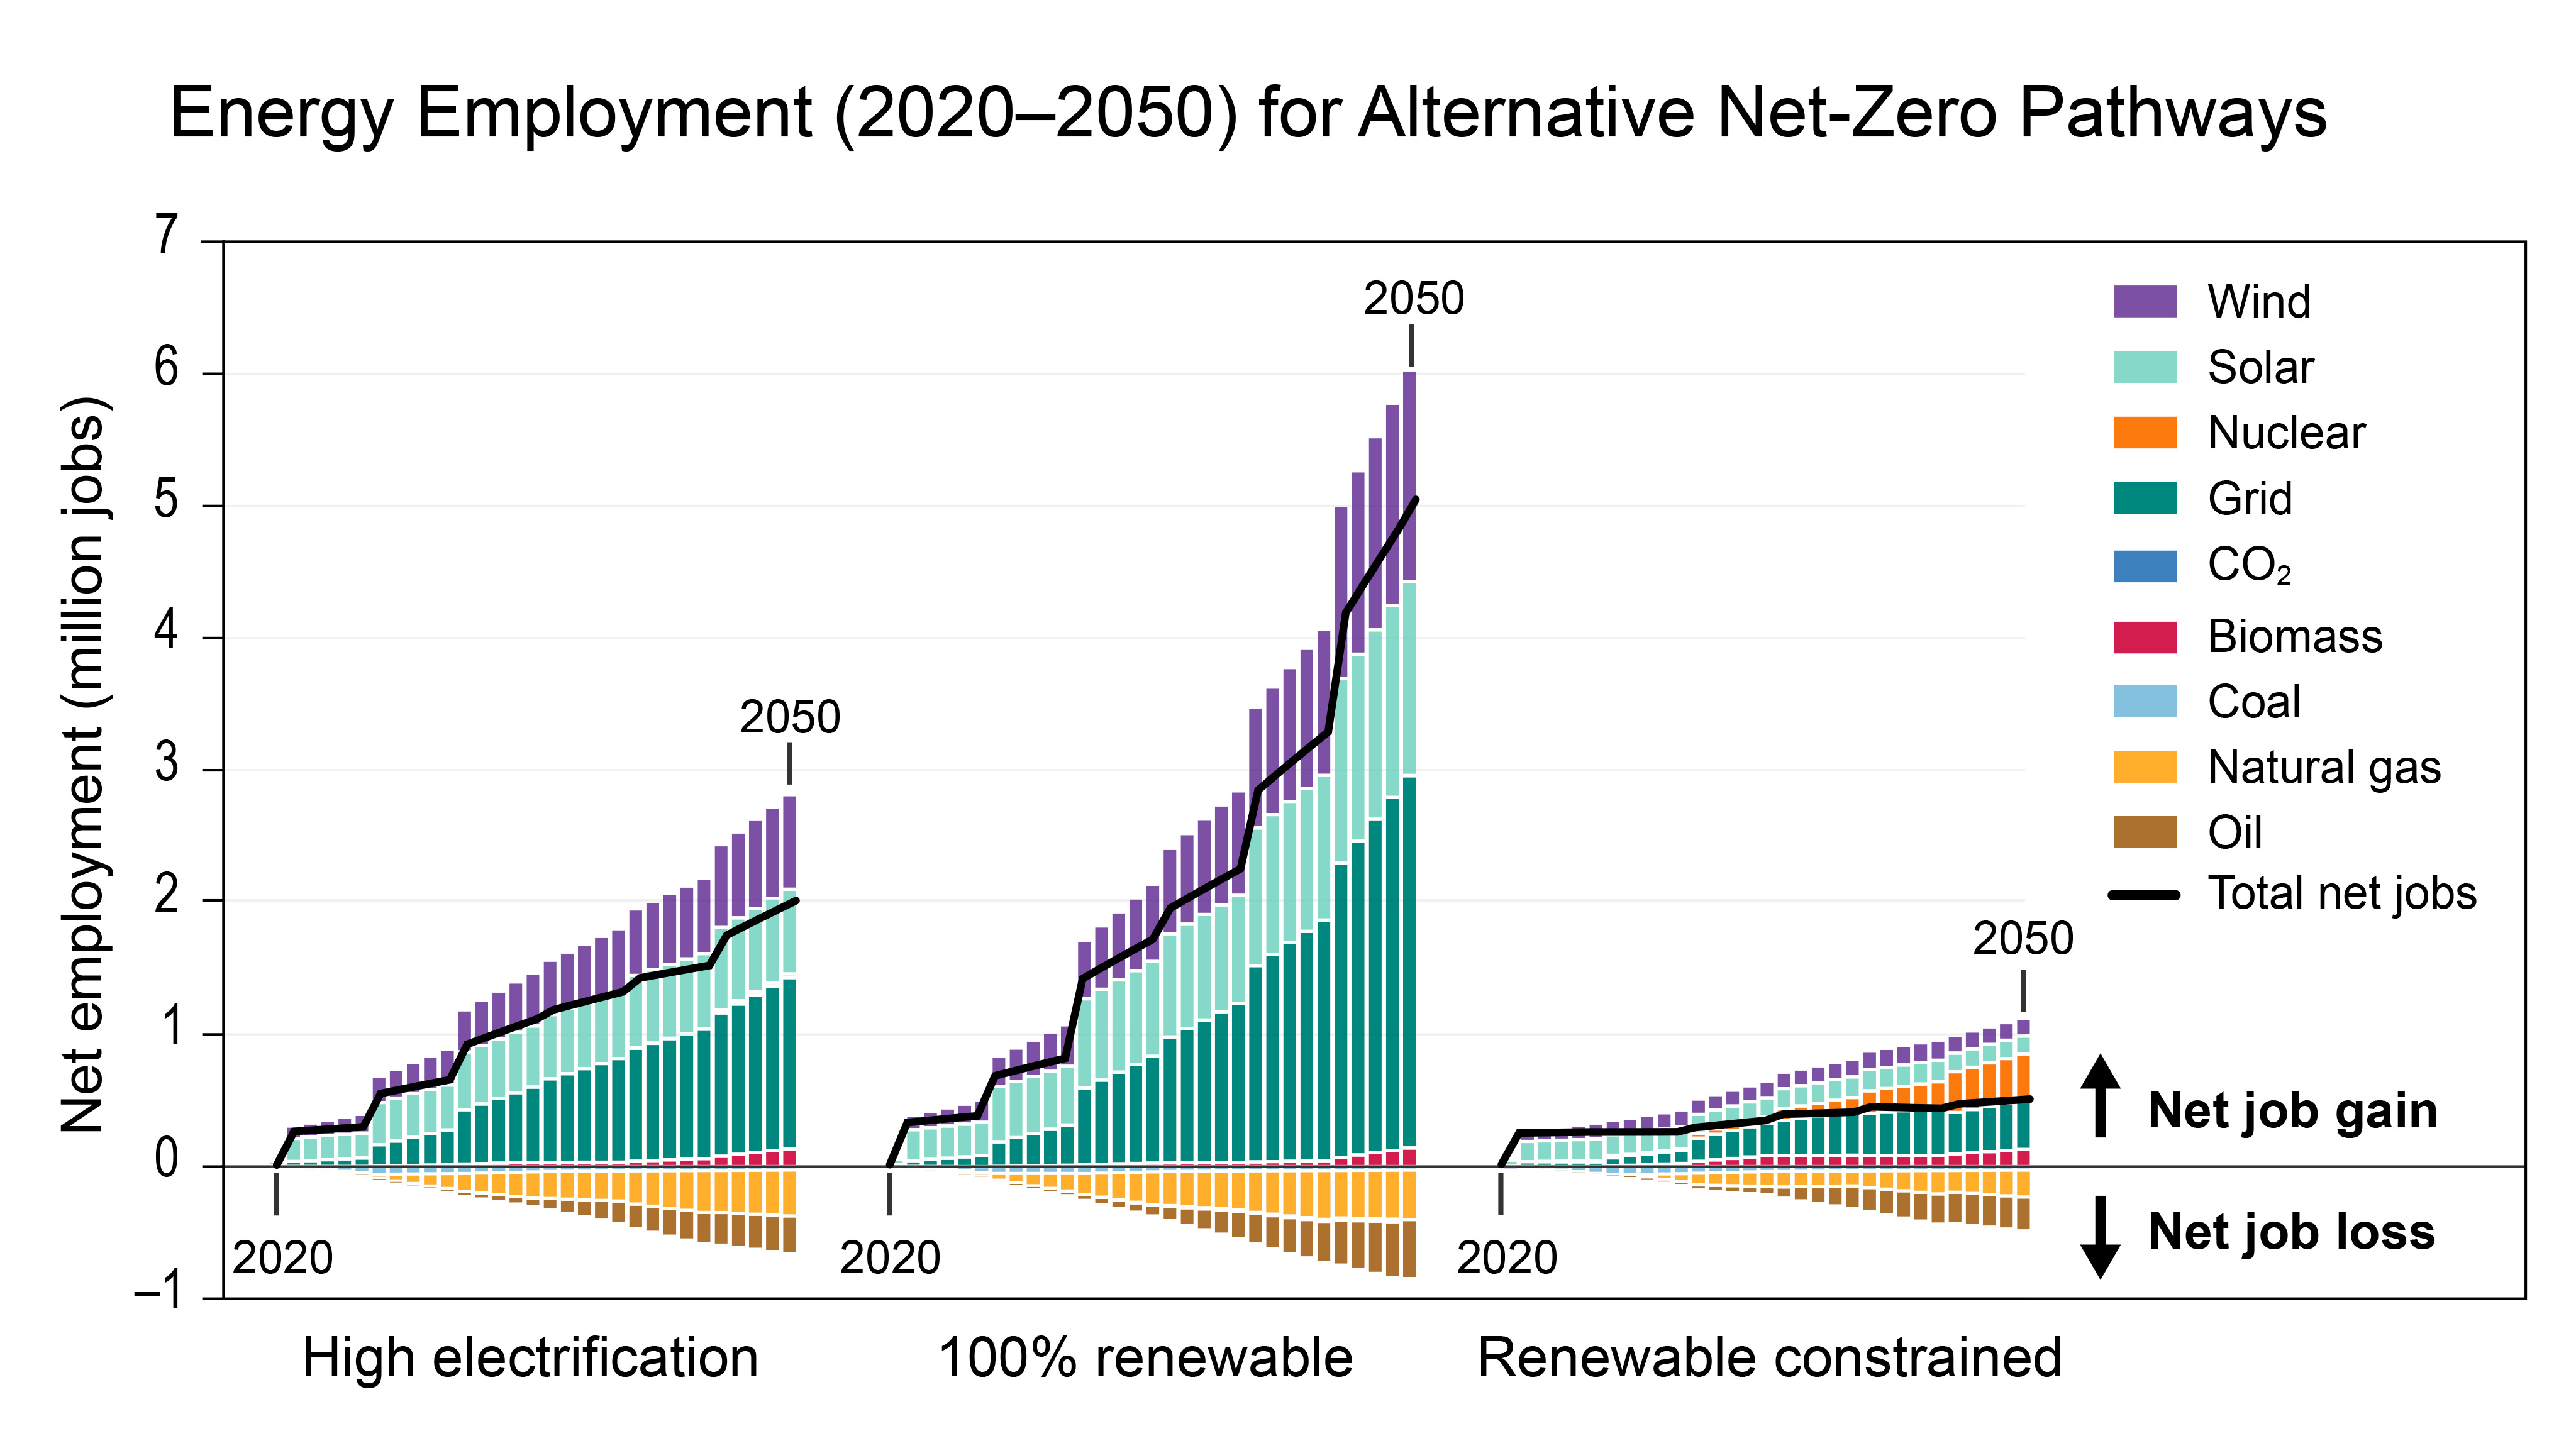
The productivity, supply, and disposition of labor, in addition to national discourse and community-level support and concern regarding labor, has the potential to accelerate or constrain mitigation efforts. Nearly 8 million Americans were directly employed in energy-related jobs in 2021, comprising roughly 5% of the total labor force.289,290 Of those 8 million energy-related jobs, approximately 41% were in net-zero-emissions-aligned areas in 2022.291 Energy-related jobs tend to be geographically concentrated in certain states and communities (Figure 32.17). More than 10% of the labor force in 150 counties (of 3,142) is directly employed in energy-related jobs289,292,293—often the production of coal, oil, and gas—but employment in mitigation-related activities is growing and is already high in many counties (e.g., energy efficiency in Vermont, wind installations in the Southern Great Plains; KM 26.2).
Reaching net-zero emissions in the United States by 2050 would generate jobs related to manufacturing and deployment of new infrastructure but reduce fossil fuel–related jobs.294 Many analyses find that employment and wage losses in fossil fuel sectors would be entirely offset (in aggregate) by increases in low-carbon resource industries.294,295,296,297,298 The number and local distribution of mitigation-related jobs will depend on the ultimate mix of energy sources, siting and investment decisions, labor supply constraints, the extent of domestic manufacturing, and political bargaining; however, decarbonization could lead to long-term expansion in the energy workforce in most states, even when accounting for increased worker productivity (which is often an underlying assumption in technology cost projections). Large-scale and sustained workforce development programs, high-road labor practices and policies, and corresponding federal support could accelerate a transition to net-zero emissions.294,299
However, there is already evidence of hiring difficulties in energy labor markets,292 portending labor supply bottlenecks in the absence of counteracting policies. Although there is public support for employment benefits related to climate mitigation,295 there is also evidence of mistrust associated with historical energy-related job creation narratives.300 Moreover, there are existing racial and gender disparities in the energy workforces.292
Meanwhile, despite policy and political discourse regarding just transitions for fossil fuel workers,295,301,302 many fossil fuel–dependent communities have experienced large declines in employment.27,303,304 Moreover, former fossil fuel workers often relocate because their skills are not always transferable to other local industries, and nearby communities lose tax revenues that support public infrastructure and social services (KM 26.2).305,306 Going forward, domestic policies that consider when and where workforces in declining energy industries could fill new jobs in emerging energy sectors (e.g., natural gas and carbon capture supply chains; coal mining; and solar manufacturing) have the potential to moderate labor supply bottlenecks, concentrated unemployment, and low-carbon boom-and-bust cycles. Where there is flexibility in siting of infrastructure and allocation of funding, such funds might also be leveraged to build political support and more equitably distribute costs and benefits. For example, provisions in the Inflation Reduction Act of 2022 offer enhanced tax credits to clean energy projects that pay prevailing wages to workers and use registered apprentices,291 that manufacture and source materials domestically,307 and/or that are located in “energy communities” defined by thresholds in the share of fossil fuel–related jobs.308
Energy Equity and Environmental Justice
Social inequities in the United States are rooted in systemic discriminatory practices, such as redlining, that marginalize communities based on race or socioeconomics. Social equity involves several energy- and climate-related aspects of recognition, procedural, and distributional justice (KMs 23.4, 27.3).310,311 In the context of energy and climate decision-making, recognition justice refers to an understanding that certain individuals and groups are presently bearing, and have historically borne, disparate burdens related to our collective energy systems and may therefore require extra resources or mitigation efforts. Procedural justice considers who is involved and has influence in energy and climate decision-making processes, with the goal of ensuring that those who want to be included in decision-making processes—and especially those who will be affected by the outcomes—are meaningfully engaged through fair and inclusive procedures (see, e.g., KM 30.3 regarding mitigation informed by Indigenous Knowledge). Distributional justice refers to the allocation of benefits and burdens based on geography and sociodemographics, with the objective that no single population receives a disproportionate share of energy or climate harms (e.g., energy-related air pollution; KM 14.3) or benefits (e.g., access to low-carbon and efficient energy technologies or clean-tech jobs).
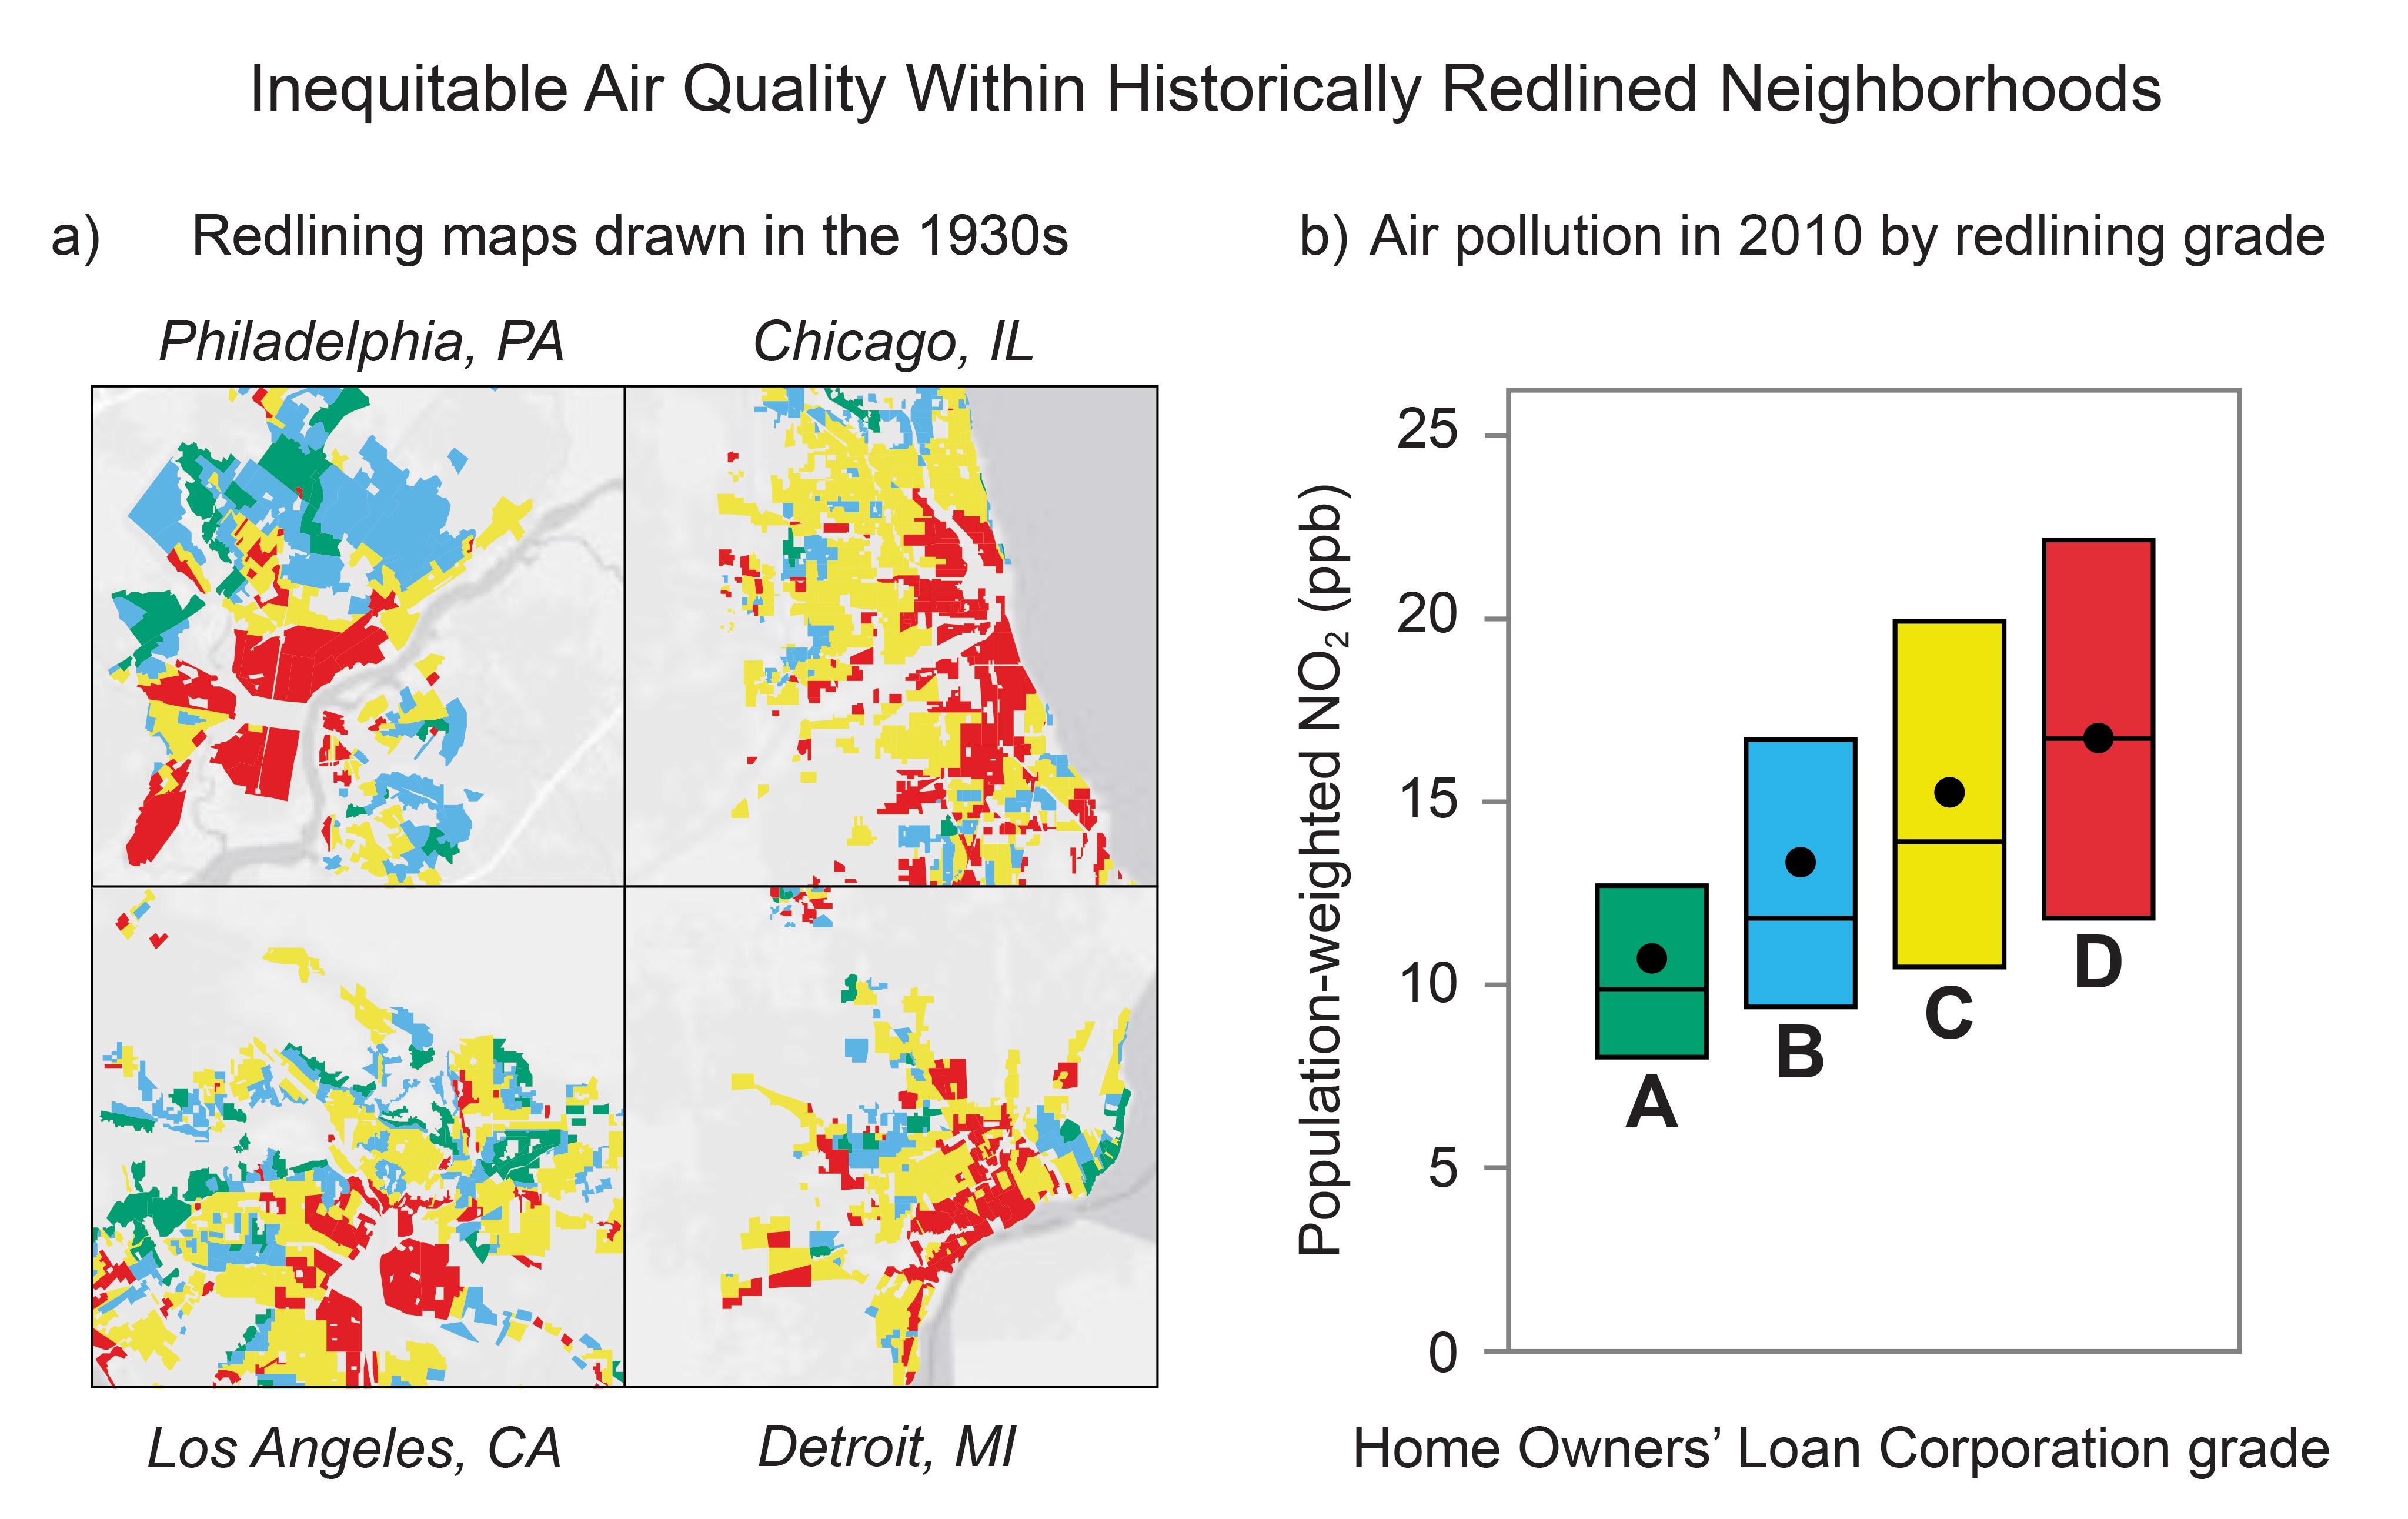
The disproportionate public health burdens of energy systems on communities of color and/or low-income communities, such as from vehicle emissions and power plants, have been extensively documented (Figure 32.18).312,313,314,315 Energy insecurity (e.g., regularly struggling to pay energy bills) also disproportionately affects low-income households, communities of color, rural and Indigenous communities, families with children, and older adults (Ch. 16).314,316,317,318,319,320,321 This disproportionate burden of energy insecurity reflects that Black Americans, for example, are more likely to live in older homes that are less energy-efficient.318,319,322 Moreover, redlined areas often lack trees and green spaces to mitigate the urban heat island effect and thus experience higher summer temperatures than surrounding urban areas,323,324,325 which in turn increases energy demands and burdens326 and makes residents more susceptible to the adverse health effects of extreme heat (KM 15.3).326,327
Although environmental impacts and energy insecurity are not borne proportionately across social groups, it is possible to pursue mitigation options that also redress current and historical injustices. For example, low-income communities and communities of color could experience disproportionate improvements in air pollution.252,260 Energy equity considerations also include access to sufficient energy services,328,329 as well as reductions in energy burden or energy poverty,322,330,331 and the upfront costs of energy efficiency and low-carbon technologies.332 Mitigation efforts that increase the availability and affordability of energy services (including safe and comfortable temperatures) could improve energy equity outcomes. For example, improving thermal efficiency of buildings would both reduce energy costs and help to maintain safe indoor thermal temperatures in the absence of functional air-conditioning.333
Studies have found that low-carbon and efficient technologies (e.g., electric vehicles, solar panels, battery storage, and LED lightbulbs) tend to be disproportionately owned by—and the financial incentives for such are received by—higher-income, more educated, and White households.312,313,314,334 Job opportunities in clean energy have also tended to exclude women and people of color.335 Moreover, insofar as mitigation increases energy costs, more households will experience energy poverty, and energy inequities may get worse.336,337 In addition, changes in the type, timing, and cost of energy needed to provide safe and comfortable temperatures under climate change and anticipated electrification patterns may exacerbate health risks, financial energy burdens, and other measures of energy equity.328,336
Supply Chains, Energy Security, and Geopolitics
Climate mitigation efforts may drastically increase domestic and global demand for products (e.g., solar photovoltaics, batteries, electric motors, wind turbines) and metal and mineral resources (e.g., lithium, nickel, cobalt, copper), which may have implications for supply security, markets, advanced manufacturing (e.g., robotics and EVs), geopolitics, and mining (Focus on Risks to Supply Chains).338,339,340,341 Moreover, in the United States there are currently 50 listed critical minerals (up from 35 in 2018),342,343 defined as those essential to economic or national security and whose supply chains are vulnerable to disruption (Figure 32.19). With increased demand as the system decarbonizes, there could be near-term shortages in several minerals and metals. Note that a series of executive orders anticipates this challenge and calls for monitoring and reduction in US dependence on imported critical materials, for example, by increased recycling (e.g., Executive Order 13817, “A Federal Strategy to Ensure Secure and Reliable Supplies of Critical Minerals,”344 and Executive Order 13953, “Addressing the Threat to the Domestic Supply Chain from Reliance on Critical Minerals from Foreign Adversaries and Supporting the Domestic Mining and Processing Industries”345) and more resilient supply chains generally (Executive Order 14017, “America’s Supply Chains”; 6 see also Focus on Risks to Supply Chains; KMs 17.2, 18.1).

A wide range of actors across the US have been involved in efforts to accelerate clean energy transition and mitigate GHG emissions, including new legislation; rules, regulations, and executive orders; and voluntary actions. For example,
the US has committed under the Paris Agreement to reduce GHG emissions by 50%–52% in 2030 relative to 2005;
through the Bipartisan Infrastructure Law and the Inflation Reduction Act and relevant programs, there are federal subsidies to clean energy businesses and for household purchases of EVs and heat pumps;347
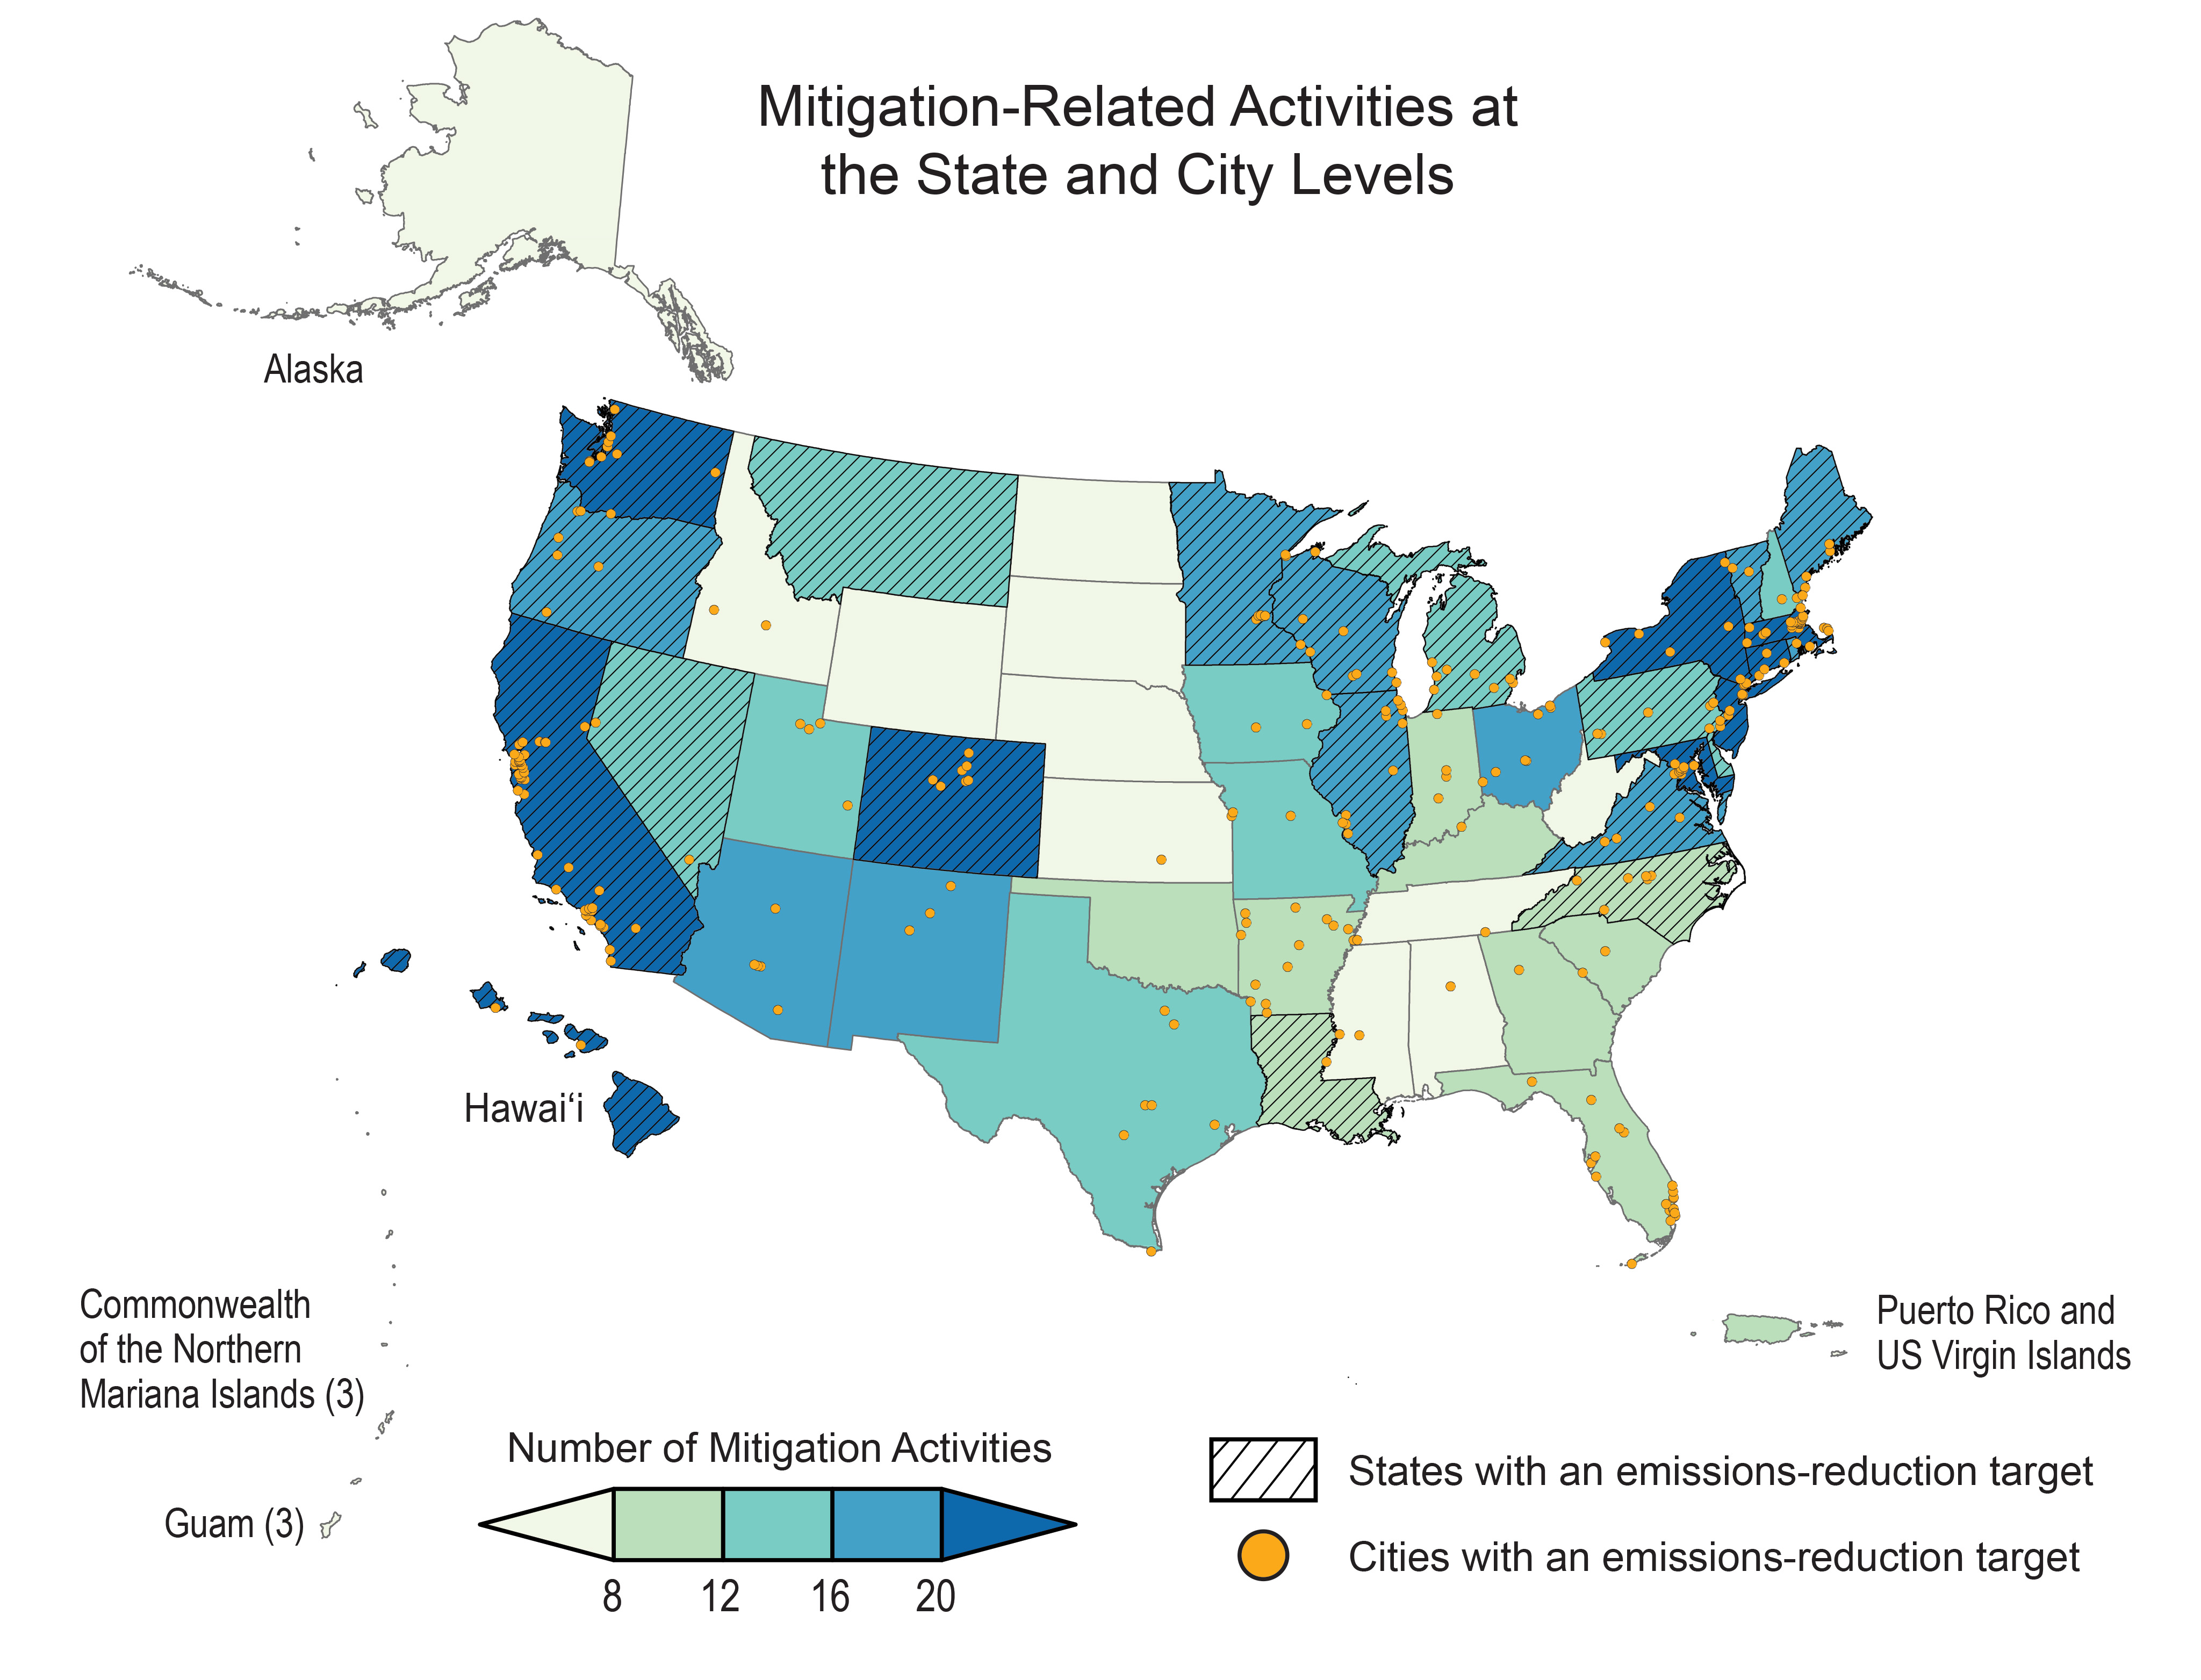
25 states,348 675 cities, 300 universities, and hundreds of companies have announced net-zero-emissions targets; and
bottom-up coalitions such as the America Is All In initiative have support from subnational leaders who represent a constituency of more than half the US population (see, e.g., KMs 21.4, 30.3).
Since 2018, the total number of state-level mitigation activities has increased by 83%, and 169 more cities have introduced emissions reduction targets since then (Figure 32.20; see also Ch. 12).349
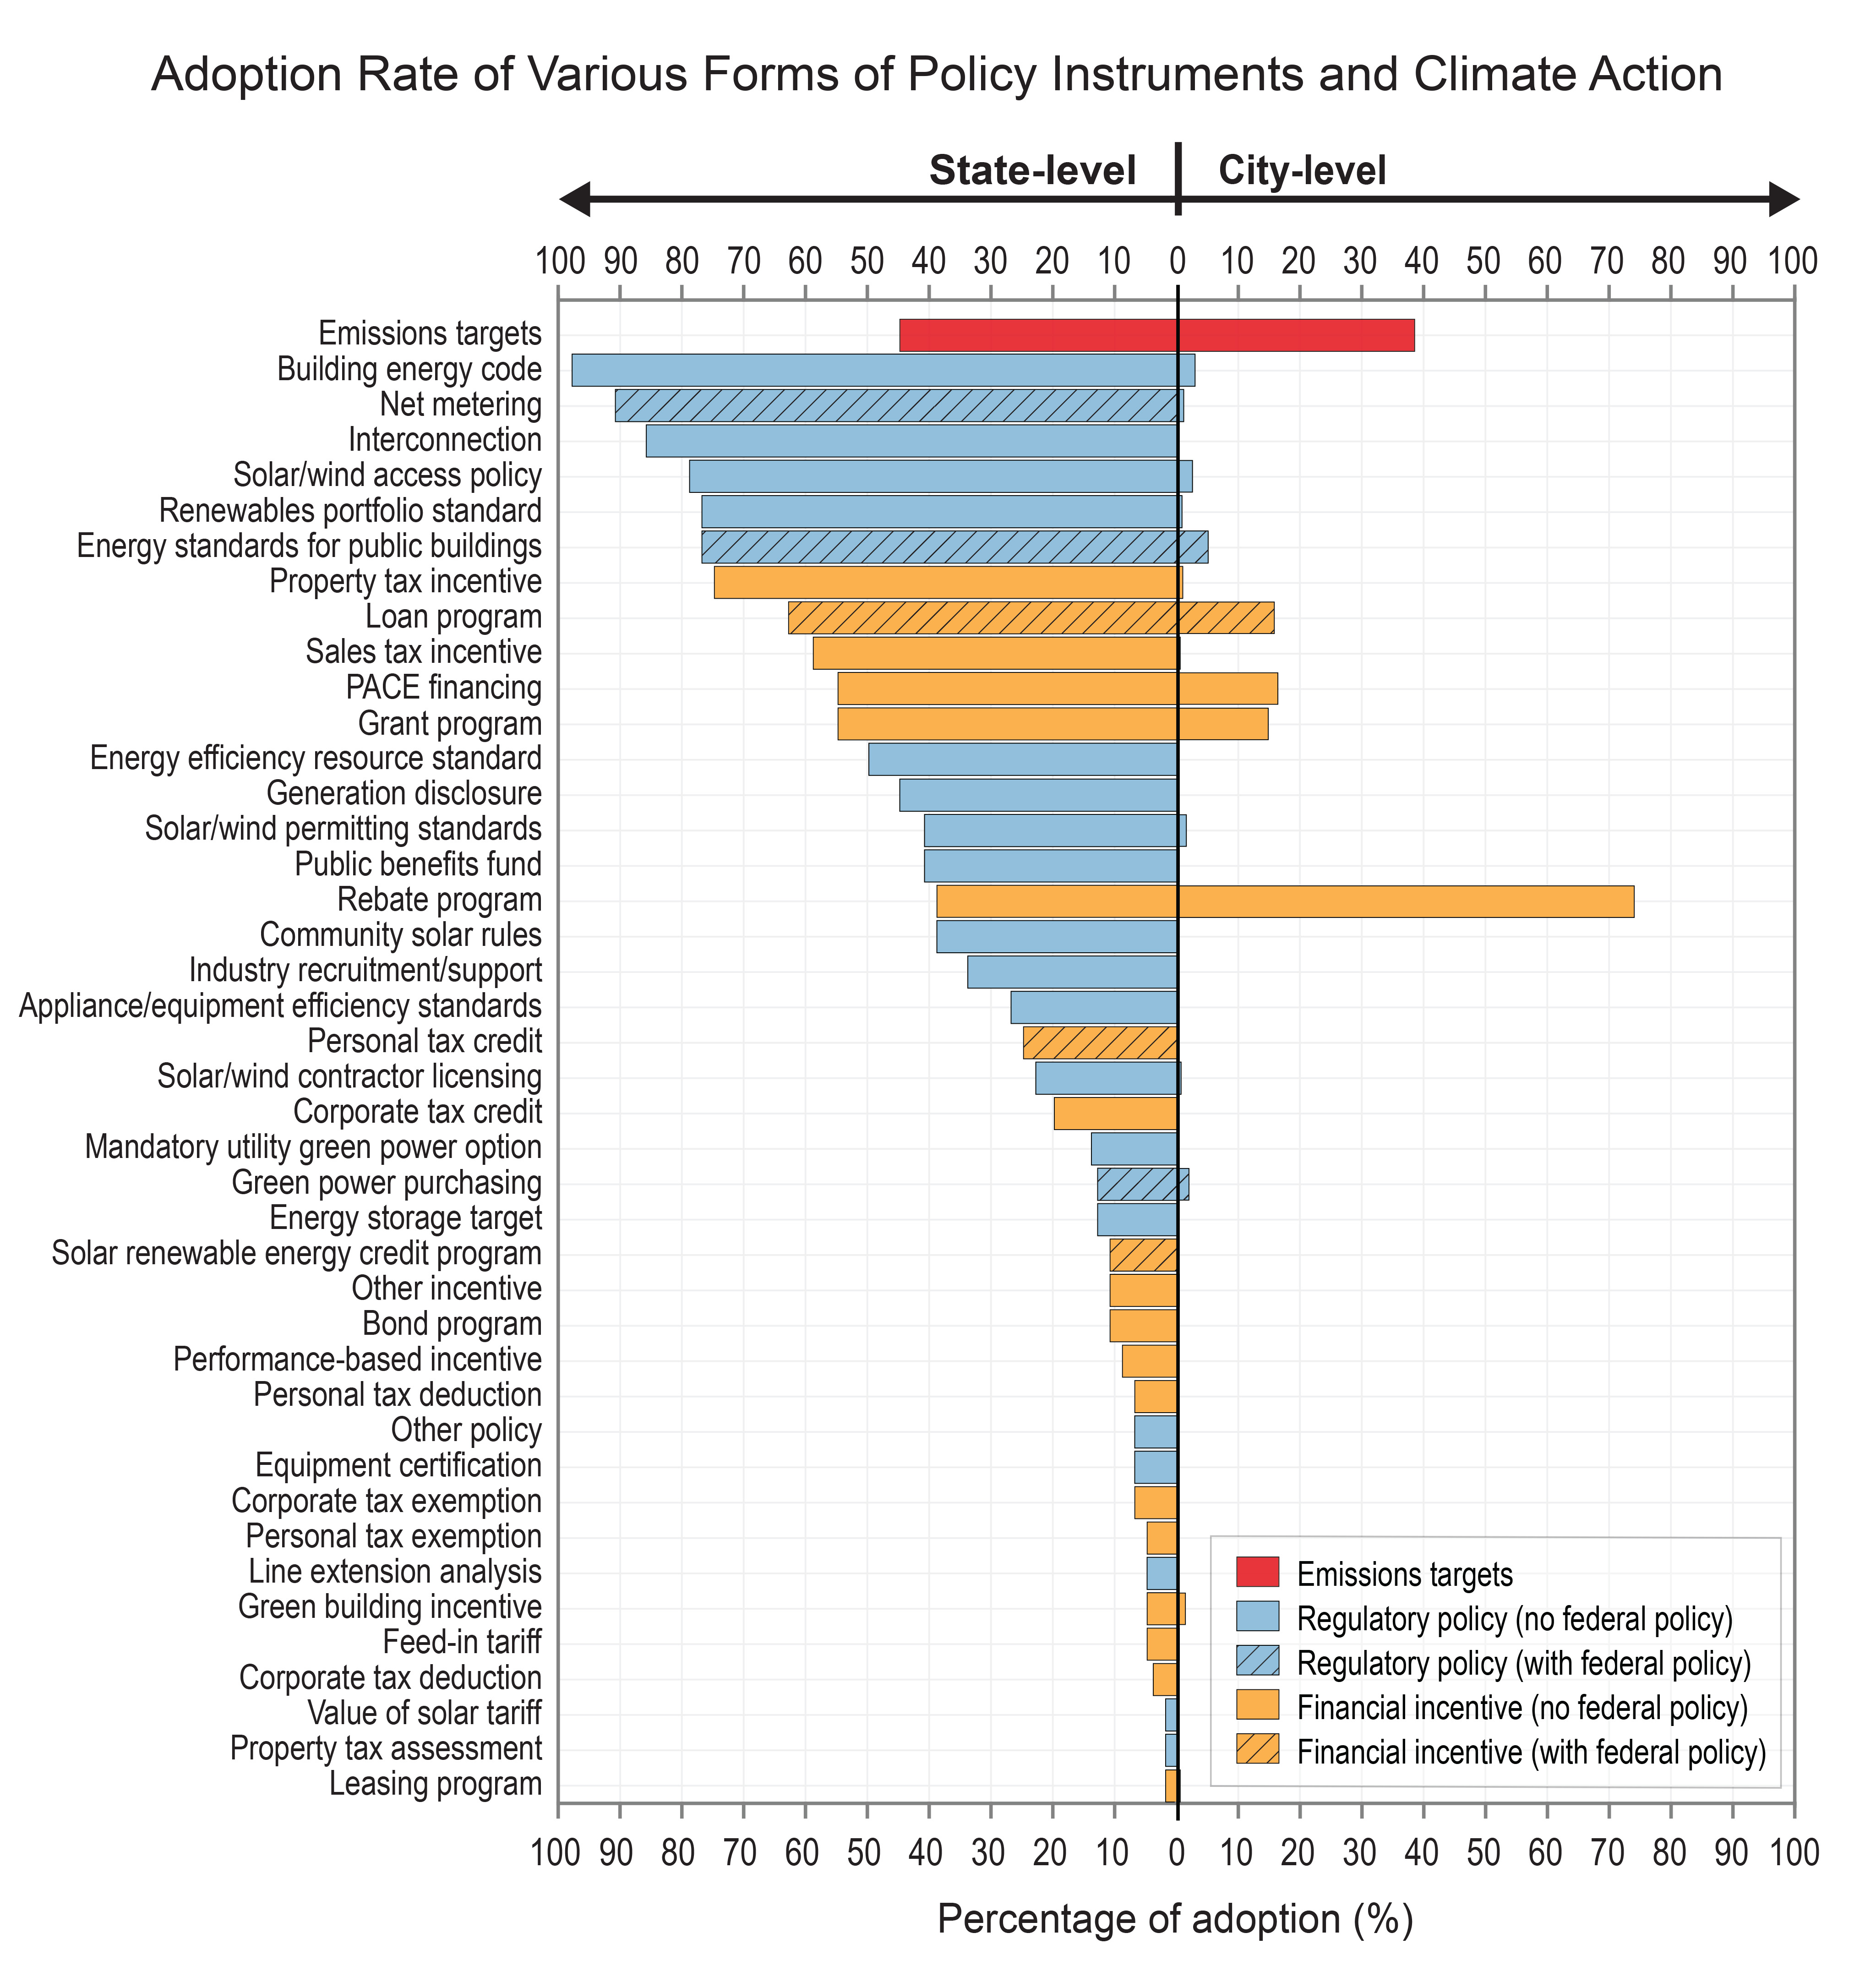
The pathways toward achieving these goals often include a broad collection of measures and policies, including investments in infrastructure and clean technologies that will require substantial capital, financial backing, and resource allocation. The feasibility and impact of these measures are dependent on local and regional factors, which are often reflected in more granular sector- or economy-specific mitigation targets and actions (see Figure 32.21).350
To this end, nearly 40 states have introduced renewable portfolio standards or voluntary renewable energy goals, which further guide and codify decarbonization efforts within the energy sector and induce incremental shifts toward increased penetration of renewable electricity (KM 32.1). Similarly, more than 30 local governments have enacted requirements for energy efficiency, ranging from building codes and benchmarking ordinances to establishing performance standards (see, e.g., KM 12.3). With federal corporate average fuel economy (CAFE) standards in place for vehicles, local transportation-sector efforts are often focused on behavioral mode-shift goals, such as promoting clean and public transport options and reducing vehicle-miles traveled. The proposed federal Agriculture Resilience Act is designed to address the adaptive needs of US farmers and consumers as a result of a changing climate, as well as to reduce the emissions associated with agricultural production.351 In addition, the Securities and Exchange Commission is in the process of finalizing new rules that would require public companies to disclose greenhouse gas emissions related to their operations and supply chains, as well as climate risks to their business.352 Such rules would build on the voluntary reporting and reduction efforts of corporations under the Carbon Disclosure Project; Science Based Targets initiative; and Environmental, Social, and Corporate Governance frameworks and will need to be supported by improved accounting protocols and focused scientific research.175,353,354,355,356
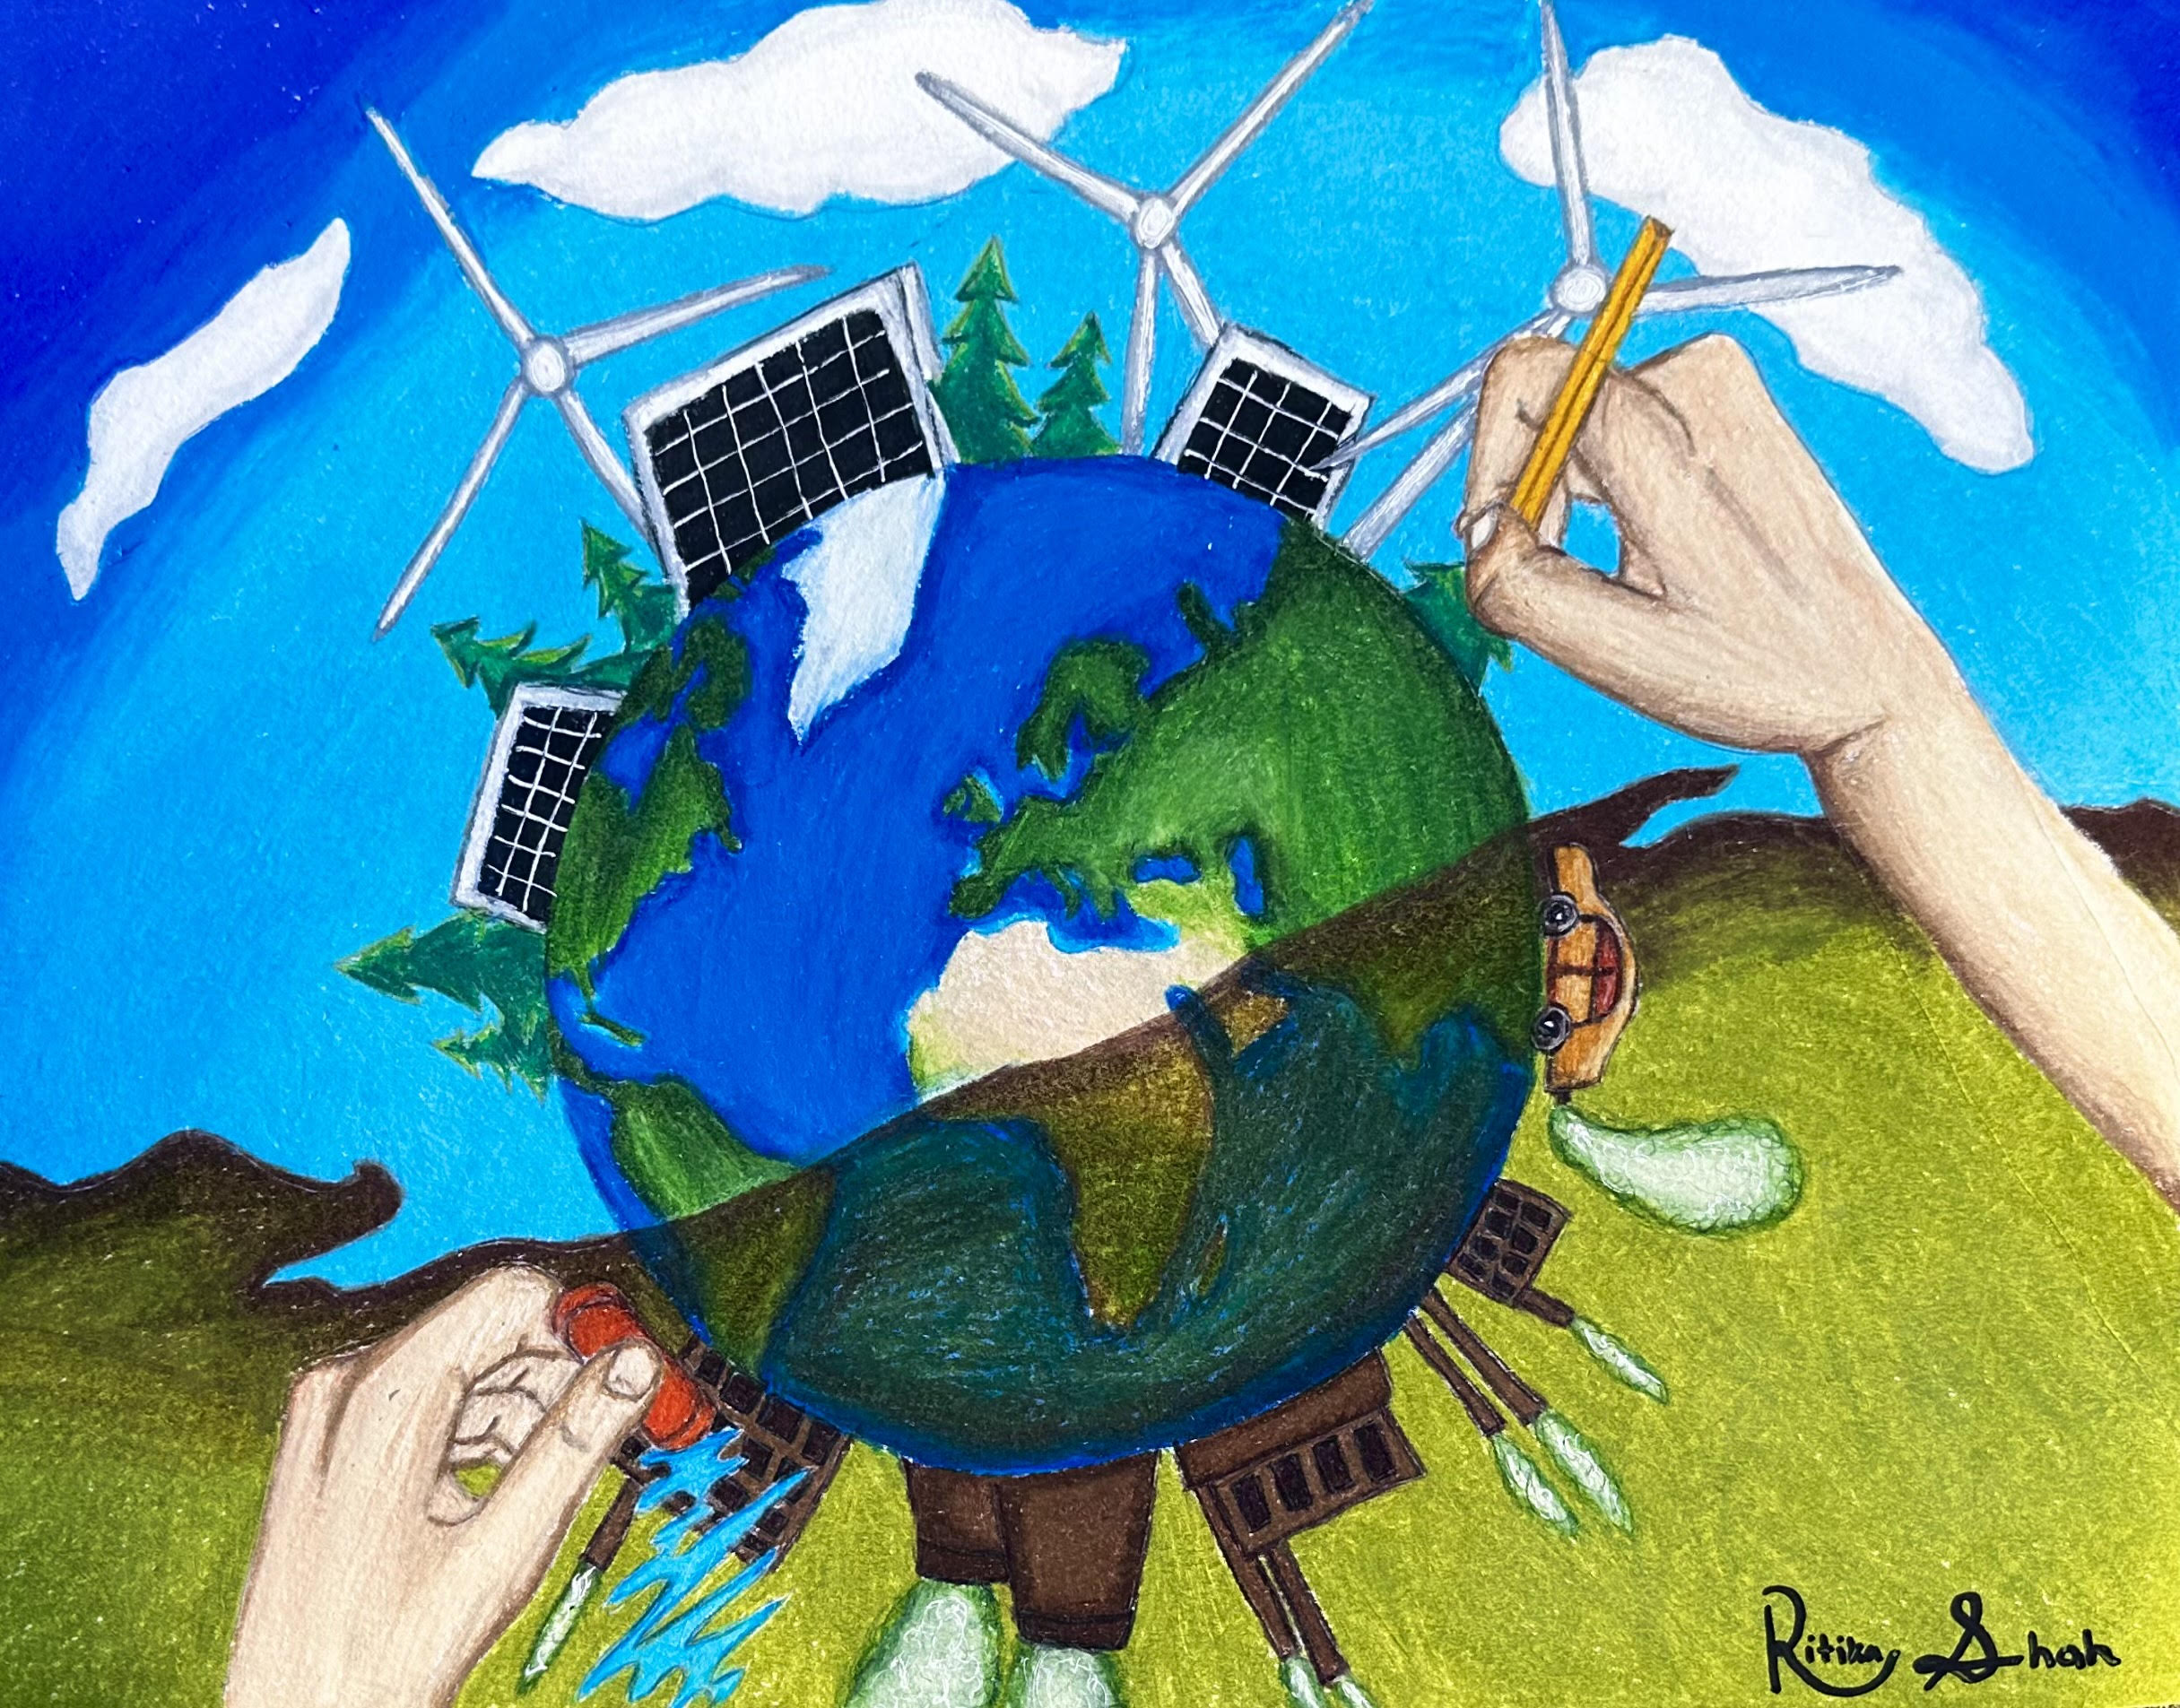
Ritika S.
Youth Entry, Grade 8
Redrawing The Earth
(2023, colored pencil)
Artist’s statement: In my art, I try to convey that we can help reverse the effects of climate change. One hand is erasing the pollution caused by industrialization the world over, and the other is redrawing actions to restore the Earth’s beauty. I have always tried to help out the Earth, through stream clean ups and more. I hope people learn from my art that they can help change the world by just doing simple things like driving less, not littering, and maybe even setting up solar panels or wind turbines. The effects of climate change are only in our hands, so we should do whatever we can to help.
View the full Art × Climate gallery.
Artworks and artists’ statements are not official Assessment products.
Beyond goal-setting and implementing regulatory measures, the enabling of financial mechanisms is often a core element of mitigation strategy. Regional cap-and-trade programs utilize a system of accountability and performance to incentivize emissions reductions at the electricity-generation level. Meanwhile, federal subsidies, such as those provided to clean energy businesses and tax credits for electric vehicle purchases, can bolster behavior change.55 By enabling access to financial capital—whether within the government, commercial, or residential sectors—investments in infrastructure and the built environment, as well as research and development, may further drive these advances.
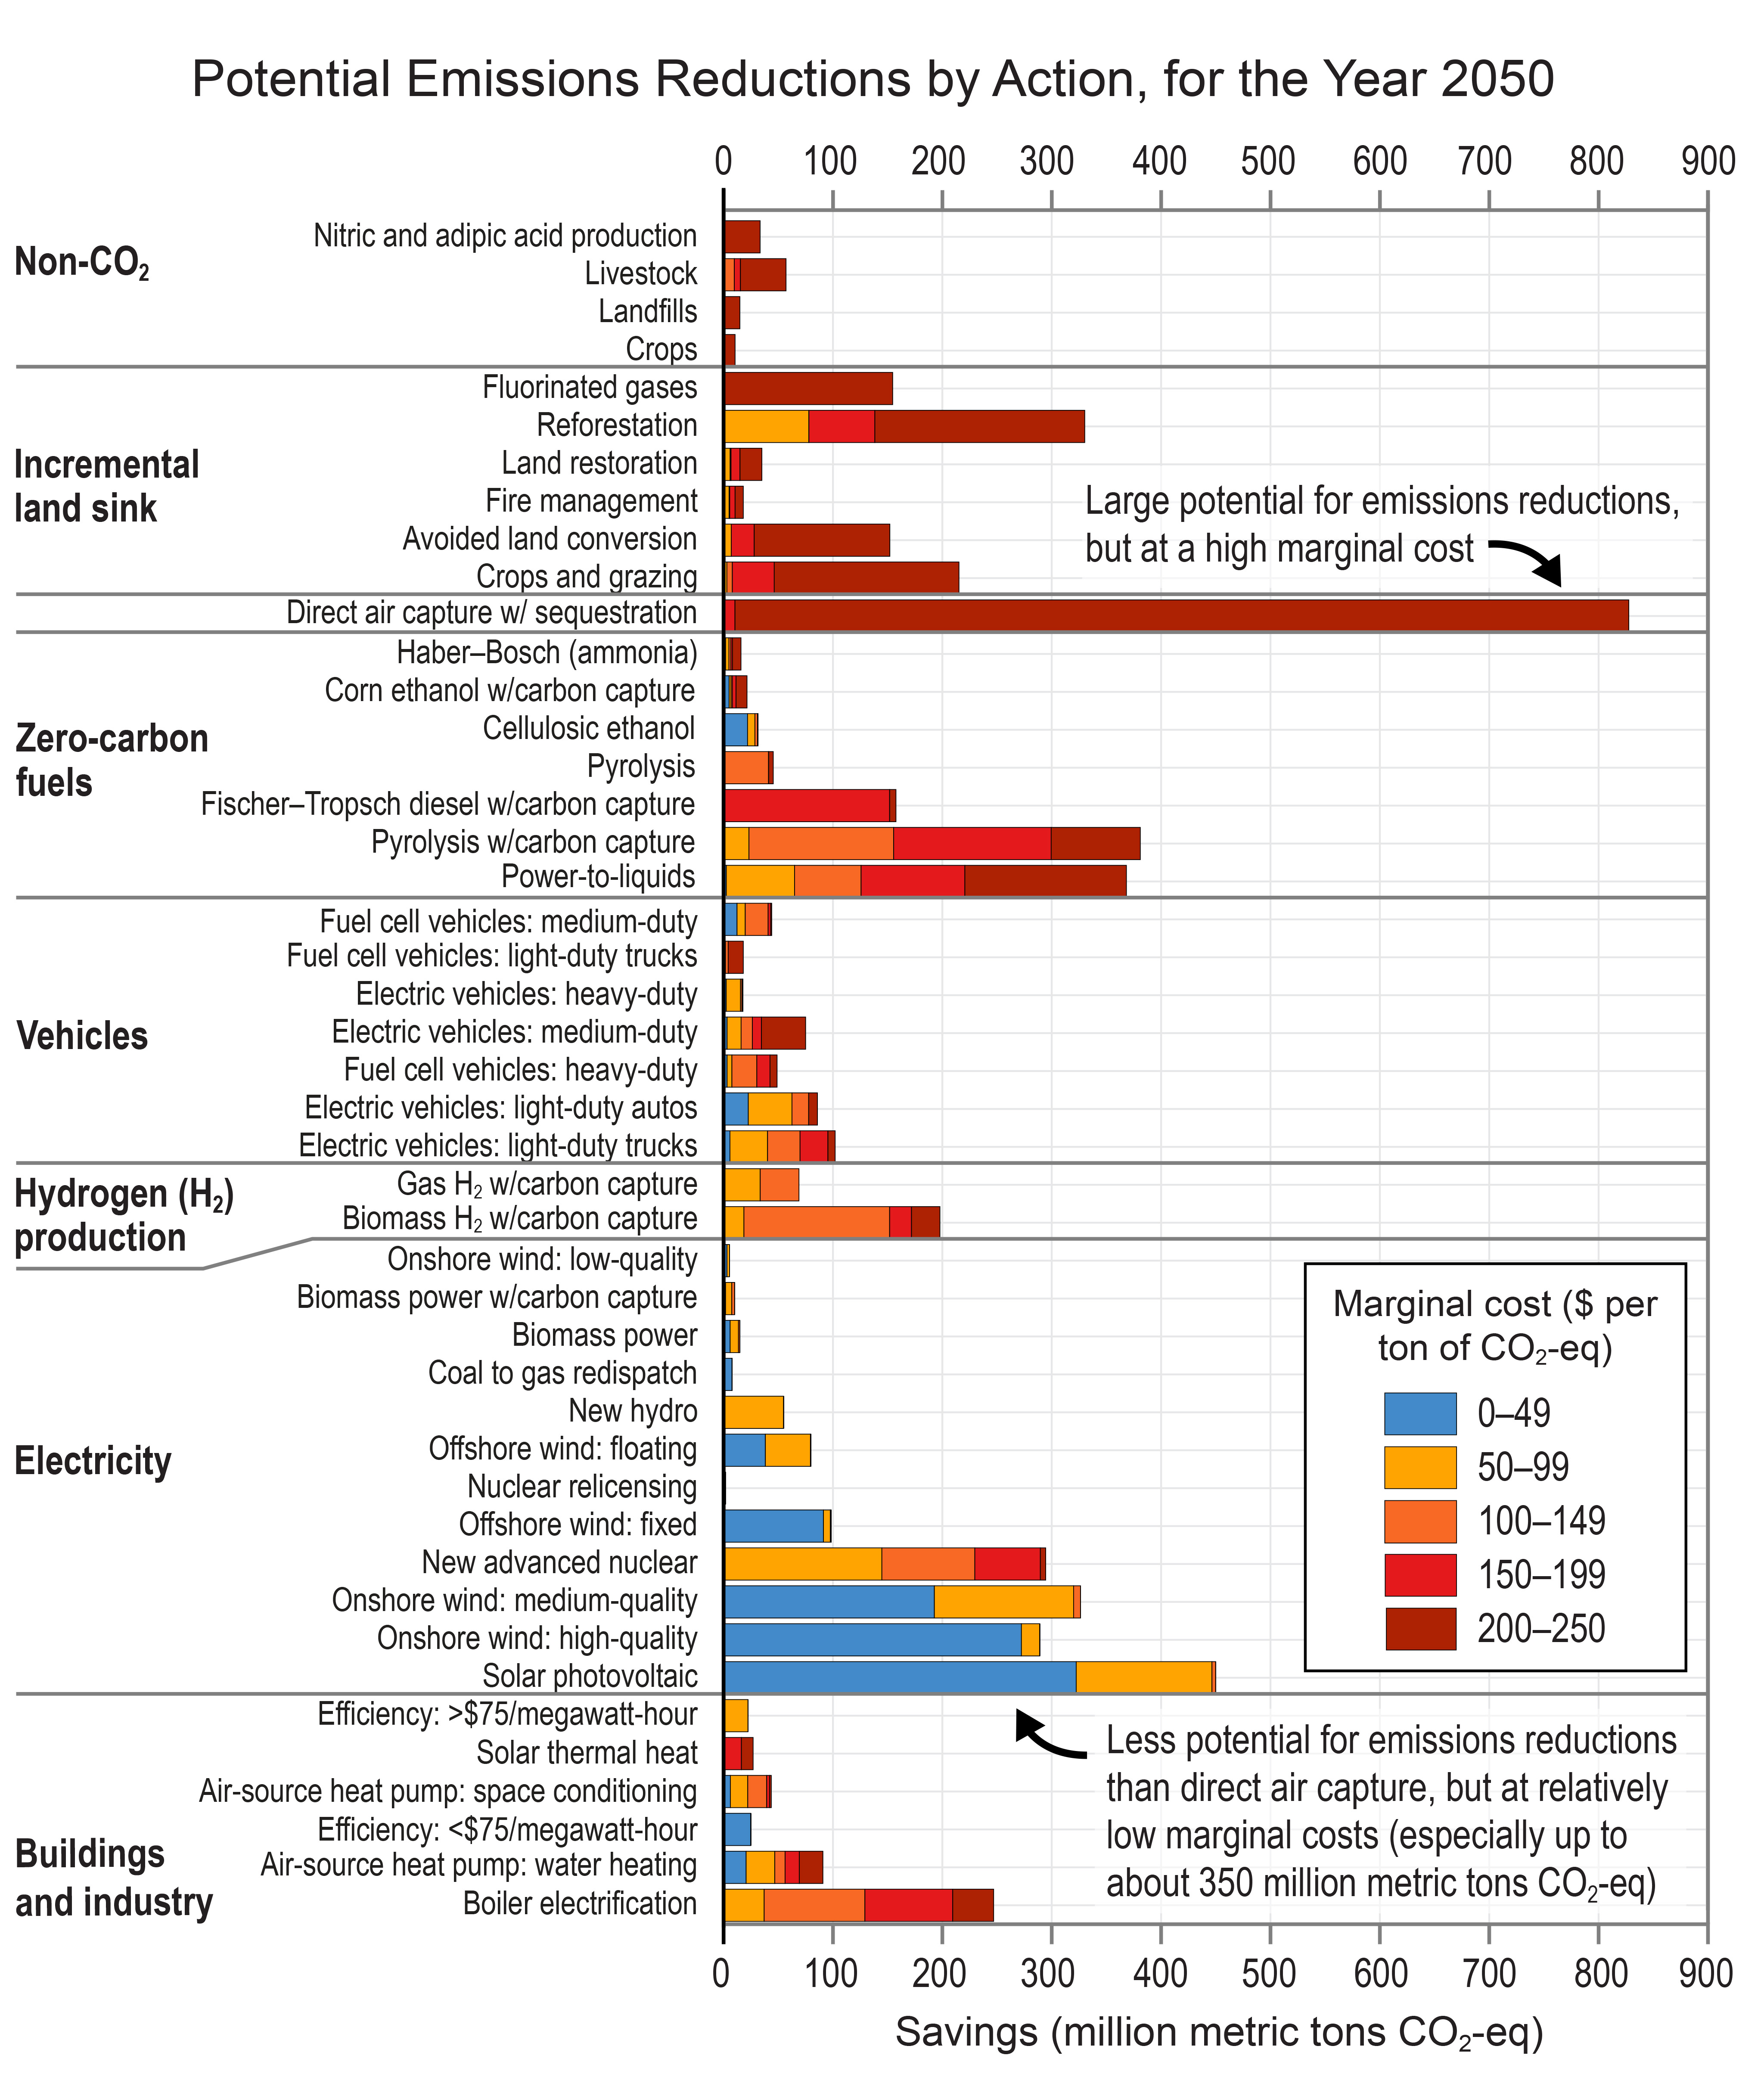
Available mitigation strategies vary in terms of emissions-reduction potential and costs (Figure 32.22), as well as in environmental, technical, and social implications (Figure 32.23). However, with the advancement of measurement technologies and insights gained from the deployment of various actions taken in vastly different environments, there is now more empirical evidence to inform strategy design for a given community (see regional chapters for examples of state, city, community, and Tribal mitigation actions; e.g., Box 21.1; KM 30.3). Additionally, more jurisdictions are adopting community-driven and holistic approaches to climate action planning, incorporating practices that address equitable access to information (including considerations for languages used and internet access) and events (including transportation vouchers, food and childcare provisions, and payment for subject-matter expertise to community members with lived experience), with a goal of improving and increasing capacity and ability to influence decision-making and, ultimately, assisting elected leaders in making the best-informed and most-impactful decisions for their unique communities.357,358,359
Process Description
Based on their own experience, nominations, and relevant recent literature, the chapter lead author and federal coordinating lead author discussed and selected a set of experts to invite as authors, seeking diverse representation of topical expertise, disciplinary perspectives, career stages, professional backgrounds, geographies, and demographics. Of 25 invitations, 16 were accepted, forming an author team with the requisite expertise to cover the chapter topics and provide a good balance of other characteristics. The author team began meeting regularly as a group and then divided into smaller working groups focused on different key topic areas, which also met regularly (all meetings were virtual, except for the in-person All-Author Meeting held in Washington, DC, in April 2023). During these meetings, the team worked together to develop key topic areas for the chapter, identify key literature and sources, and plan syntheses and figures for the chapter. The team also planned the public engagement workshop for the chapter and afterward discussed inputs and feedbacks from that workshop.
KEY MESSAGES
Successful Mitigation Means Reaching Net-Zero Emissions
Greenhouse gas emissions in the United States decreased by 12% between 2005 and 2019, mostly due to replacing coal-fired electricity generation with natural gas–fired and renewable generation . However, US net greenhouse gas emissions remain substantial and would have to decline by more than 6% per year on average, reaching net zero around midcentury, to meet current national climate targets and international temperature goals .
Read about Confidence and Likelihood
Description of Evidence Base
The assessment and summary of the sources and trends of US greenhouse gas emissions relies primarily on inventories and estimates from the EPA,8,9 supplemented by socioeconomic, energy activity, and agricultural production data from official sources such as the US Energy Information Administration (EIA)19,368,369,370,371 and the World Bank.372,373 EPA estimates of energy-related emissions are primarily based on tracked masses and volumes of combusted fuels (and in some case continuous emissions monitoring at point sources) publicly reported to the EIA, EPA, or Bureau of Transportation Statistics. EPA estimates of land sector (i.e., land use, land-use change, and agricultural) emissions are primarily based on activity data (e.g., area of land converted, number and kinds of livestock, mass of fertilizer applied) and associated emissions factors that have been developed based on numerous case studies.12,374 Federal- and state-level greenhouse gases (GHG) targets were compiled from publicly available sources and are not uncertain.
Major Uncertainties and Research Gaps
Although there is no uncertainty as to the current emissions targets and it is well-established that global warming will be proportional to cumulative carbon dioxide (CO2) emissions (e.g., Matthews et al. 2009375), there is relatively little scientific literature and relatively few national and international goals that address long-term management of the climate after net-zero emissions have been achieved and into the 22nd century.376
Estimates of agricultural and fugitive non-CO2 GHG emissions have greater uncertainty because they are spatially heterogenous “area” sources that are more challenging to measure directly,98,377 as evidenced by discrepancies between “top-down” estimates of global methane emissions based on measurements of the atmosphere and “bottom-up” estimates based on activity data such as number and kinds of livestock and extent of rice cultivation.378,379 For this reason, these are active areas of research, and analysts are bringing to bear a variety of different and innovative tools and methods to reduce the uncertainty and prioritize mitigation efforts (e.g., Liu et al. 2022; Norooz Oliaee et al. 2022; Conrad et al. 2023380,381,382).
Description of Confidence and Likelihood
Based on the multiple sources of high-quality energy system data, the authors have very high confidence in both the overall magnitude of energy-related US GHG emissions from each major source and their relative changes over time. There is also broad agreement among dynamic vegetation models, bookkeeping models of land-use change, and atmospheric observations as to the magnitude of the US land sink in recent years,52 but the sink has been decreasing23 and future uptake by US forests will depend on management and climate change impacts, both of which are uncertain.22,181,383,384 Given current emissions levels and stated goals, however, the required rate of decrease is not in question. For these reasons, we have very high confidence in the statements made in the Key Message.
We Know How to Drastically Reduce Emissions
A US energy system with net-zero emissions would rely on widespread improvements in energy efficiency, substantial electricity generation from solar and wind energy, and widespread electrification of transportation and heating . Low-carbon fuels would still be needed for some transport and industry applications that are difficult to electrify . Land-related emissions in the US could be reduced by increasing the efficiency of food systems and improving agricultural practices and by protecting and restoring natural lands . Across all sectors, many of these options are economically feasible now .
Read about Confidence and Likelihood
Description of Evidence Base
The assessment of established options for reducing energy-related GHG emissions reflects a large body of literature and recent energy-system modeling,61,385 including a database of 40 US net-zero emissions scenarios.42,43 Although there are substantial differences in the cost-effective energy systems modeled in these scenarios depending on model design and key assumptions, the Key Message and text emphasize characteristics that are robust across most, if not all, of the scenarios.48,51,131,386,387,388
Major Uncertainties and Research Gaps
The assessment of established options for reducing land-related GHG emissions reflects a substantial literature, but there are few quantitative scenarios to support potential reductions.97,99,122,178,186,192,389,390,391 Instead, potential reductions are often extrapolated from the localized studies that are available. Further research is warranted to test key sensitivities in energy model scenarios and to quantitatively assess factors beyond cost, such as social and political acceptance of (or opposition to) changes in use of land and water resources and adoption of energy technologies, and the associated distribution of benefits and impacts (as well as other non-cost factors discussed in KM 32.4).
Description of Confidence and Likelihood
Across 40 of the most recent and detailed energy system scenarios of net-zero US emissions, produced by 14 independent models and assuming a wide range of costs and constraints, the share of final energy met by electricity increases from about 20% today to 43%–57% by 2050 (the 25th–75th percentile range; Figure 32.11), and solar and wind are consistently major sources of energy, typically ranging from 57%–80% of primary energy by 2050 (the 25th–75th percentile range; Figure 32.10). Yet fuels continue to be used across those scenarios for some transportation and industry applications. The robustness of these numbers despite many methodological differences gives us high confidence in the energy-related statements in the Key Message.
A large literature also supports the opportunities for large reductions in land-related emissions, giving us high confidence in the land-related statement in the Key Message.97,99,122,178,186,192,389,390,391
Current costs of technologies such as solar, wind, and electric vehicles and the projected large-scale deployment of these technologies in cost-optimized energy system models,42,43,46,67,392 as well as many studies demonstrating the potential cost savings of energy efficiency improvements,393,394 optimization of agricultural inputs,395 shifts in diet,97,99,396 and repair of leaky infrastructure, all give the authors similarly high confidence that many mitigation options are now cost-effective.
To Reach Net-Zero Emissions, Additional Mitigation Options Need to Be Explored
Although many mitigation options are currently available and cost-effective, the level and types of energy technologies and carbon management in net-zero-emissions energy systems depend on still-uncertain technological progress, public acceptance, consumer choice, and future developments in institutions, markets, and policies . Attractive targets for further research, development, and demonstration include carbon capture, utilization, and storage; long-duration energy storage; low-carbon fuels and feedstocks; demand management; next-generation electricity transmission; carbon dioxide removal; modern foods; and interventions to reduce industry and agricultural emissions .
Read about Confidence and Likelihood
Description of Evidence Base
The assessment of potential options for reducing energy-related GHG emissions reflects a large body of literature and recent energy system modeling, including a database of 40 US net-zero emissions scenarios,42,43 but this Key Message highlights that the scale and mix of energy technologies and mitigation options remain sensitive to assumed—and yet uncertain—costs and constraints. Similarly, the potential options for reducing land-related GHG emissions presented in this Key Message are not as well studied, and there is open debate about the efficacy and/or cost-effectiveness of, for example, different energy storage technologies,397,398 advanced nuclear technology,399,400 and carbon management options,53,169,401,402 as well as future agricultural productivity.403,404
Major Uncertainties and Research Gaps
We assign medium confidence to the list of attractive targets for further research, development, and demonstration because existing literature either disagrees as to the potential of these technologies or only a few studies have made the case that they have great potential. Where analyses disagree, it may be because their findings depend on assumptions regarding deeply uncertain aspects of economic development, human behavior, or technological innovation. In general, additional research is needed to quantitatively assess a greater number of emerging energy technologies and land management options, and especially work that incorporates the various non-cost factors discussed in Key Message 32.4.
Description of Confidence and Likelihood
We have high confidence that we do not yet know which net-zero-emissions energy system will be cost-optimal (or socially and politically acceptable) and that we do not know the ideal types or scales of carbon management to support net-zero emissions and sustainability more broadly.405,406 This is because there is substantial variation in the type and scale of energy and carbon management technologies deployed in model scenarios, long-term projections of technology costs span large ranges, and the social and political support for different mitigation efforts is unclear. Although the effectiveness and scalability of some of the approaches to reduce land-related non-CO2 emissions remain uncertain (e.g., soil amendments, livestock feed supplements), other options are becoming clear, such as managing manure, cover cropping, and decreasing nitrogen fertilizer applications. Thus, we have medium confidence as to the options for reducing these land-related non-CO2 emissions.
Mitigation Can Be Sustainable, Healthy, and Fair
Large reductions in US greenhouse gas emissions could have substantial benefits for human health and well-being . Mitigation is expected to affect pollution, the use of land and water resources, the labor force, and the affordability, reliability, and security of energy and food . An equitable and sustainable transition to net-zero-emissions energy and food systems in the United States could help redress legacies of inequity, racism, and injustice while maximizing overall benefits to our economy and environment .
Read about Confidence and Likelihood
Description of Evidence Base
The assessment of historical and future impacts of energy systems on, for example, water,280,281,284,285 air pollution,103,235,246,247,254,255 energy security,32,340 labor,234,248,294,299,306 and energy equity and environmental justice218,252,260,301,310,330 is based on a diverse and rapidly growing academic literature as cited in the chapter.
Major Uncertainties and Research Gaps
As mentioned in regard to other Key Messages, there is a lack of specific qualitative and quantitative analyses and decision-making tools regarding how mitigation may affect and be affected by energy equity, environmental justice, land use, labor, water, air pollution, and energy security in different places, times, and social, demographic, and political contexts.336 There is also a lack of analyses and tools to reflect interacting technological, social, political, and environmental uncertainties and choices to inform multistakeholder decision-making.407
Description of Confidence and Likelihood
An extensive literature demonstrates the potential health benefits of climate mitigation, especially in regard to related decreases in air pollution. Fewer but still numerous studies have shown that the cost and resource savings or net social benefits of many mitigation options can accrue to specific populations. We therefore have high confidence in the potential benefits to human health and well-being, including specific environmental and socioeconomic effects. However, the available research also gives us high confidence that the benefits of mitigation may be distributed unevenly in the absence of proactive efforts to ensure fairness.
Governments, Organizations, and Individuals Can Act to Reduce Emissions
Mitigation efforts can be supported by a range of actors and actions, from choices made by individuals to decisions made by businesses and local, Tribal, state, and national governments . Actions with significant near-term potential include sector-based policies accelerating deployment of low-carbon technologies, city-level efforts to promote public transportation and improve building efficiency, and individual behavioral changes to reduce energy demand and meat consumption .
Read about Confidence and Likelihood
Description of Evidence Base
Our assessment of possible actors and mitigation actions is drawn from both the actions represented in models and studies by researchers,408,409,410,411,412 as well as reports and databases that have compiled lists of past actions taken (e.g., the Center for Climate and Energy Solutions State Climate Policy Maps, North Carolina State University Database of State Incentives for Renewables & Efficiency, CDP States and Regions Climate Tracker, and United Nations Framework Convention on Climate Change Non-state Actor Zone for Climate Action dataset).348,413,414,415
Major Uncertainties and Research Gaps
No jurisdiction has yet transitioned from a fossil-based economy to a deeply decarbonized or net-zero-emissions one. Moreover, actions to start down that road may be different from those that reach the end of it.416,417 Future research may productively explore the limits of actions by certain groups or jurisdictions, and seek to assess where collaborations are necessary and most valuable to support mitigation.417,418
Description of Confidence and Likelihood
Public commitments made and actions already taken (as tracked by the sources cited in the evidence base above) give us high confidence that mitigation can be supported by a wide range of actors in a wide variety of ways. Historical progress in reducing emissions (e.g., US electricity emissions since 2007) and forward-looking modeling analyses give us similarly high confidence that substantial near-term potential in the US lies in actions to boost low-carbon technologies,51,256,387,419,420,421 moderate use of internal combustion vehicles,66,67,69 improved building efficiency,33,34 and diet shifts.97,99,396
- Arias, P.A., N. Bellouin, E. Coppola, R.G. Jones, G. Krinner, J. Marotzke, V. Naik, M.D. Palmer, G.-K. Plattner, J. Rogelj, M. Rojas, J. Sillmann, T. Storelvmo, P.W. Thorne, B. Trewin, K. Achuta Rao, B. Adhikary, R.P. Allan, K. Armour, G. Bala, R. Barimalala, S. Berger, J.G. Canadell, C. Cassou, A. Cherchi, W. Collins, W.D. Collins, S.L. Connors, S. Corti, F. Cruz, F.J. Dentener, C. Dereczynski, A. Di Luca, A. Diongue Niang, F.J. Doblas-Reyes, A. Dosio, H. Douville, F. Engelbrecht, V. Eyring, E. Fischer, P. Forster, B. Fox-Kemper, J.S. Fuglestvedt, J.C. Fyfe, N.P. Gillett, L. Goldfarb, I. Gorodetskaya, J.M. Gutierrez, R. Hamdi, E. Hawkins, H.T. Hewitt, P. Hope, A.S. Islam, C. Jones, D.S. Kaufman, R.E. Kopp, Y. Kosaka, J. Kossin, S. Krakovska, J.-Y. Lee, J. Li, T. Mauritsen, T.K. Maycock, M. Meinshausen, S.-K. Min, P.M.S. Monteiro, T. Ngo-Duc, F. Otto, I. Pinto, A. Pirani, K. Raghavan, R. Ranasinghe, A.C. Ruane, L. Ruiz, J.-B. Sallée, B.H. Samset, S. Sathyendranath, S.I. Seneviratne, A.A. Sörensson, S. Szopa, I. Takayabu, A.-M. Tréguier, B. van den Hurk, R. Vautard, K. von Schuckmann, S. Zaehle, X. Zhang, and K. Zickfeld, 2021: Technical summary. In: Climate Change 2021: The Physical Science Basis. Contribution of Working Group I to the Sixth Assessment Report of the Intergovernmental Panel on Climate Change. Masson-Delmotte, V., P. Zhai, A. Pirani, S.L. Connors, C. Péan, S. Berger, N. Caud, Y. Chen, L. Goldfarb, M.I. Gomis, M. Huang, K. Leitzell, E. Lonnoy, J.B.R. Matthews, T.K. Maycock, T. Waterfield, O. Yelekçi, R. Yu, and B. Zhou, Eds. Cambridge University Press, Cambridge, UK and New York, NY, USA, 33−144. https://doi.org/10.1017/9781009157896.002
- IPCC, 2022: Climate Change 2022: Mitigation of Climate Change. Contribution of Working Group III to the Sixth Assessment Report of the Intergovernmental Panel on Climate Change. Shukla, P.R., J. Skea, R. Slade, A. Al Khourdajie, R. van Diemen, D. McCollum, M. Pathak, S. Some, P. Vyas, R. Fradera, M. Belkacemi, A. Hasija, G. Lisboa, S. Luz, and J. Malley, Eds. Cambridge University Press, Cambridge, UK and New York, NY, USA. https://doi.org/10.1017/9781009157926
- Feijoo, F., G. Iyer, M. Binsted, and J. Edmonds, 2020: US energy system transitions under cumulative emissions budgets. Climatic Change, 162 (4), 1947–1963. https://doi.org/10.1007/s10584-020-02670-0
- Schaeffer, R., A. Köberle, H.L. van Soest, C. Bertram, G. Luderer, K. Riahi, V. Krey, D.P. van Vuuren, E. Kriegler, S. Fujimori, W. Chen, C. He, Z. Vrontisi, S. Vishwanathan, A. Garg, R. Mathur, S. Shekhar, K. Oshiro, F. Ueckerdt, G. Safonov, G. Iyer, K. Gi, and V. Potashnikov, 2020: Comparing transformation pathways across major economies. Climatic Change, 162 (4), 1787–1803. https://doi.org/10.1007/s10584-020-02837-9
- van Soest, H.L., M.G.J. den Elzen, and D.P. van Vuuren, 2021: Net-zero emission targets for major emitting countries consistent with the Paris Agreement. Nature Communications, 12 (1), 2140. https://doi.org/10.1038/s41467-021-22294-x
- Executive Office of the President, 2021: Executive Order 14017: America’s supply chains. Federal Register, 86 (38), 11849–11854. https://www.federalregister.gov/documents/2021/03/01/2021-04280/americas-supply-chains
- DOS and EOP, 2021: The Long-Term Strategy of the United States: Pathways to Net-Zero Greenhouse Gas Emissions by 2050. U.S. Department of State and U.S. Executive Office of the President, Washington, DC. https://www.whitehouse.gov/wp-content/uploads/2021/10/us-long-term-strategy.pdf
- EPA, 2022: Inventory of U.S. Greenhouse Gas Emissions and Sinks: 1990–2020. EPA 430-R-22-003. U.S. Environmental Protection Agency. https://www.epa.gov/ghgemissions/inventory-us-greenhouse-gas-emissions-and-sinks-1990-2020
- EPA, 2023: Inventory of U.S. Greenhouse Gas Emissions and Sinks: 1990–2021. EPA 430-R-23-002. U.S. Environmental Protection Agency. https://www.epa.gov/ghgemissions/draft-inventory-us-greenhouse-gas-emissions-and-sinks-1990-2021
- Davis, S.J., Z. Liu, Z. Deng, B. Zhu, P. Ke, T. Sun, R. Guo, C. Hong, B. Zheng, Y. Wang, O. Boucher, P. Gentine, and P. Ciais, 2022: Emissions rebound from the COVID-19 pandemic. Nature Climate Change, 12 (5), 412–414. https://doi.org/10.1038/s41558-022-01332-6
- Liu, Z., P. Ciais, Z. Deng, S.J. Davis, B. Zheng, Y. Wang, D. Cui, B. Zhu, X. Dou, P. Ke, T. Sun, R. Guo, H. Zhong, O. Boucher, F.-M. Bréon, C. Lu, R. Guo, J. Xue, E. Boucher, K. Tanaka, and F. Chevallier, 2020: Carbon Monitor, a near-real-time daily dataset of global CO2 emission from fossil fuel and cement production. Scientific Data, 7 (1), 392. https://doi.org/10.1038/s41597-020-00708-7
- IPCC, 2006: 2006 IPCC Guidelines for National Greenhouse Gas Inventories. Eggleston, S., L. Buendia, K. Miwa, T. Ngara, and K. Tanabe, Eds. Institute for Global Environmental Strategies, Hayama, Japan. https://www.ipcc.ch/report/2006-ipcc-guidelines-for-national-greenhouse-gas-inventories/
- Crippa, M., D. Guizzardi, E. Pisoni, E. Solazzo, A. Guion, M. Muntean, A. Florczyk, M. Schiavina, M. Melchiorri, and A.F. Hutfilter, 2021: Global anthropogenic emissions in urban areas: patterns, trends, and challenges. Environmental Research Letters, 16 (7), 074033. https://doi.org/10.1088/1748-9326/ac00e2
- Friedlingstein, P., M. O'Sullivan, M.W. Jones, R.M. Andrew, L. Gregor, et al., 2022: Global carbon budget 2022. Earth System Science Data, 14 (11), 4811–4900. https://doi.org/10.5194/essd-14-4811-2022
- IEA, 2023: Greenhouse Gas Emissions from Energy. International Energy Agency. https://www.iea.org/data-and-statistics/data-product/greenhouse-gas-emissions-from-energy
- Liu, Z., P. Ciais, Z. Deng, R. Lei, S.J. Davis, S. Feng, B. Zheng, D. Cui, X. Dou, B. Zhu, R. Guo, P. Ke, T. Sun, C. Lu, P. He, Y. Wang, X. Yue, Y. Wang, Y. Lei, H. Zhou, Z. Cai, Y. Wu, R. Guo, T. Han, J. Xue, O. Boucher, E. Boucher, F. Chevallier, K. Tanaka, Y. Wei, H. Zhong, C. Kang, N. Zhang, B. Chen, F. Xi, M. Liu, F.-M. Bréon, Y. Lu, Q. Zhang, D. Guan, P. Gong, D.M. Kammen, K. He, and H.J. Schellnhuber, 2020: Near-real-time monitoring of global CO2 emissions reveals the effects of the COVID-19 pandemic. Nature Communications, 11 (1), 5172. https://doi.org/10.1038/s41467-020-18922-7
- Feng, K., S.J. Davis, L. Sun, and K. Hubacek, 2015: Drivers of the US CO2 emissions 1997–2013. Nature Communications, 6 (1), 7714. https://doi.org/10.1038/ncomms8714
- Scott Institute for Energy Innovation, 2017: Power Sector Carbon Index. Carnegie Mellon University, Pittsburgh, PA. https://www.emissionsindex.org
- EIA, 2015: Residential Energy Consumption Survey. U.S. Energy Information Administration. https://www.eia.gov/consumption/residential/data/2015/
- Goldstein, B., D. Gounaridis, and J.P. Newell, 2020: The carbon footprint of household energy use in the United States. Proceedings of the National Academy of Sciences of the United States of America, 117 (32), 19122–19130. https://doi.org/10.1073/pnas.1922205117
- Anderegg, W.R.L., O.S. Chegwidden, G. Badgley, Anna T. Trugman, D. Cullenward, J.T. Abatzoglou, Jeffrey A. Hicke, J. Freeman, and J.J. Hamman, 2022: Future climate risks from stress, insects and fire across US forests. Ecology Letters, 25 (6), 1510–1520. https://doi.org/10.1111/ele.14018
- Domke, G.M., S.N. Oswalt, B.F. Walters, and R.S. Morin, 2020: Tree planting has the potential to increase carbon sequestration capacity of forests in the United States. Proceedings of the National Academy of Sciences of the United States of America, 117 (40), 24649–24651. https://doi.org/10.1073/pnas.2010840117
- Quirion, B.R., G.M. Domke, B.F. Walters, G.M. Lovett, J.E. Fargione, L. Greenwood, K. Serbesoff-King, J.M. Randall, and S. Fei, 2021: Insect and disease disturbances correlate with reduced carbon sequestration in forests of the contiguous United States. Frontiers in Forests and Global Change, 4, 716582. https://doi.org/10.3389/ffgc.2021.716582
- Lopez, A., B. Roberts, D. Heimiller, N. Blair, and G. Porro, 2012: U.S. Renewable Energy Technical Potentials: A GIS-Based Analysis. NREL/TP-6A20-51946. U.S. Department of Energy, National Renewable Energy Laboratory, Golden, CO. https://www.nrel.gov/docs/fy12osti/51946.pdf
- Shaner, M.R., S.J. Davis, N.S. Lewis, and K. Caldeira, 2018: Geophysical constraints on the reliability of solar and wind power in the United States. Energy and Environmental Science, 11 (4), 914–925. https://doi.org/10.1039/c7ee03029k
- Olson-Hazboun, S.K., P.D. Howe, and A. Leiserowitz, 2018: The influence of extractive activities on public support for renewable energy policy. Energy Policy, 123, 117–126. https://doi.org/10.1016/j.enpol.2018.08.044
- Grubert, E., 2020: Fossil electricity retirement deadlines for a just transition. Science, 370 (6521), 1171–1173. https://doi.org/10.1126/science.abe0375
- Shearer, C., D. Tong, R. Fofrich, and S.J. Davis, 2020: Committed emissions of the U.S. power sector, 2000–2018. AGU Advances, 1 (3), e2020AV000162. https://doi.org/10.1029/2020av000162
- Tong, D., D.J. Farnham, L. Duan, Q. Zhang, N.S. Lewis, K. Caldeira, and S.J. Davis, 2021: Geophysical constraints on the reliability of solar and wind power worldwide. Nature Communications, 12 (1), 6146. https://doi.org/10.1038/s41467-021-26355-z
- Stokes, L.C. and H.L. Breetz, 2018: Politics in the U.S. energy transition: Case studies of solar, wind, biofuels and electric vehicles policy. Energy Policy, 113, 76–86. https://doi.org/10.1016/j.enpol.2017.10.057
- Noblet, C.L., M.F. Teisl, K. Evans, M.W. Anderson, S. McCoy, and E. Cervone, 2015: Public preferences for investments in renewable energy production and energy efficiency. Energy Policy, 87, 177–186. https://doi.org/10.1016/j.enpol.2015.09.003
- Manley, D.K., V.A. Hines, M.W. Jordan, and R.E. Stoltz, 2013: A survey of energy policy priorities in the United States: Energy supply security, economics, and the environment. Energy Policy, 60, 687–696. https://doi.org/10.1016/j.enpol.2013.04.061
- Belussi, L., B. Barozzi, A. Bellazzi, L. Danza, A. Devitofrancesco, C. Fanciulli, M. Ghellere, G. Guazzi, I. Meroni, F. Salamone, F. Scamoni, and C. Scrosati, 2019: A review of performance of zero energy buildings and energy efficiency solutions. Journal of Building Engineering, 25, 100772. https://doi.org/10.1016/j.jobe.2019.100772
- Chen, S., G. Zhang, X. Xia, S. Setunge, and L. Shi, 2020: A review of internal and external influencing factors on energy efficiency design of buildings. Energy and Buildings, 216, 109944. https://doi.org/10.1016/j.enbuild.2020.109944
- Holz-Rau, C. and J. Scheiner, 2019: Land-use and transport planning – A field of complex cause-impact relationships. Thoughts on transport growth, greenhouse gas emissions and the built environment. Transport Policy, 74, 127–137. https://doi.org/10.1016/j.tranpol.2018.12.004
- Tayarani, M., A. Poorfakhraei, R. Nadafianshahamabadi, and G. Rowangould, 2018: Can regional transportation and land-use planning achieve deep reductions in GHG emissions from vehicles? Transportation Research Part D: Transport and Environment, 63, 222–235. https://doi.org/10.1016/j.trd.2018.05.010
- Neves, A. and C. Brand, 2019: Assessing the potential for carbon emissions savings from replacing short car trips with walking and cycling using a mixed GPS-travel diary approach. Transportation Research Part A: Policy and Practice, 123, 130–146. https://doi.org/10.1016/j.tra.2018.08.022
- Oeschger, G., P. Carroll, and B. Caulfield, 2020: Micromobility and public transport integration: The current state of knowledge. Transportation Research Part D: Transport and Environment, 89, 102628. https://doi.org/10.1016/j.trd.2020.102628
- Hannan, M.A., M.M. Hoque, A. Hussain, Y. Yusof, and P.J. Ker, 2018: State-of-the-art and energy management system of lithium-ion batteries in electric vehicle applications: Issues and recommendations. IEEE Access, 6, 19362–19378. https://doi.org/10.1109/access.2018.2817655
- Leach, F., G. Kalghatgi, R. Stone, and P. Miles, 2020: The scope for improving the efficiency and environmental impact of internal combustion engines. Transportation Engineering, 1, 100005. https://doi.org/10.1016/j.treng.2020.100005
- Li, Z., A. Khajepour, and J. Song, 2019: A comprehensive review of the key technologies for pure electric vehicles. Energy, 182, 824–839. https://doi.org/10.1016/j.energy.2019.06.077
- Browning, M., J. McFarland, J. Bistline, G. Boyd, M. Muratori, M. Binsted, C. Harris, T. Mai, G. Blanford, J. Edmonds, A.A. Fawcett, O. Kaplan, and J. Weyant, 2023: Net-zero CO2 by 2050 scenarios for the United States in the Energy Modeling Forum 37 study. Energy and Climate Change, 4, 100104. https://doi.org/10.1016/j.egycc.2023.100104
- Huppmann, D., J. Bistline, J. DeAngelo, R. Jones, J. McFarland, J. Weyant, and S.J. Davis, 2023: NCA5 Scenario Explorer and Data hosted by IIASA. Mitigation Chapter of the Fifth National Climate Assessment and the International Institute for Applied Systems Analysis. Vienna, Austria.
- Azevedo, I.M.L., 2014: Consumer end-use energy efficiency and rebound effects. Annual Review of Environment and Resources, 39 (1), 393–418. https://doi.org/10.1146/annurev-environ-021913-153558
- Saunders, H.D., J. Roy, I.M.L. Azevedo, D. Chakravarty, S. Dasgupta, S. de la Rue du Can, A. Druckman, R. Fouquet, M. Grubb, B. Lin, R. Lowe, R. Madlener, D.M. McCoy, L. Mundaca, T. Oreszczyn, S. Sorrell, D. Stern, K. Tanaka, and T. Wei, 2021: Energy efficiency: What has research delivered in the last 40 years? Annual Review of Environment and Resources, 46 (1), 135–165. https://doi.org/10.1146/annurev-environ-012320-084937
- Azevedo, I., C. Bataille, J. Bistline, L. Clarke, and S. Davis, 2021: Net-zero emissions energy systems: What we know and do not know. Energy and Climate Change, 2, 100049. https://doi.org/10.1016/j.egycc.2021.100049
- Clack, C.T.M., A. Choukulkar, B. Coté, and S.A. McKee, 2021: A Plan for Economy-Wide Decarbonization of the United States. Vibrant Clean Energy, Boulder, CO, 18 pp. https://www.vibrantcleanenergy.com/wp-content/uploads/2021/10/US-Econ-Decarb_CCSA.pdf
- DeAngelo, J., I. Azevedo, J. Bistline, L. Clarke, G. Luderer, E. Byers, and S.J. Davis, 2021: Energy systems in scenarios at net-zero CO2 emissions. Nature Communications, 12 (1), 6096. https://doi.org/10.1038/s41467-021-26356-y
- Jenkins, J.D., Z. Zhou, R. Ponciroli, R.B. Vilim, F. Ganda, F. de Sisternes, and A. Botterud, 2018: The benefits of nuclear flexibility in power system operations with renewable energy. Applied Energy, 222, 872–884. https://doi.org/10.1016/j.apenergy.2018.03.002
- Larson, E., C. Greig, J. Jenkins, E. Mayfield, A. Pascale, C. Zhang, J. Drossman, R. Williams, S. Pacala, R. Socolow, E. Baik, R. Birdsey, R. Duke, R. Jones, B. Haley, E. Leslie, K. Paustian, and A. Swan, 2021: Final Report Summary—Net-Zero America: Potential Pathways, Infrastructure, and Impacts. Princeton University, Princeton, NJ. https://netzeroamerica.princeton.edu/the-report
- Murray, B.C., J. Bistline, J. Creason, E. Wright, A. Kanudia, and F. de la Chesnaye, 2018: The EMF 32 study on technology and climate policy strategies for greenhouse gas reductions in the U.S. electric power sector: An overview. Energy Economics, 73, 286–289. https://doi.org/10.1016/j.eneco.2018.03.007
- Pacala, S.W., G.C. Hurtt, D. Baker, P. Peylin, R.A. Houghton, R.A. Birdsey, L. Heath, E.T. Sundquist, R.F. Stallard, P. Ciais, P. Moorcroft, J.P. Caspersen, E. Shevliakova, B. Moore, G. Kohlmaier, E. Holland, M. Gloor, M.E. Harmon, S.M. Fan, J.L. Sarmiento, C.L. Goodale, D. Schimel, and C.B. Field, 2001: Consistent land- and atmosphere-based U.S. carbon sink estimates. Science, 292 (5525), 2316–2320. https://doi.org/10.1126/science.1057320
- Williams, J.H., R.A. Jones, B. Haley, G. Kwok, J. Hargreaves, J. Farbes, and M.S. Torn, 2021: Carbon-neutral pathways for the United States. AGU Advances, 2 (1), e2020AV000284. https://doi.org/10.1029/2020av000284
- Bistline, J.E.T. and G.J. Blanford, 2021: The role of the power sector in net-zero energy systems. Energy and Climate Change, 2, 100045. https://doi.org/10.1016/j.egycc.2021.100045
- Inflation Reduction Act of 2022. 117th Congress, Pub. L. No. 117-169, 136 Stat. 1818, August 16, 2022. https://www.congress.gov/bill/117th-congress/house-bill/5376/text
- Cole, W.J., D. Greer, P. Denholm, A.W. Frazier, S. Machen, T. Mai, N. Vincent, and S.F. Baldwin, 2021: Quantifying the challenge of reaching a 100% renewable energy power system for the United States. Joule, 5 (7), 1732–1748. https://doi.org/10.1016/j.joule.2021.05.011
- Bistline, J.E.T. and G.J. Blanford, 2021: Impact of carbon dioxide removal technologies on deep decarbonization of the electric power sector. Nature Communications, 12 (1), 3732. https://doi.org/10.1038/s41467-021-23554-6
- EPRI, 2022: Nuclear Energy in Long-Term System Models: A Multi-Model Perspective. Electric Power Research Institute, 136 pp. https://www.epri.com/research/products/000000003002023697
- Bloom, A., L. Azar, J. Caspary, D. Lew, N. Miller, A. Silverstein, J. Simonelli, and R. Zavadil, 2021: Transmission Planning for 100% Clean Electricity. Energy Systems Integration Group, 29 pp. https://www.esig.energy/wp-content/uploads/2021/02/Transmission-Planning-White-Paper.pdf
- Jacobson, M.Z., M.A. Delucchi, M.A. Cameron, and B.A. Frew, 2015: Low-cost solution to the grid reliability problem with 100% penetration of intermittent wind, water, and solar for all purposes. Proceedings of the National Academy of Sciences of the United States of America, 112 (49), 15060–15065. https://doi.org/10.1073/pnas.1510028112
- Bistline, J.E.T., 2021: Roadmaps to net-zero emissions systems: Emerging insights and modeling challenges. Joule, 5 (10), 2551–2563. https://doi.org/10.1016/j.joule.2021.09.012
- Mai, T.T., P. Jadun, J.S. Logan, C.A. McMillan, M. Muratori, D.C. Steinberg, L.J. Vimmerstedt, B. Haley, R. Jones, and B. Nelson, 2018: Electrification Futures Study: Scenarios of Electric Technology Adoption and Power Consumption for the United States. NREL/TP-6A20-71500. U.S. Department of Energy, National Renewable Energy Laboratory, Golden, CO. https://doi.org/10.2172/1459351
- Ueckerdt, F., C. Bauer, A. Dirnaichner, J. Everall, R. Sacchi, and G. Luderer, 2021: Potential and risks of hydrogen-based e-fuels in climate change mitigation. Nature Climate Change, 11 (5), 384–393. https://doi.org/10.1038/s41558-021-01032-7
- Hardman, S., 2019: Understanding the impact of reoccurring and non-financial incentives on plug-in electric vehicle adoption – A review. Transportation Research Part A: Policy and Practice, 119, 1–14. https://doi.org/10.1016/j.tra.2018.11.002
- Jenn, A., I.L. Azevedo, and P. Ferreira, 2013: The impact of federal incentives on the adoption of hybrid electric vehicles in the United States. Energy Economics, 40, 936–942. https://doi.org/10.1016/j.eneco.2013.07.025
- Jenn, A., K. Springel, and A.R. Gopal, 2018: Effectiveness of electric vehicle incentives in the United States. Energy Policy, 119, 349–356. https://doi.org/10.1016/j.enpol.2018.04.065
- Muratori, M., M. Alexander, D. Arent, M. Bazilian, P. Cazzola, E.M. Dede, J. Farrell, C. Gearhart, D. Greene, A. Jenn, M. Keyser, T. Lipman, S. Narumanchi, A. Pesaran, R. Sioshansi, E. Suomalainen, G. Tal, K. Walkowicz, and J. Ward, 2021: The rise of electric vehicles—2020 status and future expectations. Progress in Energy, 3 (2), 022002. https://doi.org/10.1088/2516-1083/abe0ad
- Rietmann, N., B. Hügler, and T. Lieven, 2020: Forecasting the trajectory of electric vehicle sales and the consequences for worldwide CO2 emissions. Journal of Cleaner Production, 261, 121038. https://doi.org/10.1016/j.jclepro.2020.121038
- Tong, F., A. Jenn, D. Wolfson, C.D. Scown, and M. Auffhammer, 2021: Health and climate impacts from long-haul truck electrification. Environmental Science & Technology, 55 (13), 8514–8523. https://doi.org/10.1021/acs.est.1c01273
- Borlaug, B., M. Muratori, M. Gilleran, D. Woody, W. Muston, T. Canada, A. Ingram, H. Gresham, and C. McQueen, 2021: Heavy-duty truck electrification and the impacts of depot charging on electricity distribution systems. Nature Energy, 6 (6), 673–682. https://doi.org/10.1038/s41560-021-00855-0
- Forrest, K., M. Mac Kinnon, B. Tarroja, and S. Samuelsen, 2020: Estimating the technical feasibility of fuel cell and battery electric vehicles for the medium and heavy duty sectors in California. Applied Energy, 276, 115439. https://doi.org/10.1016/j.apenergy.2020.115439
- Phadke, A.A., A. Khandekar, N. Abhyankar, D. Wooley, and D. Rajagopal, 2021: Why Regional and Long-Haul Trucks are Primed for Electrification Now. U.S. Department of Energy, Lawrence Berkeley National Laboratory, Berkeley, CA. https://eta-publications.lbl.gov/publications/why-regional-and-long-haul-trucks-are
- Smith, D., R. Graves, B. Ozpineci, P.T. Jones, J. Lustbader, K. Kelly, K. Walkowicz, A. Birky, G. Payne, C. Sigler, and J. Mosbacher, 2020: Medium- and Heavy-Duty Vehicle Electrification: An Assessment of Technology and Knowledge Gaps. ORNL/SPR-2020/7. U.S. Department of Energy, Oak Ridge National Laboratory and National Renewable Energy Laboratory. https://info.ornl.gov/sites/publications/files/pub136575.pdf
- Tong, F., D. Wolfson, A. Jenn, C.D. Scown, and M. Auffhammer, 2021: Energy consumption and charging load profiles from long-haul truck electrification in the United States. Environmental Research: Infrastructure and Sustainability, 1 (2), 025007. https://doi.org/10.1088/2634-4505/ac186a
- Bergero, C., G. Gosnell, D. Gielen, S. Kang, M. Bazilian, and S.J. Davis, 2023: Pathways to net-zero emissions from aviation. Nature Sustainability, 6 (4), 404–414. https://doi.org/10.1038/s41893-022-01046-9
- Davis, S.J., N.S. Lewis, M. Shaner, S. Aggarwal, D. Arent, I.L. Azevedo, S.M. Benson, T. Bradley, J. Brouwer, Y.-M. Chiang, C.T.M. Clack, A. Cohen, S. Doig, J. Edmonds, P. Fennell, C.B. Field, B. Hannegan, B.-M. Hodge, M.I. Hoffert, E. Ingersoll, P. Jaramillo, K.S. Lackner, K.J. Mach, M. Mastrandrea, J. Ogden, P.F. Peterson, D.L. Sanchez, D. Sperling, J. Stagner, J.E. Trancik, C.-J. Yang, and K. Caldeira, 2018: Net-zero emissions energy systems. Science, 360 (6396), 9793. https://doi.org/10.1126/science.aas9793
- Deason, J. and M. Borgeson, 2019: Electrification of buildings: Potential, challenges, and outlook. Current Sustainable/Renewable Energy Reports, 6 (4), 131–139. https://doi.org/10.1007/s40518-019-00143-2
- Mahone, A., C. Li, Z. Subin, M. Sontag, G. Mantegna, A. Karolides, A.K.A. German, and P. Morris, 2019: Residential Building Electrification in California: Consumer Economics, Greenhouse Gases and Grid Impacts. Energy and Environmental Economics, San Francisco, CA. https://www.ethree.com/wp-content/uploads/2019/04/E3_Residential_Building_Electrification_in_California_April_2019.pdf
- Tarroja, B., F. Chiang, A. AghaKouchak, S. Samuelsen, S.V. Raghavan, M. Wei, K. Sun, and T. Hong, 2018: Translating climate change and heating system electrification impacts on building energy use to future greenhouse gas emissions and electric grid capacity requirements in California. Applied Energy, 225, 522–534. https://doi.org/10.1016/j.apenergy.2018.05.003
- Madeddu, S., F. Ueckerdt, M. Pehl, J. Peterseim, M. Lord, K.A. Kumar, C. Krüger, and G. Luderer, 2020: The CO2 reduction potential for the European industry via direct electrification of heat supply (power-to-heat). Environmental Research Letters, 15 (12), 124004. https://doi.org/10.1088/1748-9326/abbd02
- Bataille, C., M. Åhman, K. Neuhoff, L.J. Nilsson, M. Fischedick, S. Lechtenböhmer, B. Solano-Rodriquez, A. Denis-Ryan, S. Stiebert, H. Waisman, O. Sartor, and S. Rahbar, 2018: A review of technology and policy deep decarbonization pathway options for making energy-intensive industry production consistent with the Paris Agreement. Journal of Cleaner Production, 187, 960–973. https://doi.org/10.1016/j.jclepro.2018.03.107
- Bataille, C.G.F., 2020: Physical and policy pathways to net-zero emissions industry. WIREs Climate Change, 11 (2), e633. https://doi.org/10.1002/wcc.633
- Denis-Ryan, A., C. Bataille, and F. Jotzo, 2016: Managing carbon-intensive materials in a decarbonizing world without a global price on carbon. Climate Policy, 16 (sup1), S110–S128. https://doi.org/10.1080/14693062.2016.1176008
- Rissman, J., C. Bataille, E. Masanet, N. Aden, W.R. Morrow, N. Zhou, N. Elliott, R. Dell, N. Heeren, B. Huckestein, J. Cresko, S.A. Miller, J. Roy, P. Fennell, B. Cremmins, T. Koch Blank, D. Hone, E.D. Williams, S. de la Rue du Can, B. Sisson, M. Williams, J. Katzenberger, D. Burtraw, G. Sethi, H. Ping, D. Danielson, H. Lu, T. Lorber, J. Dinkel, and J. Helseth, 2020: Technologies and policies to decarbonize global industry: Review and assessment of mitigation drivers through 2070. Applied Energy, 266, 114848. https://doi.org/10.1016/j.apenergy.2020.114848
- Thiel, G.P. and A.K. Stark, 2021: To decarbonize industry, we must decarbonize heat. Joule, 5 (3), 531–550. https://doi.org/10.1016/j.joule.2020.12.007
- Fennell, P., J. Driver, C. Bataille, and S.J. Davis, 2022: Cement and steel—Nine steps to net zero. Nature, 603, 574–577. https://doi.org/10.1038/d41586-022-00758-4
- Winkler, K., R. Fuchs, M. Rounsevell, and M. Herold, 2021: Global land use changes are four times greater than previously estimated. Nature Communications, 12 (1), 2501. https://doi.org/10.1038/s41467-021-22702-2
- Searchinger, T.D., S. Wirsenius, T. Beringer, and P. Dumas, 2018: Assessing the efficiency of changes in land use for mitigating climate change. Nature, 564 (7735), 249–253. https://doi.org/10.1038/s41586-018-0757-z
- Hong, C., H. Zhao, Y. Qin, J.A. Burney, J. Pongratz, K. Hartung, Y. Liu, F.C. Moore, R.B. Jackson, Q. Zhang, and S.J. Davis, 2022: Land-use emissions embodied in international trade. Science, 376 (6593), 597–603. https://doi.org/10.1126/science.abj1572
- Mathews, J.A. and H. Tan, 2009: Biofuels and indirect land use change effects: The debate continues. Biofuels, Bioproducts and Biorefining, 3 (3), 305–317. https://doi.org/10.1002/bbb.147
- Mosier, S., S.C. Córdova, and G.P. Robertson, 2021: Restoring soil fertility on degraded lands to meet food, fuel, and climate security needs via perennialization. Frontiers in Sustainable Food Systems, 5, 706142. https://doi.org/10.3389/fsufs.2021.706142
- EPA, 2021: From Farm to Kitchen: The Environmental Impacts of U.S. Food Waste. EPA 600-R21 171. U.S. Environmental Protection Agency, Office of Research and Development. https://www.epa.gov/land-research/farm-kitchen-environmental-impacts-us-food-waste
- Gustavsson, J., C. Cederberg, U. Sonesson, R. van Otterdijk, and A. Meybeck, 2011: Global Food Losses and Food Waste—Extent, Causes and Prevention. Food and Agriculture Organization of the United Nations, Rome, Italy. https://www.fao.org/3/i2697e/i2697e.pdf
- Godfray, H.C.J., P. Aveyard, T. Garnett, J.W. Hall, T.J. Key, J. Lorimer, R.T. Pierrehumbert, P. Scarborough, M. Springmann, and S.A. Jebb, 2018: Meat consumption, health, and the environment. Science, 361 (6399), 5324. https://doi.org/10.1126/science.aam5324
- Poore, J. and T. Nemecek, 2018: Reducing food’s environmental impacts through producers and consumers. Science, 360 (6392), 987–992. https://doi.org/10.1126/science.aaq0216
- Tilman, D. and M. Clark, 2014: Global diets link environmental sustainability and human health. Nature, 515 (7528), 518–522. https://doi.org/10.1038/nature13959
- Willett, W., J. Rockström, B. Loken, M. Springmann, T. Lang, S. Vermeulen, T. Garnett, D. Tilman, F. DeClerck, A. Wood, M. Jonell, M. Clark, L.J. Gordon, J. Fanzo, C. Hawkes, R. Zurayk, J.A. Rivera, W. De Vries, L. Majele Sibanda, A. Afshin, A. Chaudhary, M. Herrero, R. Agustina, F. Branca, A. Lartey, S. Fan, B. Crona, E. Fox, V. Bignet, M. Troell, T. Lindahl, S. Singh, S.E. Cornell, K. Srinath Reddy, S. Narain, S. Nishtar, and C.J.L. Murray, 2019: Food in the Anthropocene: The EAT–Lancet Commission on healthy diets from sustainable food systems. The Lancet, 393 (10170), 447–492. https://doi.org/10.1016/s0140-6736(18)31788-4
- Hong, C., J.A. Burney, J. Pongratz, J.E.M.S. Nabel, N.D. Mueller, R.B. Jackson, and S.J. Davis, 2021: Global and regional drivers of land-use emissions in 1961–2017. Nature, 589 (7843), 554–561. https://doi.org/10.1038/s41586-020-03138-y
- Clark, M.A., N.G.G. Domingo, K. Colgan, S.K. Thakrar, D. Tilman, J. Lynch, I.L. Azevedo, and J.D. Hill, 2020: Global food system emissions could preclude achieving the 1.5° and 2°C climate change targets. Science, 370 (6517), 705–708. https://doi.org/10.1126/science.aba7357
- Schmidinger, K. and E. Stehfest, 2012: Including CO2 implications of land occupation in LCAs—Method and example for livestock products. The International Journal of Life Cycle Assessment, 17 (8), 962–972. https://doi.org/10.1007/s11367-012-0434-7
- Springmann, M., L. Spajic, M.A. Clark, J. Poore, A. Herforth, P. Webb, M. Rayner, and P. Scarborough, 2020: The healthiness and sustainability of national and global food based dietary guidelines: Modelling study. BMJ, 370, m2322. https://doi.org/10.1136/bmj.m2322
- Falcon, W.P., R.L. Naylor, and N.D. Shankar, 2022: Rethinking global food demand for 2050. Population and Development Review, 48 (4), 921–957. https://doi.org/10.1111/padr.12508
- Domingo, N.G.G., S. Balasubramanian, S.K. Thakrar, M.A. Clark, P.J. Adams, J.D. Marshall, N.Z. Muller, S.N. Pandis, S. Polasky, A.L. Robinson, C.W. Tessum, D. Tilman, P. Tschofen, and J.D. Hill, 2021: Air quality–related health damages of food. Proceedings of the National Academy of Sciences of the United States of America, 118 (20), e2013637118. https://doi.org/10.1073/pnas.2013637118
- Coleman-Jensen, A., M.P. Rabbitt, C.A. Gregory, and A. Singh, 2022: Household Food Security in the United States in 2021. ERR-309. U.S. Department of Agriculture, Economic Research Service. https://www.ers.usda.gov/publications/pub-details/?pubid=104655
- Khaleel, A.A., T.J. Sauer, and J.C. Tyndall, 2020: Changes in deep soil organic carbon and soil properties beneath tree windbreak plantings in the U.S. Great Plains. Agroforestry Systems, 94 (2), 565–581. https://doi.org/10.1007/s10457-019-00425-0
- Osorio, R.J., C.J. Barden, and I.A. Ciampitti, 2019: GIS approach to estimate windbreak crop yield effects in Kansas–Nebraska. Agroforestry Systems, 93 (4), 1567–1576. https://doi.org/10.1007/s10457-018-0270-2
- Schoeneberger, M., G. Bentrup, H. de Gooijer, R. Soolanayakanahally, T. Sauer, J. Brandle, X. Zhou, and D. Current, 2012: Branching out: Agroforestry as a climate change mitigation and adaptation tool for agriculture. Journal of Soil and Water Conservation, 67 (5), 128A–136A. https://doi.org/10.2489/jswc.67.5.128a
- Meurer, K.H.E., N.R. Haddaway, M.A. Bolinder, and T. Kätterer, 2018: Tillage intensity affects total SOC stocks in boreo-temperate regions only in the topsoil—A systematic review using an ESM approach. Earth-Science Reviews, 177, 613–622. https://doi.org/10.1016/j.earscirev.2017.12.015
- Tamburini, G., R. Bommarco, T.C. Wanger, C. Kremen, M.G.A. Van der Heijden, M. Liebman, and S. Hallin, 2020: Agricultural diversification promotes multiple ecosystem services without compromising yield. Science Advances, 6 (45), 1715. https://doi.org/10.1126/sciadv.aba1715
- Sela, S., H.M. van Es, B.N. Moebius-Clune, R. Marjerison, J. Melkonian, D. Moebius-Clune, R. Schindelbeck, and S. Gomes, 2016: Adapt-N outperforms grower-selected nitrogen rates in northeast and midwestern United States strip trials. Agronomy Journal, 108 (4), 1726–1734. https://doi.org/10.2134/agronj2015.0606
- Venterea, R.T., J.A. Coulter, and M.S. Dolan, 2016: Evaluation of intensive “4R” strategies for decreasing nitrous oxide emissions and nitrogen surplus in rainfed corn. Journal of Environmental Quality, 45 (4), 1186–1195. https://doi.org/10.2134/jeq2016.01.0024
- Ruser, R. and R. Schulz, 2015: The effect of nitrification inhibitors on the nitrous oxide (N2O) release from agricultural soils—A review. Journal of Plant Nutrition and Soil Science, 178 (2), 171–188. https://doi.org/10.1002/jpln.201400251
- Eagle, A.J., L.P. Olander, K.L. Locklier, J.B. Heffernan, and E.S. Bernhardt, 2017: Fertilizer management and environmental factors drive N2O and NO3 losses in corn: A meta-analysis. Soil Science Society of America Journal, 81 (5), 1191–1202. https://doi.org/10.2136/sssaj2016.09.0281
- Muller, J., D. De Rosa, J. Friedl, M. De Antoni Migliorati, D. Rowlings, P. Grace, and C. Scheer, 2023: Combining nitrification inhibitors with a reduced N rate maintains yield and reduces N2O emissions in sweet corn. Nutrient Cycling in Agroecosystems, 125 (2), 107–121. https://doi.org/10.1007/s10705-021-10185-y
- Ocko, I.B., T. Sun, D. Shindell, M. Oppenheimer, A.N. Hristov, S.W. Pacala, D.L. Mauzerall, Y. Xu, and S.P. Hamburg, 2021: Acting rapidly to deploy readily available methane mitigation measures by sector can immediately slow global warming. Environmental Research Letters, 16 (5), 054042. https://doi.org/10.1088/1748-9326/abf9c8
- IPCC, 2021: Summary for policymakers. In: Climate Change 2021: The Physical Science Basis. Contribution of Working Group I to the Sixth Assessment Report of the Intergovernmental Panel on Climate Change. Masson-Delmotte, V., P. Zhai, A. Pirani, S.L. Connors, C. Péan, S. Berger, N. Caud, Y. Chen, L. Goldfarb, M.I. Gomis, M. Huang, K. Leitzell, E. Lonnoy, J.B.R. Matthews, T.K. Maycock, T. Waterfield, O. Yelekçi, R. Yu, and B. Zhou, Eds. Cambridge University Press, Cambridge, UK and New York, NY, USA, 3−32. https://doi.org/10.1017/9781009157896.001
- Ocko, I.B., V. Naik, and D. Paynter, 2018: Rapid and reliable assessment of methane impacts on climate. Atmospheric Chemistry and Physics, 18 (21), 15555–15568. https://doi.org/10.5194/acp-18-15555-2018
- Aydin, G., I. Karakurt, and K. Aydiner, 2012: Analysis and mitigation opportunities of methane emissions from the energy sector. Energy Sources, Part A: Recovery, Utilization, and Environmental Effects, 34 (11), 967–982. https://doi.org/10.1080/15567031003716725
- Kang, M., S. Christian, M.A. Celia, D.L. Mauzerall, M. Bill, A.R. Miller, Y. Chen, M.E. Conrad, T.H. Darrah, and R.B. Jackson, 2016: Identification and characterization of high methane-emitting abandoned oil and gas wells. Proceedings of the National Academy of Sciences of the United States of America, 113 (48), 13636–13641. https://doi.org/10.1073/pnas.1605913113
- Lauvaux, T., C. Giron, M. Mazzolini, A. d’Aspremont, R. Duren, D. Cusworth, D. Shindell, and P. Ciais, 2022: Global assessment of oil and gas methane ultra-emitters. Science, 375 (6580), 557–561. https://doi.org/10.1126/science.abj4351
- Omara, M., N. Zimmerman, M.R. Sullivan, X. Li, A. Ellis, R. Cesa, R. Subramanian, A.A. Presto, and A.L. Robinson, 2018: Methane emissions from natural gas production sites in the United States: Data synthesis and national estimate. Environmental Science & Technology, 52 (21), 12915–12925. https://doi.org/10.1021/acs.est.8b03535
- Fargione, J.E., S. Bassett, T. Boucher, S.D. Bridgham, R.T. Conant, S.C. Cook-patton, P.W. Ellis, A. Falcucci, J.W. Fourqurean, T. Gopalakrishna, H. Gu, B. Henderson, M.D. Hurteau, K.D. Kroeger, T. Kroeger, T.J. Lark, S.M. Leavitt, G. Lomax, R.I. McDonald, J.P. Megonigal, D.A. Miteva, C.J. Richardson, J. Sanderman, D. Shoch, S.A. Spawn, J.W. Veldman, C.A. WIlliams, P.B. Woodbury, C. Zganjar, M. Baranski, R.A. Houghton, E. Landis, E. McGlynn, W.H. Schlesinger, J.V. Siikamakiariana, E. Sutton-Grierand, and B.W. Griscom, 2018: Natural climate solutions for the United States. Science Advances, 4 (11), 1869. https://doi.org/10.1126/sciadv.aat1869
- APA, 2012: APA Policy Guide on Smart Growth. American Planning Association. https://www.planning.org/policy/guides/adopted/smartgrowth.htm
- Broitman, D. and E. Koomen, 2015: Residential density change: Densification and urban expansion. Computers, Environment and Urban Systems, 54, 32–46. https://doi.org/10.1016/j.compenvurbsys.2015.05.006
- Butler, B.J., P.F. Catanzaro, J.L. Greene, J.H. Hewes, M.A. Kilgore, D.B. Kittredge, Z. Ma, and M.L. Tyrrell, 2012: Taxing family forest owners: Implications of federal and state policies in the United States. Journal of Forestry, 110 (7), 371–380. https://doi.org/10.5849/jof.11-097
- Cathcart, J.F., J.D. Kline, M. Delaney, and M. Tilton, 2007: Carbon storage and Oregon’s land-use planning program. Journal of Forestry, 105 (4), 167–172. https://doi.org/10.1093/jof/105.4.167
- Harris, N.L., D.A. Gibbs, A. Baccini, R.A. Birdsey, S. de Bruin, M. Farina, L. Fatoyinbo, M.C. Hansen, M. Herold, R.A. Houghton, P.V. Potapov, D.R. Suarez, R.M. Roman-Cuesta, S.S. Saatchi, C.M. Slay, S.A. Turubanova, and A. Tyukavina, 2021: Global maps of twenty-first century forest carbon fluxes. Nature Climate Change, 11 (3), 234–240. https://doi.org/10.1038/s41558-020-00976-6
- Lister, A.J., H. Andersen, T. Frescino, D. Gatziolis, S. Healey, L.S. Heath, G.C. Liknes, R. McRoberts, G.G. Moisen, M. Nelson, R. Riemann, K. Schleeweis, T.A. Schroeder, J. Westfall, and B.T. Wilson, 2020: Use of remote sensing data to improve the efficiency of national forest inventories: A case study from the United States National Forest Inventory. Forests, 11 (12). https://doi.org/10.3390/f11121364
- Zheng, B., P. Ciais, F. Chevallier, H. Yang, J.G. Canadell, Y. Chen, I.R. van der Velde, I. Aben, E. Chuvieco, S.J. Davis, M. Deeter, C. Hong, Y. Kong, H. Li, H. Li, X. Lin, K. He, and Q. Zhang, 2023: Record-high CO2 emissions from boreal fires in 2021. Science, 379 (6635), 912–917. https://doi.org/10.1126/science.ade0805
- Smith, O., O. Cattell, E. Farcot, R.D. O’Dea, and K.I. Hopcraft, 2022: The effect of renewable energy incorporation on power grid stability and resilience. Science Advances, 8 (9), 6734. https://doi.org/10.1126/sciadv.abj6734
- Clarke, L., Y.-M. Wei, A. De La Vega Navarro, A. Garg, A.N. Hahmann, S. Khennas, I.M.L. Azevedo, A. Löschel, A.K. Singh, L. Steg, G. Strbac, and K. Wada, 2022: Ch. 6. Energy systems. In: IPCC, 2022: Climate Change 2022: Mitigation of Climate Change. Contribution of Working Group III to the Sixth Assessment Report of the Intergovernmental Panel on Climate Change. Shukla, P.R., J. Skea, R. Slade, A. Al Khourdajie, R. van Diemen, D. McCollum, M. Pathak, S. Some, P. Vyas, R. Fradera, M. Belkacemi, A. Hasija, G. Lisboa, S. Luz, and J. Malley, Eds. Cambridge University Press, Cambridge, UK and New York, NY. https://doi.org/10.1017/9781009157926.008
- Dowling, J.A., K.Z. Rinaldi, T.H. Ruggles, S.J. Davis, M. Yuan, F. Tong, N.S. Lewis, and K. Caldeira, 2020: Role of long-duration energy storage in variable renewable electricity systems. Joule, 4 (9), 1907–1928. https://doi.org/10.1016/j.joule.2020.07.007
- Jenkins, J.D. and N.A. Sepulveda, 2021: Long-duration energy storage: A blueprint for research and innovation. Joule, 5 (9), 2241–2246. https://doi.org/10.1016/j.joule.2021.08.002
- Sepulveda, N.A., J.D. Jenkins, F.J. de Sisternes, and R.K. Lester, 2018: The role of firm low-carbon electricity resources in deep decarbonization of power generation. Joule, 2 (11), 2403–2420. https://doi.org/10.1016/j.joule.2018.08.006
- Sepulveda, N.A., J.D. Jenkins, A. Edington, D.S. Mallapragada, and R.K. Lester, 2021: The design space for long-duration energy storage in decarbonized power systems. Nature Energy, 6 (5), 506–516. https://doi.org/10.1038/s41560-021-00796-8
- Shan, R., J. Reagan, S. Castellanos, S. Kurtz, and N. Kittner, 2022: Evaluating emerging long-duration energy storage technologies. Renewable and Sustainable Energy Reviews, 159, 112240. https://doi.org/10.1016/j.rser.2022.112240
- Tong, F., M. Yuan, N.S. Lewis, S.J. Davis, and K. Caldeira, 2020: Effects of deep reductions in energy storage costs on highly reliable wind and solar electricity systems. iScience, 23 (9), 101484. https://doi.org/10.1016/j.isci.2020.101484
- Jayadev, G., B.D. Leibowicz, and E. Kutanoglu, 2020: U.S. electricity infrastructure of the future: Generation and transmission pathways through 2050. Applied Energy, 260, 114267. https://doi.org/10.1016/j.apenergy.2019.114267
- Fennell, P.S., S.J. Davis, and A. Mohammed, 2021: Decarbonizing cement production. Joule, 5 (6), 1305–1311. https://doi.org/10.1016/j.joule.2021.04.011
- Sutherland, B.R., 2020: Sustainably heating heavy industry. Joule, 4 (1), 14–16. https://doi.org/10.1016/j.joule.2019.12.020
- Waite, M. and V. Modi, 2020: Electricity load implications of space heating decarbonization pathways. Joule, 4 (2), 376–394. https://doi.org/10.1016/j.joule.2019.11.011
- Brown, T., D. Schlachtberger, A. Kies, S. Schramm, and M. Greiner, 2018: Synergies of sector coupling and transmission reinforcement in a cost-optimised, highly renewable European energy system. Energy, 160, 720–739. https://doi.org/10.1016/j.energy.2018.06.222
- Griffiths, S., B.K. Sovacool, J. Kim, M. Bazilian, and J.M. Uratani, 2021: Industrial decarbonization via hydrogen: A critical and systematic review of developments, socio-technical systems and policy options. Energy Research & Social Science, 80, 102208. https://doi.org/10.1016/j.erss.2021.102208
- Gusain, D., M. Cvetković, R. Bentvelsen, and P. Palensky, 2020: Technical assessment of large scale PEM electrolyzers as flexibility service providers. In: 2020 IEEE 29th International Symposium on Industrial Electronics (ISIE). Delft, Netherlands, 17–19 June 2020. IEEE. https://doi.org/10.1109/isie45063.2020.9152462
- Reissner, R., S. You, C. Bourasseau, P. Marcuello, V. Lacroix, G. Lavaille, D.A. Greenhalgh, L. Abadia, C. Imboden, and M. Bornstein, 2019: Unified and standardized qualifying tests of electrolysers for grid services. 3rd European Grid Service Markets Symposium, Lucerne, Switzerland, 3–4 July 2019. https://elib.dlr.de/129857/2/g0502-paper.pdf
- Ruggles, T.H., J.A. Dowling, N.S. Lewis, and K. Caldeira, 2021: Opportunities for flexible electricity loads such as hydrogen production from curtailed generation. Advances in Applied Energy, 3, 100051. https://doi.org/10.1016/j.adapen.2021.100051
- Demirbas, A. and G. Arin, 2002: An overview of biomass pyrolysis. Energy Sources, 24 (5), 471–482. https://doi.org/10.1080/00908310252889979
- Dincer, I. and C. Acar, 2015: Review and evaluation of hydrogen production methods for better sustainability. International Journal of Hydrogen Energy, 40 (34), 11094–11111. https://doi.org/10.1016/j.ijhydene.2014.12.035
- Antonini, C., K. Treyer, A. Streb, M. van der Spek, C. Bauer, and M. Mazzotti, 2020: Hydrogen production from natural gas and biomethane with carbon capture and storage–A techno-environmental analysis. Sustainable Energy & Fuels, 4 (6), 2967–2986. https://doi.org/10.1039/d0se00222d
- Howarth, R.W. and M.Z. Jacobson, 2021: How green is blue hydrogen? Energy Science & Engineering, 9 (10), 1676–1687. https://doi.org/10.1002/ese3.956
- IEA, 2021: Global Hydrogen Review 2021. International Energy Agency. https://www.iea.org/reports/global-hydrogen-review-2021
- Chiesa, P., G. Lozza, and L. Mazzocchi, 2005: Using hydrogen as gas turbine fuel. Journal of Engineering for Gas Turbines and Power, 127 (1), 73–80. https://doi.org/10.1115/1.1787513
- Leicher, J., T. Nowakowski, A. Giese, and K. Görner, 2017: Power-to-gas and the consequences: Impact of higher hydrogen concentrations in natural gas on industrial combustion processes. Energy Procedia, 120, 96–103. https://doi.org/10.1016/j.egypro.2017.07.157
- DOE, 2021: Hydrogen Shot. U.S. Department of Energy, Office of Energy Efficiency and Renewable Energy. https://www.energy.gov/eere/fuelcells/hydrogen-shot
- IEA, 2019: The Future of Hydrogen: Seizing Today’s Opportunities. International Energy Agency. https://www.iea.org/reports/the-future-of-hydrogen
- Pasman, H.J. and W.J. Rogers, 2010: Safety challenges in view of the upcoming hydrogen economy: An overview. Journal of Loss Prevention in the Process Industries, 23 (6), 697–704. https://doi.org/10.1016/j.jlp.2010.06.002
- Stępień, Z., 2021: A comprehensive overview of hydrogen-fueled internal combustion engines: Achievements and future challenges. Energies, 14 (20). https://doi.org/10.3390/en14206504
- York, W.D., W.S. Ziminsky, and E. Yilmaz, 2013: Development and testing of a low NOx hydrogen combustion system for heavy duty gas turbines. Proceedings of the ASME Turbo Expo 2012: Turbine Technical Conference and Exposition. Volume 2: Combustion, Fuels and Emissions, Parts A and B, Copenhagen, Denmark, 11–15 June 2012. ASME, 1395–1405. https://doi.org/10.1115/gt2012-69913
- Ocko, I.B. and S.P. Hamburg, 2022: Climate consequences of hydrogen emissions. Atmospheric Chemistry and Physics, 22 (14), 9349–9368. https://doi.org/10.5194/acp-22-9349-2022
- Prather, M.J., 2003: An environmental experiment with H2? Science, 302 (5645), 581–582. https://doi.org/10.1126/science.1091060
- Nguyen, T.T., J.S. Park, W.S. Kim, S.H. Nahm, and U.B. Beak, 2020: Environment hydrogen embrittlement of pipeline steel X70 under various gas mixture conditions with in situ small punch tests. Materials Science and Engineering: A, 781, 139114. https://doi.org/10.1016/j.msea.2020.139114
- Sun, M., X. Huang, Y. Hu, and S. Lyu, 2022: Effects on the performance of domestic gas appliances operated on natural gas mixed with hydrogen. Energy, 244, 122557. https://doi.org/10.1016/j.energy.2021.122557
- Wu, X., H. Zhang, M. Yang, W. Jia, Y. Qiu, and L. Lan, 2022: From the perspective of new technology of blending hydrogen into natural gas pipelines transmission: Mechanism, experimental study, and suggestions for further work of hydrogen embrittlement in high-strength pipeline steels. International Journal of Hydrogen Energy, 47 (12), 8071–8090. https://doi.org/10.1016/j.ijhydene.2021.12.108
- Zhao, Y., V. McDonell, and S. Samuelsen, 2019: Experimental assessment of the combustion performance of an oven burner operated on pipeline natural gas mixed with hydrogen. International Journal of Hydrogen Energy, 44 (47), 26049–26062. https://doi.org/10.1016/j.ijhydene.2019.08.011
- Zhao, Y., V. McDonell, and S. Samuelsen, 2019: Influence of hydrogen addition to pipeline natural gas on the combustion performance of a cooktop burner. International Journal of Hydrogen Energy, 44 (23), 12239–12253. https://doi.org/10.1016/j.ijhydene.2019.03.100
- Haley, B., R.A. Jones, J.H. Williams, G. Kwok, J. Farbes, J. Hargreaves, K. Pickrell, D. Bentz, A. Waddell, and E. Leslie, 2022: Annual Decarbonization Perspective: Carbon-Neutral Pathways for the United States 2022. Evolved Energy Research. https://www.evolved.energy/post/adp2022
- Caldeira, K., G. Bala, and L. Cao, 2013: The science of geoengineering. Annual Review of Earth and Planetary Sciences, 41 (1), 231–256. https://doi.org/10.1146/annurev-earth-042711-105548
- National Academies of Sciences, Engineering, and Medicine, 2019: Negative Emissions Technologies and Reliable Sequestration: A Research Agenda. The National Academies Press, Washington, DC, 510 pp. https://doi.org/10.17226/25259
- Smith, P., S.J. Davis, F. Creutzig, S. Fuss, J. Minx, B. Gabrielle, E. Kato, R.B. Jackson, A. Cowie, E. Kriegler, D.P. van Vuuren, J. Rogelj, P. Ciais, J. Milne, J.G. Canadell, D. McCollum, G. Peters, R. Andrew, V. Krey, G. Shrestha, P. Friedlingstein, T. Gasser, A. Grubler, W.K. Heidug, M. Jonas, C.D. Jones, F. Kraxner, E. Littleton, J. Lowe, J.R. Moreira, N. Nakicenovic, M. Obersteiner, A. Patwardhan, M. Rogner, E. Rubin, A. Sharifi, A. Torvanger, Y. Yamagata, J. Edmonds, and C. Yongsung, 2016: Biophysical and economic limits to negative CO2 emissions. Nature Climate Change, 6, 42–50. https://doi.org/10.1038/nclimate2870
- Batres, M., F.M. Wang, H. Buck, R. Kapila, U. Kosar, R. Licker, D. Nagabhushan, E. Rekhelman, and V. Suarez, 2021: Environmental and climate justice and technological carbon removal. The Electricity Journal, 34 (7), 107002. https://doi.org/10.1016/j.tej.2021.107002
- Lee, K., C. Fyson, and C.-F. Schleussner, 2021: Fair distributions of carbon dioxide removal obligations and implications for effective national net-zero targets. Environmental Research Letters, 16 (9), 094001. https://doi.org/10.1088/1748-9326/ac1970
- Fuhrman, J., C. Bergero, M. Weber, S. Monteith, F.M. Wang, A.F. Clarens, S.C. Doney, W. Shobe, and H. McJeon, 2023: Diverse carbon dioxide removal approaches could reduce impacts on the energy–water–land system. Nature Climate Change, 13 (4), 341–350. https://doi.org/10.1038/s41558-023-01604-9
- Chiquier, S., P. Patrizio, M. Bui, N. Sunny, and N. Mac Dowell, 2022: A comparative analysis of the efficiency, timing, and permanence of CO2 removal pathways. Energy and Environmental Science, 15 (10), 4389–4403. https://doi.org/10.1039/d2ee01021f
- Fankhauser, S., S.M. Smith, M. Allen, K. Axelsson, T. Hale, C. Hepburn, J.M. Kendall, R. Khosla, J. Lezaun, E. Mitchell-Larson, M. Obersteiner, L. Rajamani, R. Rickaby, N. Seddon, and T. Wetzer, 2022: The meaning of net zero and how to get it right. Nature Climate Change, 12 (1), 15–21. https://doi.org/10.1038/s41558-021-01245-w
- Novick, K.A., S. Metzger, W.R.L. Anderegg, M. Barnes, D.S. Cala, K. Guan, K.S. Hemes, D.Y. Hollinger, J. Kumar, M. Litvak, D. Lombardozzi, C.P. Normile, P. Oikawa, B.R.K. Runkle, M. Torn, and S. Wiesner, 2022: Informing nature-based climate solutions for the United States with the best-available science. Global Change Biology, 28 (12), 3778–3794. https://doi.org/10.1111/gcb.16156
- Sedjo, R. and B. Sohngen, 2012: Carbon sequestration in forests and soils. Annual Review of Resource Economics, 4 (1), 127–144. https://doi.org/10.1146/annurev-resource-083110-115941
- McQueen, N., K.V. Gomes, C. McCormick, K. Blumanthal, M. Pisciotta, and J. Wilcox, 2021: A review of direct air capture (DAC): Scaling up commercial technologies and innovating for the future. Progress in Energy, 3 (3), 032001. https://doi.org/10.1088/2516-1083/abf1ce
- Griscom, B.W., J. Adams, P.W. Ellis, R.A. Houghton, G. Lomax, D.A. Miteva, W.H. Schlesinger, D. Shoch, J.V. Siikamäki, P. Smith, P. Woodbury, C. Zganjar, A. Blackman, J. Campari, R.T. Conant, C. Delgado, P. Elias, T. Gopalakrishna, M.R. Hamsik, M. Herrero, J. Kiesecker, E. Landis, L. Laestadius, S.M. Leavitt, S. Minnemeyer, S. Polasky, P. Potapov, F.E. Putz, J. Sanderman, M. Silvius, E. Wollenberg, and J. Fargione, 2017: Natural climate solutions. Proceedings of the National Academy of Sciences of the United States of America, 114 (44), 11645–11650. https://doi.org/10.1073/pnas.1710465114
- Cook-Patton, S.C., T. Gopalakrishna, A. Daigneault, S.M. Leavitt, J. Platt, S.M. Scull, O. Amarjargal, P.W. Ellis, B.W. Griscom, J.L. McGuire, S.M. Yeo, and J.E. Fargione, 2020: Lower cost and more feasible options to restore forest cover in the contiguous United States for climate mitigation. One Earth, 3 (6), 739–752. https://doi.org/10.1016/j.oneear.2020.11.013
- Van Winkle, C., J. Baker, D. Lapidus, S.B. Ohrel, J. Steller, G. Latta, and D. Birur, 2017: Us Forest Sector Greenhouse Mitigation Potential and Implications for Nationally Determined Contributions. RTI Press Publication No. OP-0033-1705. RTI Press, Research Triangle Park, NC. https://doi.org/10.3768/rtipress.2017.op.0033.1705
- Fargione, J., D.L. Haase, O.T. Burney, O.A. Kildisheva, G. Edge, S.C. Cook-Patton, T. Chapman, A. Rempel, M.D. Hurteau, K.T. Davis, S. Dobrowski, S. Enebak, R. De La Torre, A.A.R. Bhuta, F. Cubbage, B. Kittler, D. Zhang, and R.W. Guldin, 2021: Challenges to the reforestation pipeline in the United States. Frontiers in Forests and Global Change, 4, 629198. https://doi.org/10.3389/ffgc.2021.629198
- Bigelow, D.P. and A. Borchers, 2017: Major Uses of Land in the United States, 2012. EIB-178. U.S. Department of Agriculture, Economic Research Service. https://www.ers.usda.gov/publications/pub-details/?pubid=84879
- Conant, R.T., C.E.P. Cerri, B.B. Osborne, and K. Paustian, 2017: Grassland management impacts on soil carbon stocks: A new synthesis. Ecological Applications, 27 (2), 662–668. https://doi.org/10.1002/eap.1473
- McSherry, M.E. and M.E. Ritchie, 2013: Effects of grazing on grassland soil carbon: A global review. Global Change Biology, 19 (5), 1347–1357. https://doi.org/10.1111/gcb.12144
- Sanderson, J.S., C. Beutler, J.R. Brown, I. Burke, T. Chapman, R.T. Conant, J.D. Derner, M. Easter, S.D. Fuhlendorf, G. Grissom, J.E. Herrick, D. Liptzin, J.A. Morgan, R. Murph, C. Pague, I. Rangwala, D. Ray, R. Rondeau, T. Schulz, and T. Sullivan, 2020: Cattle, conservation, and carbon in the western Great Plains. Journal of Soil and Water Conservation, 75 (1), 5A–12A. https://doi.org/10.2489/jswc.75.1.5a
- Bossio, D.A., S.C. Cook-Patton, P.W. Ellis, J. Fargione, J. Sanderman, P. Smith, S. Wood, R.J. Zomer, M. Unger, I.M. Emmer, and B.W. Griscom, 2020: The role of soil carbon in natural climate solutions. Nature Sustainability, 3, 391–398. https://doi.org/10.1038/s41893-020-0491-z
- Cai, A., T. Han, T. Ren, J. Sanderman, Y. Rui, B. Wang, P. Smith, M. Xu, and Y.e. Li, 2022: Declines in soil carbon storage under no tillage can be alleviated in the long run. Geoderma, 425, 116028. https://doi.org/10.1016/j.geoderma.2022.116028
- Lessmann, M., G.H. Ros, M.D. Young, and W. de Vries, 2022: Global variation in soil carbon sequestration potential through improved cropland management. Global Change Biology, 28 (3), 1162–1177. https://doi.org/10.1111/gcb.15954
- Poeplau, C. and A. Don, 2015: Carbon sequestration in agricultural soils via cultivation of cover crops – A meta-analysis. Agriculture, Ecosystems & Environment, 200, 33–41. https://doi.org/10.1016/j.agee.2014.10.024
- D’Amato, A.W., J.B. Bradford, S. Fraver, and B.J. Palik, 2011: Forest management for mitigation and adaptation to climate change: Insights from long-term silviculture experiments. Forest Ecology and Management, 262 (5), 803–816. https://doi.org/10.1016/j.foreco.2011.05.014
- Jackson, R.B. and J.S. Baker, 2010: Opportunities and constraints for forest climate mitigation. BioScience, 60 (9), 698–707. https://doi.org/10.1525/bio.2010.60.9.7
- Kaarakka, L., M. Cornett, G. Domke, T. Ontl, and L.E. Dee, 2021: Improved forest management as a natural climate solution: A review. Ecological Solutions and Evidence, 2 (3), e12090. https://doi.org/10.1002/2688-8319.12090
- Lee, T.D., S.E. Eisenhaure, and I.P. Gaudreau, 2017: Pre-logging treatment of invasive glossy buckthorn (Frangula alnus mill.) promotes regeneration of eastern white pine (Pinus strobus L.). Forests, 8 (1), 16. https://doi.org/10.3390/f8010016
- Moss, S.A. and E. Heitzman, 2013: The economic impact of timber harvesting practices on NIPF properties in West Virginia. In: Proceedings, 18th Central Hardwood Forest Conference, Miller, G.W., T.M. Schuler, K.W. Gottschalk, J.R. Brooks, S.T. Grushecky, B.D. Spong, and J.S. Rentch, Eds. Morgantown, WV, 26–28 March 2012. U.S. Department of Agriculture, Forest Service, Northern Research Station, 129–141. https://www.fs.usda.gov/research/treesearch/44060
- Ontl, T.A., M.K. Janowiak, C.W. Swanston, J. Daley, S. Handler, M. Cornett, S. Hagenbuch, C. Handrick, L. McCarthy, and N. Patch, 2020: Forest management for carbon sequestration and climate adaptation. Journal of Forestry, 118 (1), 86–101. https://doi.org/10.1093/jofore/fvz062
- Powers, M.D., R.K. Kolka, J.B. Bradford, B.J. Palik, S. Fraver, and M.F. Jurgensen, 2012: Carbon stocks across a chronosequence of thinned and unmanaged red pine (Pinus resinosa) stands. Ecological Applications, 22 (4), 1297–1307. https://doi.org/10.1890/11-0411.1
- Schuler, T.M., M. Thomas-Van Gundy, J.P. Brown, and J.K. Wiedenbeck, 2017: Managing Appalachian hardwood stands using four management practices: 60-year results. Forest Ecology and Management, 387, 3–11. https://doi.org/10.1016/j.foreco.2016.08.019
- Byrd, K., J. Ratliff, N. Bliss, A. Wein, B. Sleeter, T. Sohl, and Z. Li, 2015: Quantifying climate change mitigation potential in the United States Great Plains wetlands for three greenhouse gas emission scenarios. Mitigation and Adaptation Strategies for Global Change, 20 (3), 439–465. https://doi.org/10.1007/s11027-013-9500-0
- Byrd, K.B., L. Ballanti, N. Thomas, D. Nguyen, J.R. Holmquist, M. Simard, and L. Windham-Myers, 2018: A remote sensing-based model of tidal marsh aboveground carbon stocks for the conterminous United States. ISPRS Journal of Photogrammetry and Remote Sensing, 139, 255–271. https://doi.org/10.1016/j.isprsjprs.2018.03.019
- Kroeger, K.D., S. Crooks, S. Moseman-Valtierra, and J. Tang, 2017: Restoring tides to reduce methane emissions in impounded wetlands: A new and potent Blue Carbon climate change intervention. Scientific Reports, 7 (1), 11914. https://doi.org/10.1038/s41598-017-12138-4
- National Academies of Sciences, Engineering, and Medicine, 2022: A Research Strategy for Ocean-based Carbon Dioxide Removal and Sequestration. The National Academies Press, Washington, DC, 322 pp. https://doi.org/10.17226/26278
- Lampitt, R.S., E.P. Achterberg, T.R. Anderson, J.A. Hughes, M.D. Iglesias-Rodriguez, B.A. Kelly-Gerreyn, M. Lucas, E.E. Popova, R. Sanders, J.G. Shepherd, D. Smythe-Wright, and A. Yool, 2008: Ocean fertilization: A potential means of geoengineering? Philosophical Transactions of the Royal Society A: Mathematical, Physical and Engineering Sciences, 366 (1882), 3919–3945. https://doi.org/10.1098/rsta.2008.0139
- DeAngelo, J., B.T. Saenz, I.B. Arzeno-Soltero, C.A. Frieder, M.C. Long, J. Hamman, K.A. Davis, and S.J. Davis, 2023: Economic and biophysical limits to seaweed farming for climate change mitigation. Nature Plants, 9 (1), 45–57. https://doi.org/10.1038/s41477-022-01305-9
- Bach, L.T., S.J. Gill, R.E.M. Rickaby, S. Gore, and P. Renforth, 2019: CO2 removal with enhanced weathering and ocean alkalinity enhancement: Potential risks and co-benefits for marine pelagic ecosystems. Frontiers in Climate, 1, 7. https://doi.org/10.3389/fclim.2019.00007
- Drouet, L., V. Bosetti, S.A. Padoan, L. Aleluia Reis, C. Bertram, F. Dalla Longa, J. Després, J. Emmerling, F. Fosse, K. Fragkiadakis, S. Frank, O. Fricko, S. Fujimori, M. Harmsen, V. Krey, K. Oshiro, L.P. Nogueira, L. Paroussos, F. Piontek, K. Riahi, P.R.R. Rochedo, R. Schaeffer, J.y. Takakura, K.-I. van der Wijst, B. van der Zwaan, D. van Vuuren, Z. Vrontisi, M. Weitzel, B. Zakeri, and M. Tavoni, 2021: Net zero-emission pathways reduce the physical and economic risks of climate change. Nature Climate Change, 11 (12), 1070–1076. https://doi.org/10.1038/s41558-021-01218-z
- Jones, C.D., P. Ciais, S.J. Davis, P. Friedlingstein, T. Gasser, G.P. Peters, J. Rogelj, D.P. van Vuuren, J.G. Canadell, A. Cowie, R.B. Jackson, M. Jonas, E. Kriegler, E. Littleton, J.A. Lowe, J. Milne, G. Shrestha, P. Smith, A. Torvanger, and A. Wiltshire, 2016: Simulating the Earth system response to negative emissions. Environmental Research Letters, 11 (9), 095012. https://doi.org/10.1088/1748-9326/11/9/095012
- Koven, C.D., B.M. Sanderson, and A.L.S. Swann, 2023: Much of zero emissions commitment occurs before reaching net zero emissions. Environmental Research Letters, 18 (1), 014017. https://doi.org/10.1088/1748-9326/acab1a
- National Academies of Sciences, Engineering, and Medicine, 2021: Reflecting Sunlight: Recommendations for Solar Geoengineering Research and Research Governance. The National Academies Press, Washington, DC, 328 pp. https://doi.org/10.17226/25762
- OSTP, 2023: Congressionally-mandated report on solar radiation modification. White House Office of Science and Technology Policy, Washington, DC, June 30, 2023. https://www.whitehouse.gov/ostp/news-updates/2023/06/30/congressionally-mandated-report-on-solar-radiation-modification/
- Fagnant, D.J. and K. Kockelman, 2015: Preparing a nation for autonomous vehicles: Opportunities, barriers and policy recommendations. Transportation Research Part A: Policy and Practice, 77, 167–181. https://doi.org/10.1016/j.tra.2015.04.003
- Motamedi, S., P. Wang, T. Zhang, and C.-Y. Chan, 2020: Acceptance of full driving automation: Personally owned and shared-use concepts. Human Factors, 62 (2), 288–309. https://doi.org/10.1177/0018720819870658
- Brown, K.E. and R. Dodder, 2019: Energy and emissions implications of automated vehicles in the U.S. energy system. Transportation Research Part D: Transport and Environment, 77, 132–147. https://doi.org/10.1016/j.trd.2019.09.003
- Massar, M., I. Reza, S.M. Rahman, S.M.H. Abdullah, A. Jamal, and F.S. Al-Ismail, 2021: Impacts of autonomous vehicles on greenhouse gas emissions—Positive or negative? International Journal of Environmental Research and Public Health, 18 (11), 5567. https://doi.org/10.3390/ijerph18115567
- Sheppard, C.J.R., A.T. Jenn, J.B. Greenblatt, G.S. Bauer, and B.F. Gerke, 2021: Private versus shared, automated electric vehicles for U.S. personal mobility: Energy use, greenhouse gas emissions, grid integration, and cost impacts. Environmental Science and Technology, 55 (5), 3229–3239. https://doi.org/10.1021/acs.est.0c06655
- Abduljabbar, R.L., S. Liyanage, and H. Dia, 2021: The role of micro-mobility in shaping sustainable cities: A systematic literature review. Transportation Research Part D: Transport and Environment, 92, 102734. https://doi.org/10.1016/j.trd.2021.102734
- Hidaka, K. and T. Shiga, 2018: Forecasting travel demand for new mobility services employing autonomous vehicles. Transportation Research Procedia, 34, 139–146. https://doi.org/10.1016/j.trpro.2018.11.025
- Kamargianni, M., W. Li, M. Matyas, and A. Schäfer, 2016: A critical review of new mobility services for urban transport. Transportation Research Procedia, 14, 3294–3303. https://doi.org/10.1016/j.trpro.2016.05.277
- Fleming, K.L., 2018: Social equity considerations in the new age of transportation: Electric, automated, and shared mobility. Journal of Science Policy & Governance, 13 (1). https://www.sciencepolicyjournal.org/uploads/5/4/3/4/5434385/fleming.pdf
- Jenn, A., 2020: Emissions benefits of electric vehicles in Uber and Lyft ride-hailing services. Nature Energy, 5 (7), 520–525. https://doi.org/10.1038/s41560-020-0632-7
- Taiebat, M. and M. Xu, 2019: Synergies of four emerging technologies for accelerated adoption of electric vehicles: Shared mobility, wireless charging, vehicle-to-grid, and vehicle automation. Journal of Cleaner Production, 230, 794–797. https://doi.org/10.1016/j.jclepro.2019.05.142
- Arent, D.J., C. Barrows, S. Davis, G. Grim, J. Schaidle, B. Kroposki, M. Ruth, and B. Van Zandt, 2022: Integration of energy systems. MRS Bulletin, 46 (12), 1139–1152. https://doi.org/10.1557/s43577-021-00244-8
- Ramsebner, J., R. Haas, A. Ajanovic, and M. Wietschel, 2021: The sector coupling concept: A critical review. WIREs Energy and Environment, 10 (4), e396. https://doi.org/10.1002/wene.396
- Rodríguez Escobar, M.I., E. Cadena, T.T. Nhu, M. Cooreman-Algoed, S. De Smet, and J. Dewulf, 2021: Analysis of the cultured meat production system in function of its environmental footprint: Current status, gaps and recommendations. Foods, 10 (12), 2941. https://doi.org/10.3390/foods10122941
- Rubio, N.R., N. Xiang, and D.L. Kaplan, 2020: Plant-based and cell-based approaches to meat production. Nature Communications, 11 (1), 6276. https://doi.org/10.1038/s41467-020-20061-y
- Tubb, C. and T. Seba, 2021: Rethinking food and agriculture 2020-2030: The second domestication of plants and animals, the disruption of the cow, and the collapse of industrial livestock farming. Industrial Biotechnology, 17 (2), 57–72. https://doi.org/10.1089/ind.2021.29240.ctu
- García Martínez, J.B., K.A. Alvarado, and D.C. Denkenberger, 2022: Synthetic fat from petroleum as a resilient food for global catastrophes: Preliminary techno-economic assessment and technology roadmap. Chemical Engineering Research and Design, 177, 255–272. https://doi.org/10.1016/j.cherd.2021.10.017
- MacDougall, A.H., J. Rogelj, and P. Withey, 2021: Estimated climate impact of replacing agriculture as the primary food production system. Environmental Research Letters, 16 (12), 125010. https://doi.org/10.1088/1748-9326/ac3aa5
- Almeida, A.K., R.S. Hegarty, and A. Cowie, 2021: Meta-analysis quantifying the potential of dietary additives and rumen modifiers for methane mitigation in ruminant production systems. Animal Nutrition, 7 (4), 1219–1230. https://doi.org/10.1016/j.aninu.2021.09.005
- Roque, B.M., M. Venegas, R.D. Kinley, R. de Nys, T.L. Duarte, X. Yang, and E. Kebreab, 2021: Red seaweed (Asparagopsis taxiformis) supplementation reduces enteric methane by over 80 percent in beef steers. PLoS ONE, 16 (3), e0247820. https://doi.org/10.1371/journal.pone.0247820
- Pape, D., J. Lewandrowski, R. Steele, D. Man, M. Riley-Gilbert, K. Moffroid, and S. Kolansky, 2016: Managing Agricultural Land for Greenhouse Gas Mitigation Within the United States. ICF International. https://www.usda.gov/sites/default/files/documents/White_Paper_WEB71816.pdf
- Souza, R., J. Yin, and S. Calabrese, 2021: Optimal drainage timing for mitigating methane emissions from rice paddy fields. Geoderma, 394, 114986. https://doi.org/10.1016/j.geoderma.2021.114986
- Subbarao, G.V. and T.D. Searchinger, 2021: A “more ammonium solution” to mitigate nitrogen pollution and boost crop yields. Proceedings of the National Academy of Sciences of the United States of America, 118 (22), e2107576118. https://doi.org/10.1073/pnas.2107576118
- Lelieveld, J., K. Klingmüller, A. Pozzer, R.T. Burnett, A. Haines, and V. Ramanathan, 2019: Effects of fossil fuel and total anthropogenic emission removal on public health and climate. Proceedings of the National Academy of Sciences of the United States of America, 116 (15), 7192–7197. https://doi.org/10.1073/pnas.1819989116
- Shindell, D., M. Ru, Y. Zhang, K. Seltzer, G. Faluvegi, L. Nazarenko, G.A. Schmidt, L. Parsons, A. Challapalli, L. Yang, and A. Glick, 2021: Temporal and spatial distribution of health, labor, and crop benefits of climate change mitigation in the United States. Proceedings of the National Academy of Sciences of the United States of America, 118 (46), e2104061118. https://doi.org/10.1073/pnas.2104061118
- Tessum, C.W., J.S. Apte, A.L. Goodkind, N.Z. Muller, K.A. Mullins, D.A. Paolella, S. Polasky, N.P. Springer, S.K. Thakrar, J.D. Marshall, and J.D. Hill, 2019: Inequity in consumption of goods and services adds to racial–ethnic disparities in air pollution exposure. Proceedings of the National Academy of Sciences of the United States of America, 116 (13), 6001–6006. https://doi.org/10.1073/pnas.1818859116
- Tessum, C.W., J.D. Hill, and J.D. Marshall, 2017: InMAP: A model for air pollution interventions. PLoS ONE, 12 (4), e0176131. https://doi.org/10.1371/journal.pone.0176131
- Thakrar, S.K., S. Balasubramanian, P.J. Adams, I.M.L. Azevedo, N.Z. Muller, S.N. Pandis, S. Polasky, C.A. Pope, A.L. Robinson, J.S. Apte, C.W. Tessum, J.D. Marshall, and J.D. Hill, 2020: Reducing mortality from air pollution in the United States by targeting specific emission sources. Environmental Science & Technology Letters, 7 (9), 639–645. https://doi.org/10.1021/acs.estlett.0c00424
- Vohra, K., A. Vodonos, J. Schwartz, E.A. Marais, M.P. Sulprizio, and L.J. Mickley, 2021: Global mortality from outdoor fine particle pollution generated by fossil fuel combustion: Results from GEOS-Chem. Environmental Research, 195, 110754. https://doi.org/10.1016/j.envres.2021.110754
- Murray, C.J.L., A.Y. Aravkin, P. Zheng, C. Abbafati, K.M. Abbas, et al., 2020: Global burden of 87 risk factors in 204 countries and territories, 1990–2019: A systematic analysis for the Global Burden of Disease Study 2019. The Lancet, 396 (10258), 1223–1249. https://doi.org/10.1016/s0140-6736(20)30752-2
- Brook, R.D., S. Rajagopalan, C.A. Pope, J.R. Brook, A. Bhatnagar, A.V. Diez-Roux, F. Holguin, Y. Hong, R.V. Luepker, M.A. Mittleman, A. Peters, D. Siscovick, S.C. Smith, L. Whitsel, and J.D. Kaufman, 2010: Particulate matter air pollution and cardiovascular disease: An update to the scientific statement from the American Heart Association. Circulation, 121 (21), 2331–2378. https://doi.org/10.1161/cir.0b013e3181dbece1
- Crouse, D.L., P.A. Peters, A. van Donkelaar, M.S. Goldberg, P.J. Villeneuve, O. Brion, S. Khan, D.O. Atari, M. Jerrett, C.A. Pope, M. Brauer, J.R. Brook, R.V. Martin, D. Stieb, and R.T. Burnett, 2012: Risk of nonaccidental and cardiovascular mortality in relation to long-term exposure to low concentrations of fine particulate matter: A Canadian national-level cohort study. Environmental Health Perspectives, 120 (5), 708–714. https://doi.org/10.1289/ehp.1104049
- Pope, C.A. and D.W. Dockery, 2006: Health effects of fine particulate air pollution: Lines that connect. Journal of the Air & Waste Management Association, 56 (6), 709–742. https://doi.org/10.1080/10473289.2006.10464485
- Hajat, A., C. Hsia, and M.S. O’Neill, 2015: Socioeconomic disparities and air pollution exposure: A global review. Current Environmental Health Reports, 2 (4), 440–450. https://doi.org/10.1007/s40572-015-0069-5
- Liu, J., L.P. Clark, M.J. Bechle, A. Hajat, S.Y. Kim, A.L. Robinson, L. Sheppard, A.A. Szpiro, and J.D. Marshall, 2021: Disparities in air pollution exposure in the United States by race/ethnicity and income, 1990–2010. Environmental Health Perspectives, 129 (12), 127005. https://doi.org/10.1289/ehp8584
- Mikati, I., A.F. Benson, T.J. Luben, J.D. Sacks, and J. Richmond-Bryant, 2018: Disparities in distribution of particulate matter emission sources by race and poverty status. American Journal of Public Health, 108 (4), 480–485. https://doi.org/10.2105/ajph.2017.304297
- Tessum, C.W., D.A. Paolella, S.E. Chambliss, J.S. Apte, J.D. Hill, and J.D. Marshall, 2021: PM2.5 polluters disproportionately and systemically affect people of color in the United States. Science Advances, 7 (18), 4491. https://doi.org/10.1126/sciadv.abf4491
- Thind, M.P.S., C.W. Tessum, I.L. Azevedo, and J.D. Marshall, 2019: Fine particulate air pollution from electricity generation in the US: Health impacts by race, income, and geography. Environmental Science & Technology, 53 (23), 14010–14019. https://doi.org/10.1021/acs.est.9b02527
- Mayfield, E.N., J.L. Cohon, N.Z. Muller, I.M.L. Azevedo, and A.L. Robinson, 2019: Quantifying the social equity state of an energy system: Environmental and labor market equity of the shale gas boom in Appalachia. Environmental Research Letters, 14 (12), 124072. https://doi.org/10.1088/1748-9326/ab59cd
- Markandya, A., J. Sampedro, S.J. Smith, R. Van Dingenen, C. Pizarro-Irizar, I. Arto, and M. González-Eguino, 2018: Health co-benefits from air pollution and mitigation costs of the Paris Agreement: A modelling study. The Lancet Planetary Health, 2 (3), e126–e133. https://doi.org/10.1016/s2542-5196(18)30029-9
- Vandyck, T., K. Keramidas, A. Kitous, J.V. Spadaro, R. Van Dingenen, M. Holland, and B. Saveyn, 2018: Air quality co-benefits for human health and agriculture counterbalance costs to meet Paris Agreement pledges. Nature Communications, 9 (1), 4939. https://doi.org/10.1038/s41467-018-06885-9
- Zhang, Y., S.J. Smith, J.H. Bowden, Z. Adelman, and J.J. West, 2017: Co-benefits of global, domestic, and sectoral greenhouse gas mitigation for US air quality and human health in 2050. Environmental Research Letters, 12 (11), 114033. https://doi.org/10.1088/1748-9326/aa8f76
- Zhu, S., M. Mac Kinnon, A. Carlos-Carlos, S.J. Davis, and S. Samuelsen, 2022: Decarbonization will lead to more equitable air quality in California. Nature Communications, 13 (1), 5738. https://doi.org/10.1038/s41467-022-33295-9
- Gallagher, C.L. and T. Holloway, 2020: Integrating air quality and public health benefits in U.S. decarbonization strategies. Frontiers in Public Health, 8, 563358. https://doi.org/10.3389/fpubh.2020.563358
- Mayfield, E.N., 2022: Phasing out coal power plants based on cumulative air pollution impact and equity objectives in net zero energy system transitions. Environmental Research: Infrastructure and Sustainability, 2 (2), 021004. https://doi.org/10.1088/2634-4505/ac70f6
- Sergi, B.J., P.J. Adams, N.Z. Muller, A.L. Robinson, S.J. Davis, J.D. Marshall, and I.L. Azevedo, 2020: Optimizing emissions reductions from the U.S. power sector for climate and health benefits. Environmental Science & Technology, 54 (12), 7513–7523. https://doi.org/10.1021/acs.est.9b06936
- Barbose, G., R. Wiser, J. Heeter, T. Mai, L. Bird, M. Bolinger, A. Carpenter, G. Heath, D. Keyser, J. Macknick, A. Mills, and D. Millstein, 2016: A retrospective analysis of benefits and impacts of U.S. renewable portfolio standards. Energy Policy, 96, 645–660. https://doi.org/10.1016/j.enpol.2016.06.035
- Buonocore, J.J., P. Luckow, G. Norris, J.D. Spengler, B. Biewald, J. Fisher, and J.I. Levy, 2016: Health and climate benefits of different energy-efficiency and renewable energy choices. Nature Climate Change, 6 (1), 100–105. https://doi.org/10.1038/nclimate2771
- Dimanchev, E.G., S. Paltsev, M. Yuan, D. Rothenberg, C.W. Tessum, J.D. Marshall, and N.E. Selin, 2019: Health co-benefits of sub-national renewable energy policy in the US. Environmental Research Letters, 14 (8), 085012. https://doi.org/10.1088/1748-9326/ab31d9
- Millstein, D., R. Wiser, M. Bolinger, and G. Barbose, 2017: The climate and air-quality benefits of wind and solar power in the United States. Nature Energy, 2 (9), 17134. https://doi.org/10.1038/nenergy.2017.134
- Qiu, M., C.M. Zigler, and N.E. Selin, 2022: Impacts of wind power on air quality, premature mortality, and exposure disparities in the United States. Science Advances, 8 (48), 8762. https://doi.org/10.1126/sciadv.abn8762
- Siler-Evans, K., I.L. Azevedo, M.G. Morgan, and J. Apt, 2013: Regional variations in the health, environmental, and climate benefits of wind and solar generation. Proceedings of the National Academy of Sciences of the United States of America, 110 (29), 11768–11773. https://doi.org/10.1073/pnas.1221978110
- Grabow, M.L., S.N. Spak, T. Holloway, B. Stone, Jr. , A.C. Mednick, and J.A. Patz, 2012: Air quality and exercise-related health benefits from reduced car travel in the midwestern United States. Environmental Health Perspectives, 120 (1), 68–76. https://doi.org/10.1289/ehp.1103440
- Tong, F. and I.M.L. Azevedo, 2020: What are the best combinations of fuel-vehicle technologies to mitigate climate change and air pollution effects across the United States? Environmental Research Letters, 15 (7), 074046. https://doi.org/10.1088/1748-9326/ab8a85
- Deetjen, T.A., L. Walsh, and P. Vaishnav, 2021: US residential heat pumps: The private economic potential and its emissions, health, and grid impacts. Environmental Research Letters, 16 (8), 084024. https://doi.org/10.1088/1748-9326/ac10dc
- Commane, R. and L.D. Schiferl, 2022: Climate mitigation policies for cities must consider air quality impacts. Chem, 8 (4), 910–923. https://doi.org/10.1016/j.chempr.2022.02.006
- Gross, S., 2020: Renewables, Land Use, and Local Opposition in the United States. The Brookings Institution, 24 pp. https://www.brookings.edu/research/renewables-land-use-and-local-opposition-in-the-united-states/
- Mulvaney, D., 2017: Identifying the roots of Green Civil War over utility-scale solar energy projects on public lands across the American Southwest. Journal of Land Use Science, 12 (6), 493–515. https://doi.org/10.1080/1747423x.2017.1379566
- Nielsen, J.A.E., K. Stavrianakis, and Z. Morrison, 2022: Community acceptance and social impacts of carbon capture, utilization and storage projects: A systematic meta-narrative literature review. PLoS ONE, 17 (8), e0272409. https://doi.org/10.1371/journal.pone.0272409
- Cox, E., E. Spence, and N. Pidgeon, 2020: Public perceptions of carbon dioxide removal in the United States and the United Kingdom. Nature Climate Change, 10 (8), 744–749. https://doi.org/10.1038/s41558-020-0823-z
- Hernandez, R.R., S.B. Easter, M.L. Murphy-Mariscal, F.T. Maestre, M. Tavassoli, E.B. Allen, C.W. Barrows, J. Belnap, R. Ochoa-Hueso, S. Ravi, and M.F. Allen, 2014: Environmental impacts of utility-scale solar energy. Renewable and Sustainable Energy Reviews, 29, 766–779. https://doi.org/10.1016/j.rser.2013.08.041
- Hernandez, R.R., M.K. Hoffacker, M.L. Murphy-Mariscal, G.C. Wu, and M.F. Allen, 2015: Solar energy development impacts on land cover change and protected areas. Proceedings of the National Academy of Sciences of the United States of America, 112 (44), 13579–13584. https://doi.org/10.1073/pnas.1517656112
- Laranjeiro, T., R. May, and F. Verones, 2018: Impacts of onshore wind energy production on birds and bats: Recommendations for future life cycle impact assessment developments. The International Journal of Life Cycle Assessment, 23 (10), 2007–2023. https://doi.org/10.1007/s11367-017-1434-4
- Hall, P.K., W. Morgan, and J. Richardson, 2022: Land Use Conflicts Between Wind and Solar Renewable Energy and Agricultural Uses. The National Agricultural Law Center. https://researchrepository.wvu.edu/cgi/viewcontent.cgi?article=1104&context=law_faculty
- Hill, J., 2022: The sobering truth about corn ethanol. Proceedings of the National Academy of Sciences of the United States of America, 119 (11), e2200997119. https://doi.org/10.1073/pnas.2200997119
- Lark, T.J., N.P. Hendricks, A. Smith, N. Pates, S.A. Spawn-Lee, M. Bougie, E.G. Booth, C.J. Kucharik, and H.K. Gibbs, 2022: Environmental outcomes of the US renewable fuel standard. Proceedings of the National Academy of Sciences of the United States of America, 119 (9), e2101084119. https://doi.org/10.1073/pnas.2101084119
- Wu, G.C., E. Leslie, O. Sawyerr, D.R. Cameron, E. Brand, B. Cohen, D. Allen, M. Ochoa, and A. Olson, 2020: Low-impact land use pathways to deep decarbonization of electricity. Environmental Research Letters, 15 (7), 074044. https://doi.org/10.1088/1748-9326/ab87d1
- Gerrard, M.B. and E. McTiernan, 2020: New York’s new statute on siting renewable energy facilities. New York Law Journal, 263 (93). https://scholarship.law.columbia.edu/faculty_scholarship/3026
- Moch, J.M. and H. Lee, 2022: The Challenges of Decarbonizing the U.S. Electric Grid by 2035. Harvard University, Harvard Kennedy School, Belfer Center, Cambridge, MA. https://www.belfercenter.org/publication/challenges-decarbonizing-us-electric-grid-2035
- Susskind, L., J. Chun, A. Gant, C. Hodgkins, J. Cohen, and S. Lohmar, 2022: Sources of opposition to renewable energy projects in the United States. Energy Policy, 165, 112922. https://doi.org/10.1016/j.enpol.2022.112922
- Grubert, E. and A. Marshall, 2022: Water for energy: Characterizing co-evolving energy and water systems under twin climate and energy system nonstationarities. WIREs Water, 9 (2), e1576. https://doi.org/10.1002/wat2.1576
- Grubert, E. and K.T. Sanders, 2018: Water use in the United States energy system: A national assessment and unit process inventory of water consumption and withdrawals. Environmental Science & Technology, 52 (11), 6695–6703. https://doi.org/10.1021/acs.est.8b00139
- Peer, R.A.M., E. Grubert, and K.T. Sanders, 2019: A regional assessment of the water embedded in the US electricity system. Environmental Research Letters, 14 (8), 084014. https://doi.org/10.1088/1748-9326/ab2daa
- Qin, Y., N.D. Mueller, S. Siebert, R.B. Jackson, A. AghaKouchak, J.B. Zimmerman, D. Tong, C. Hong, and S.J. Davis, 2019: Flexibility and intensity of global water use. Nature Sustainability, 2 (6), 515–523. https://doi.org/10.1038/s41893-019-0294-2
- Tarroja, B., R.A.M. Peer, K.T. Sanders, and E. Grubert, 2020: How do non-carbon priorities affect zero-carbon electricity systems? A case study of freshwater consumption and cost for Senate Bill 100 compliance in California. Applied Energy, 265, 114824. https://doi.org/10.1016/j.apenergy.2020.114824
- Grubert, E., 2023: Water consumption from electrolytic hydrogen in a carbon-neutral US energy system. Cleaner Production Letters, 4, 100037. https://doi.org/10.1016/j.clpl.2023.100037
- Lampert, D.J., H. Cai, and A. Elgowainy, 2016: Wells to wheels: Water consumption for transportation fuels in the United States. Energy & Environmental Science, 9 (3), 787–802. https://doi.org/10.1039/c5ee03254g
- Rosa, L., D.L. Sanchez, G. Realmonte, D. Baldocchi, and P. D'Odorico, 2021: The water footprint of carbon capture and storage technologies. Renewable and Sustainable Energy Reviews, 138, 110511. https://doi.org/10.1016/j.rser.2020.110511
- Lovering, J., M. Swain, L. Blomqvist, and R.R. Hernandez, 2022: Land-use intensity of electricity production and tomorrow’s energy landscape. PLoS ONE, 17 (7), e0270155. https://doi.org/10.1371/journal.pone.0270155
- BLS, 2022: Local Area Unemployment Statistics. U.S. Bureau of Labor Statistics. https://www.bls.gov/lau/home.htm
- DOE, 2022: United States Energy and Employment Report 2022. U.S. Department of Energy. https://www.energy.gov/sites/default/files/2022-06/USEER%202022%20National%20Report_1.pdf
- DOL, n.d.: Prevailing Wage and the Inflation Reduction Act. U.S. Department of Labor, accessed May 9, 2023. https://www.dol.gov/agencies/whd/ira
- NASEO and EFI, 2020: The 2019 U.S. Energy & Employment Report. National Association of State Energy Officials and Energy Futures Initiative. https://www.naseo.org/data/sites/1/documents/publications/useer-2019-us-energy-employment-report1.pdf
- Mayfield, E.N., J.L. Cohon, N.Z. Muller, I.M.L. Azevedo, and A.L. Robinson, 2019: Cumulative environmental and employment impacts of the shale gas boom. Nature Sustainability, 2 (12), 1122–1131. https://doi.org/10.1038/s41893-019-0420-1
- Mayfield, E., J. Jenkins, E. Larson, and C. Greig, 2021: Labor Pathways to Achieve Net-Zero Emissions in the United States by Mid-Century. USAEE Working Paper No. 21-494. U.S. Association for Energy Economics, 83 pp. https://doi.org/10.2139/ssrn.3834083
- Bergquist, P., M. Mildenberger, and L.C. Stokes, 2020: Combining climate, economic, and social policy builds public support for climate action in the US. Environmental Research Letters, 15 (5), 054019. https://doi.org/10.1088/1748-9326/ab81c1
- Blyth, W., J. Speirs, and R. Gross, 2014: Low carbon jobs: The evidence for net job creation from policy support for energy efficiency and renewable energy. In: BIEE 10th Academic Conference. 17–18 September 2014. U.K. Energy Research Centre, 31 pp. https://www.biee.org/wpcms/wp-content/uploads/Speirs-Low-carbon-jobs-The-evidence-for-net-job-creation.pdf
- Pollin, R. and S. Chakraborty, 2020: Job Creation Estimates Through Proposed Economic Stimulus Measures. University of Massachusetts, Political Economy Research Institute, Amherst, MA. https://peri.umass.edu/publication/item/1297-job-creation-estimates-through-proposed-economic-stimulus-measures
- Wei, M., S. Patadia, and D.M. Kammen, 2010: Putting renewables and energy efficiency to work: How many jobs can the clean energy industry generate in the US? Energy Policy, 38 (2), 919–931. https://doi.org/10.1016/j.enpol.2009.10.044
- Mayfield, E. and J. Jenkins, 2021: Influence of high road labor policies and practices on renewable energy costs, decarbonization pathways, and labor outcomes. Environmental Research Letters, 16 (12), 124012. https://doi.org/10.1088/1748-9326/ac34ba
- Bergquist, P., S. Ansolabehere, S. Carley, and D. Konisky, 2020: Backyard voices: How sense of place shapes views of large-scale energy transmission infrastructure. Energy Research & Social Science, 63, 101396. https://doi.org/10.1016/j.erss.2019.101396
- Chapman, A.J., B.C. McLellan, and T. Tezuka, 2018: Prioritizing mitigation efforts considering co-benefits, equity and energy justice: Fossil fuel to renewable energy transition pathways. Applied Energy, 219, 187–198. https://doi.org/10.1016/j.apenergy.2018.03.054
- Henry, M.S., M.D. Bazilian, and C. Markuson, 2020: Just transitions: Histories and futures in a post-COVID world. Energy Research & Social Science, 68, 101668. https://doi.org/10.1016/j.erss.2020.101668
- Cha, J.M., 2020: A just transition for whom? Politics, contestation, and social identity in the disruption of coal in the Powder River Basin. Energy Research and Social Science, 69, 101657. https://doi.org/10.1016/j.erss.2020.101657
- Pai, S., H. Zerriffi, J. Jewell, and J. Pathak, 2020: Solar has greater techno-economic resource suitability than wind for replacing coal mining jobs. Environmental Research Letters, 15 (3), 034065. https://doi.org/10.1088/1748-9326/ab6c6d
- Carley, S., T.P. Evans, and D.M. Konisky, 2018: Adaptation, culture, and the energy transition in American coal country. Energy Research & Social Science, 37, 133–139. https://doi.org/10.1016/j.erss.2017.10.007
- Pollin, R. and B. Callaci, 2019: The economics of just transition: A framework for supporting fossil fuel-dependent workers and communities in the United States. Labor Studies Journal, 44 (2), 93–138. https://doi.org/10.1177/0160449x18787051
- CRS, 2022: Proposed Tax Preference for Domestic Content in Energy Infrastructure. CRS Report IN11983. Congressional Research Service. https://crsreports.congress.gov/product/pdf/in/in11983
- NETL, 2022: Energy Community Tax Credit Bonus. U.S. Department of Energy, National Energy Technology Laboratory. https://energycommunities.gov/energy-community-tax-credit-bonus/
- Jenkins, J.D., E.N. Mayfield, E.D. Larson, S.W. Pacala, and C. Greig, 2021: Mission net-zero America: The nation-building path to a prosperous, net-zero emissions economy. Joule, 5 (11), 2755–2761. https://doi.org/10.1016/j.joule.2021.10.016
- Carley, S. and D.M. Konisky, 2020: The justice and equity implications of the clean energy transition. Nature Energy, 5 (8), 569–577. https://doi.org/10.1038/s41560-020-0641-6
- Jenkins, K., D. McCauley, R. Heffron, H. Stephan, and R. Rehner, 2016: Energy justice: A conceptual review. Energy Research & Social Science, 11, 174–182. https://doi.org/10.1016/j.erss.2015.10.004
- Banzhaf, S., L. Ma, and C. Timmins, 2019: Environmental justice: The economics of race, place, and pollution. Journal of Economic Perspectives, 33 (1), 185–208. https://doi.org/10.1257/jep.33.1.185
- Fefferman, N., C.-F. Chen, G. Bonilla, H. Nelson, and C.-P. Kuo, 2021: How limitations in energy access, poverty, and socioeconomic disparities compromise health interventions for outbreaks in urban settings. iScience, 24 (12), 103389. https://doi.org/10.1016/j.isci.2021.103389
- Hernández, D., 2016: Understanding ‘energy insecurity’ and why it matters to health. Social Science & Medicine, 167, 1–10. https://doi.org/10.1016/j.socscimed.2016.08.029
- Lane, H.M., R. Morello-Frosch, J.D. Marshall, and J.S. Apte, 2022: Historical redlining is associated with present-day air pollution disparities in U.S. cities. Environmental Science & Technology Letters, 9 (4), 345–350. https://doi.org/10.1021/acs.estlett.1c01012
- Brown, M., A. Soni, M. Lapsa, and K. Southworth, 2020: Low-Income Energy Affordability: Conclusions from a Literature Review. ORNL/TM-2019/1150. U.S. Department of Energy, Oak Ridge National Laboratory. https://info.ornl.gov/sites/publications/files/pub124723.pdf
- Drehobl, A. and L. Ross, 2016: Lifting the High Energy Burden in America’s Largest Cities: How Energy Efficiency Can Improve Low Income and Underserved Communities. American Council for an Energy Efficient Economy. https://www.aceee.org/sites/default/files/publications/researchreports/u1602.pdf
- Drehobl, A., L. Ross, and R. Ayala, 2020: How High Are Household Energy Burdens? An Assessment of National and Metropolitan Energy Burden across the United States. American Council for an Energy-Efficient Economy, Washington, DC. https://www.aceee.org/sites/default/files/pdfs/u2006.pdf
- Lewis, J., D. Hernández, and A.T. Geronimus, 2020: Energy efficiency as energy justice: Addressing racial inequities through investments in people and places. Energy Efficiency, 13 (3), 419–432. https://doi.org/10.1007/s12053-019-09820-z
- Reames, T.G., 2016: A community-based approach to low-income residential energy efficiency participation barriers. Local Environment, 21 (12), 1449–1466. https://doi.org/10.1080/13549839.2015.1136995
- Ross, L., A. Drehobl, and B. Stickles, 2018: The High Cost of Energy in Rural America: Household Energy Burdens and Opportunities for Energy Efficiency. American Council for an Energy-Efficient Economy, Washington DC. https://www.aceee.org/sites/default/files/publications/researchreports/u1806.pdf
- Bednar, D.J. and T.G. Reames, 2020: Recognition of and response to energy poverty in the United States. Nature Energy, 5 (6), 432–439. https://doi.org/10.1038/s41560-020-0582-0
- Benz, S.A. and J.A. Burney, 2021: Widespread race and class disparities in surface urban heat extremes across the United States. Earth's Future, 9 (7), e2021EF002016. https://doi.org/10.1029/2021ef002016
- Benz, S.A., S.J. Davis, and J.A. Burney, 2021: Drivers and projections of global surface temperature anomalies at the local scale. Environmental Research Letters, 16 (6), 064093. https://doi.org/10.1088/1748-9326/ac0661
- McDonald, R.I., T. Biswas, C. Sachar, I. Housman, T.M. Boucher, D. Balk, D. Nowak, E. Spotswood, C.K. Stanley, and S. Leyk, 2021: The tree cover and temperature disparity in US urbanized areas: Quantifying the association with income across 5,723 communities. PLoS ONE, 16 (4), e0249715. https://doi.org/10.1371/journal.pone.0249715
- Hoffman, J.S., V. Shandas, and N. Pendleton, 2020: The effects of historical housing policies on resident exposure to intra-urban heat: A study of 108 US urban areas. Climate, 8 (1), 12. https://doi.org/10.3390/cli8010012
- Plumer, B. and N. Popovich, 2020: How decades of racist housing policy left neighborhoods sweltering. The New York Times, August 24, 2020. https://www.nytimes.com/interactive/2020/08/24/climate/racism-redlining-cities-global-warming.html
- Chen, M., G.A. Ban-Weiss, and K.T. Sanders, 2020: Utilizing smart-meter data to project impacts of urban warming on residential electricity use for vulnerable populations in Southern California. Environmental Research Letters, 15 (6), 064001. https://doi.org/10.1088/1748-9326/ab6fbe
- Sherwin, E.D. and I.M.L. Azevedo, 2020: Characterizing the association between low-income electric subsidies and the intra-day timing of electricity consumption. Environmental Research Letters, 15 (9), 094089. https://doi.org/10.1088/1748-9326/aba030
- Cong, S., D. Nock, Y.L. Qiu, and B. Xing, 2022: Unveiling hidden energy poverty using the energy equity gap. Nature Communications, 13 (1), 2456. https://doi.org/10.1038/s41467-022-30146-5
- Scheier, E. and N. Kittner, 2022: A measurement strategy to address disparities across household energy burdens. Nature Communications, 13 (1), 288. https://doi.org/10.1038/s41467-021-27673-y
- Gillingham, K., R.G. Newell, and K. Palmer, 2009: Energy efficiency economics and policy. Annual Review of Resource Economics, 1 (1), 597–620. https://doi.org/10.1146/annurev.resource.102308.124234
- Baniassadi, A., D.J. Sailor, E.S. Krayenhoff, A.M. Broadbent, and M. Georgescu, 2019: Passive survivability of buildings under changing urban climates across eight US cities. Environmental Research Letters, 14 (7), 074028. https://doi.org/10.1088/1748-9326/ab28ba
- Sunter, D.A., S. Castellanos, and D.M. Kammen, 2019: Disparities in rooftop photovoltaics deployment in the United States by race and ethnicity. Nature Sustainability, 2 (1), 71–76. https://doi.org/10.1038/s41893-018-0204-z
- Welton, S. and J.B. Eisen, 2019: Clean energy justice: Charting an emerging agenda. Harvard Environmental Law Review, 43, 307–371. https://scholarship.law.upenn.edu/faculty_scholarship/2842
- Carley, S., T.P. Evans, M. Graff, and D.M. Konisky, 2018: A framework for evaluating geographic disparities in energy transition vulnerability. Nature Energy, 3 (8), 621–627. https://doi.org/10.1038/s41560-018-0142-z
- Jessel, S., S. Sawyer, and D. Hernández, 2019: Energy, poverty, and health in climate change: A comprehensive review of an emerging literature. Frontiers in Public Health, 7, 357. https://doi.org/10.3389/fpubh.2019.00357
- IEA, 2021: The Role of Critical Minerals in Clean Energy Transitions. International Energy Agency. https://www.iea.org/reports/the-role-of-critical-minerals-in-clean-energy-transitions
- Lee, J., M. Bazilian, and S. Hastings-Simon, 2021: The material foundations of a low-carbon economy. One Earth, 4 (3), 331–334. https://doi.org/10.1016/j.oneear.2021.02.015
- Lee, J., M. Bazilian, B. Sovacool, K. Hund, S.M. Jowitt, T.P. Nguyen, A. Månberger, M. Kah, S. Greene, C. Galeazzi, K. Awuah-Offei, M. Moats, J. Tilton, and S. Kukoda, 2020: Reviewing the material and metal security of low-carbon energy transitions. Renewable and Sustainable Energy Reviews, 124, 109789. https://doi.org/10.1016/j.rser.2020.109789
- Sovacool, B.K., S.H. Ali, M. Bazilian, B. Radley, B. Nemery, J. Okatz, and D. Mulvaney, 2020: Sustainable minerals and metals for a low-carbon future. Science, 367 (6437), 30–33. https://doi.org/10.1126/science.aaz6003
- Nassar, N.T. and S.M. Fortier, 2021: Methodology and Technical Input for the 2021 Review and Revision of the U.S. Critical Minerals List. USGS Open-File Report 2021–1045. U.S. Geological Survey, 31 pp. https://doi.org/10.3133/ofr20211045
- U.S. Geological Survey, 2022: 2022 final list of critical minerals. Federal Register, 87 (37), 10381–10382. https://www.federalregister.gov/documents/2022/02/24/2022-04027/2022-final-list-of-critical-minerals
- Executive Office of the President, 2017: Executive Order 13817: A federal strategy to ensure secure and reliable supplies of critical minerals. Federal Register, 82 (246), 60835–60837. https://www.federalregister.gov/documents/2017/12/26/2017-27899/a-federal-strategy-to-ensure-secure-and-reliable-supplies-of-critical-minerals
- Executive Office of the President, 2020: Executive Order 13953: Addressing the threat to the domestic supply chain from reliance on critical minerals from foreign adversaries and supporting the domestic mining and processing industries. Federal Register, 85 (193), 62539–62544. https://www.federalregister.gov/documents/2020/10/05/2020-22064/addressing-the-threat-to-the-domestic-supply-chain-from-reliance-on-critical-minerals-from-foreign
- Fortier, S.M., J.H. DeYoung Jr., E.S. Sangine, and E.K. Schnebele, 2015: Comparison of U.S. Net Import Reliance for Nonfuel Mineral Commodities—A 60-Year Retrospective (1954–1984–2014). Fact Sheet 2015–3082. U.S. Geological Survey, 4 pp. https://doi.org/10.3133/fs20153082
- DOE, 2022: The Inflation Reduction Act Drives Significant Emissions Reductions and Positions America to Reach our Climate Goals. DOE/OP-0018. U.S. Department of Energy, Office of Policy, 6 pp. https://www.energy.gov/sites/default/files/2022-08/8.18%20InflationReductionAct_Factsheet_Final.pdf
- C2ES, 2023: State Climate Policy Maps. Center for Climate and Energy Solutions. https://www.c2es.org/content/state-climate-policy/
- UNFCCC, 2022: Actor Tracking. United Nations Framework Convention on Climate Change. https://climateaction.unfccc.int/actors
- Peñasco, C., L.D. Anadón, and E. Verdolini, 2021: Systematic review of the outcomes and trade-offs of ten types of decarbonization policy instruments. Nature Climate Change, 11 (3), 257–265. https://doi.org/10.1038/s41558-020-00971-x
- Agriculture Resilience Act. H.R. 2803, 117th Congress, 2021. https://www.congress.gov/bill/117th-congress/house-bill/2803/text
- SEC, 2022: SEC proposes rules to enhance and standardize climate-related disclosures for investors. U.S. Securities and Exchange Commission, Washington, DC, March 21, 2022. https://www.sec.gov/news/press-release/2022-46
- Bjørn, A., S.M. Lloyd, M. Brander, and H.D. Matthews, 2022: Renewable energy certificates threaten the integrity of corporate science-based targets. Nature Climate Change, 12 (6), 539–546. https://doi.org/10.1038/s41558-022-01379-5
- Curtis, Q., J. Fisch, and A.Z. Robertson, 2021: Do ESG funds deliver on their promises? Michigan Law Review, 120 (3). https://doi.org/10.36644/mlr.120.3.esg
- GHG Protocol, 2022: Land Sector and Removals Guidance. Greenhouse Gas Protocol. https://ghgprotocol.org/land-sector-and-removals-guidance
- Oldfield, E.E., A.J. Eagle, R.L. Rubin, J. Rudek, J. Sanderman, and D.R. Gordon, 2022: Crediting agricultural soil carbon sequestration. Science, 375 (6586), 1222–1225. https://doi.org/10.1126/science.abl7991
- Amorim-Maia, A.T., I. Anguelovski, E. Chu, and J. Connolly, 2022: Intersectional climate justice: A conceptual pathway for bridging adaptation planning, transformative action, and social equity. Urban Climate, 41, 101053. https://doi.org/10.1016/j.uclim.2021.101053
- Simon, K., G. Diprose, and A.C. Thomas, 2020: Community-led initiatives for climate adaptation and mitigation. Kōtuitui: New Zealand Journal of Social Sciences Online, 15 (1), 93–105. https://doi.org/10.1080/1177083x.2019.1652659
- Troxler, T.G., A.C. Clement, Y. Arditi-Rocha, G. Beesing, M. Bhat, J. Bolson, C. Cabán-Alemán, K. Castillo, O. Collins, M. Cruz, A. Dodd, S.D. Evans, A.L. Fleming, C. Genatios, J. Gilbert, A. Hernandez, C. Holder, M. Ilcheva, E. Kelly, and E. Wheaton, 2021: A system for resilience learning: Developing a community-driven, multi-sector research approach for greater preparedness and resilience to long-term climate stressors and extreme events in the Miami metropolitan region. Journal of Extreme Events, 08 (03), 2150019. https://doi.org/10.1142/s2345737621500196
- Farbes, J., B. Haley, and R. Jones, 2021: Marginal Abatement Cost Curves for U.S. Net-Zero Energy Systems: A Systems Approach. Evolved Energy Research, 52 pp. https://www.evolved.energy/post/mac2-0
- IPCC, 2022: Summary for policymakers. In: Climate Change 2022: Impacts, Adaptation and Vulnerability. Contribution of Working Group II to the Sixth Assessment Report of the Intergovernmental Panel on Climate Change. Pörtner, H.-O., D.C. Roberts, M. Tignor, E.S. Poloczanska, K. Mintenbeck, A. Alegría, M. Craig, S. Langsdorf, S. Löschke, V. Möller, A. Okem, and B. Rama, Eds. Cambridge University Press, Cambridge, UK and New York, NY, USA, 3–33. https://doi.org/10.1017/9781009325844.001
- Visit Florida, 2022: Florida Visitor Estimates [Webpage]. https://www.visitflorida.org/resources/research/
- Visit Orlando, 2019: Orlando announces record 75 million visitors, solidifies ranking as No. 1 U.S. travel destination. Visit Orlando, Orlando, FL, May 9, 2019. https://www.visitorlando.com/media/press-releases/post/orlando-announces-record-75-million-visitors-solidifies-ranking-as-no-1-u-s-travel-destination/
- FDOT, 2022: Central Florida Autonomous Vehicle Proving Ground. Florida Department of Transportation. https://www.fdot.gov/traffic/teo-divisions.shtm/cav-ml-stamp/cv/maplocations/cf-av.shtm
- Ponnaluri, R., F. Heery, and V.Y. Tillander, 2017: The Florida connected and automated vehicle initiative: A focus on deployment. ITE Journal, 87 (10). https://trid.trb.org/view/1484058
- MetroPlan Orlando, 2020: MetroPlan Orlando CAV Readiness Study: Final Report. MetroPlan Orlando. https://metroplanorlando.gov/wp-content/uploads/MetroPlan-CAV-Readiness-7.1.20-Final.pdf
- USDA, 2009: Let’s Glean! United We Serve Toolkit. U.S. Department of Agriculture, 8 pp. https://www.usda.gov/sites/default/files/documents/usda_gleaning_toolkit.pdf
- EIA, 1992: Housing Characteristics 1990. DOE/EIA-0314(90). U.S. Energy Information Administration, Washington, DC. https://www.eia.gov/consumption/residential/index.php
- EIA, 1997: Manufacturing Energy Consumption Survey 1994. U.S. Energy Information Administration. https://www.eia.gov/consumption/manufacturing/data/1994/index.php?view=data
- EIA, 2021: 2018 Manufacturing Energy Consumption Survey. U.S. Energy Information Administration. https://www.eia.gov/consumption/manufacturing/data/2018/
- EIA, 2022: State Energy Data System (SEDS). U.S. Energy Information Administration. https://www.eia.gov/state/seds/
- The World Bank, 2021: World Development Indicators. World Bank Group.
- The World Bank, 2022: World Development Indicators. World Bank Group.
- IPCC, 2019: 2019 Refinement to the 2006 IPCC Guidelines for National Greenhouse Gas Inventories. Calvo Buendia, E., K. Tanabe, A. Kranjc, J. Baasansuren, M. Fukuda, S. Ngarize, A. Osako, Y. Pyrozhenko, P. Shermanau, and S. Federici, Eds. Intergovernmental Panel on Climate Change, Switzerland. https://www.ipcc-nggip.iges.or.jp/public/2019rf/index.html
- Matthews, H.D., N.P. Gillett, P.A. Stott, and K. Zickfeld, 2009: The proportionality of global warming to cumulative carbon emissions. Nature, 459 (7248), 829–832. https://doi.org/10.1038/nature08047
- Lyon, C., E.E. Saupe, C.J. Smith, D.J. Hill, A.P. Beckerman, L.C. Stringer, R. Marchant, J. McKay, A. Burke, P. O’Higgins, A.M. Dunhill, B.J. Allen, J. Riel-Salvatore, and T. Aze, 2022: Climate change research and action must look beyond 2100. Global Change Biology, 28 (2), 349–361. https://doi.org/10.1111/gcb.15871
- McGlynn, E., S. Li, M. F. Berger, M. Amend, and K. L. Harper, 2022: Addressing uncertainty and bias in land use, land use change, and forestry greenhouse gas inventories. Climatic Change, 170 (1), 5. https://doi.org/10.1007/s10584-021-03254-2
- Nisbet, E.G., R.E. Fisher, D. Lowry, J.L. France, G. Allen, S. Bakkaloglu, T.J. Broderick, M. Cain, M. Coleman, J. Fernandez, G. Forster, P.T. Griffiths, C.P. Iverach, B.F.J. Kelly, M.R. Manning, P.B.R. Nisbet-Jones, J.A. Pyle, A. Townsend-Small, A. al-Shalaan, N. Warwick, and G. Zazzeri, 2020: Methane mitigation: Methods to reduce emissions, on the path to the Paris Agreement. Reviews of Geophysics, 58 (1), e2019RG000675. https://doi.org/10.1029/2019rg000675
- Saunois, M., A.R. Stavert, B. Poulter, P. Bousquet, J.G. Canadell, R.B. Jackson, P.A. Raymond, E.J. Dlugokencky, S. Houweling, P.K. Patra, P. Ciais, V.K. Arora, D. Bastviken, P. Bergamaschi, D.R. Blake, G. Brailsford, L. Bruhwiler, K.M. Carlson, M. Carrol, S. Castaldi, N. Chandra, C. Crevoisier, P.M. Crill, K. Covey, C.L. Curry, G. Etiope, C. Frankenberg, N. Gedney, M.I. Hegglin, L. Höglund-Isaksson, G. Hugelius, M. Ishizawa, A. Ito, G. Janssens-Maenhout, K.M. Jensen, F. Joos, T. Kleinen, P.B. Krummel, R.L. Langenfelds, G.G. Laruelle, L. Liu, T. Machida, S. Maksyutov, K.C. McDonald, J. McNorton, P.A. Miller, J.R. Melton, I. Morino, J. Müller, F. Murguia-Flores, V. Naik, Y. Niwa, S. Noce, S. O'Doherty, R.J. Parker, C. Peng, S. Peng, G.P. Peters, C. Prigent, R. Prinn, M. Ramonet, P. Regnier, W.J. Riley, J.A. Rosentreter, A. Segers, I.J. Simpson, H. Shi, S.J. Smith, L.P. Steele, B.F. Thornton, H. Tian, Y. Tohjima, F.N. Tubiello, A. Tsuruta, N. Viovy, A. Voulgarakis, T.S. Weber, M. van Weele, G.R. van der Werf, R.F. Weiss, D. Worthy, D. Wunch, Y. Yin, Y. Yoshida, W. Zhang, Z. Zhang, Y. Zhao, B. Zheng, Q. Zhu, Q. Zhu, and Q. Zhuang, 2020: The global methane budget 2000–2017. Earth System Science Data, 12 (3), 1561–1623. https://doi.org/10.5194/essd-12-1561-2020
- Conrad, B.M., D.R. Tyner, and M.R. Johnson, 2023: Robust probabilities of detection and quantification uncertainty for aerial methane detection: Examples for three airborne technologies. Remote Sensing of Environment, 288, 113499. https://doi.org/10.1016/j.rse.2023.113499
- Liu, M.J., K.N. Izquierdo, and D.S. Prince, 2022: Intelligent monitoring of fugitive emissions—Comparison of continuous monitoring with intelligent analytics to other emissions monitoring technologies. The APPEA Journal, 62, 56–65. https://doi.org/10.1071/aj21116
- Norooz Oliaee, J., N.A. Sabourin, S.A. Festa-Bianchet, J.A. Gupta, M.R. Johnson, K.A. Thomson, G.J. Smallwood, and P. Lobo, 2022: Development of a sub-ppb resolution methane sensor using a GaSb-based DFB diode laser near 3270 nm for fugitive emission measurement. ACS Sensors, 7 (2), 564–572. https://doi.org/10.1021/acssensors.1c02444
- Hurtt, G.C., S.W. Pacala, P.R. Moorcroft, J. Caspersen, E. Shevliakova, R.A. Houghton, and B. Moore, 2002: Projecting the future of the U.S. carbon sink. Proceedings of the National Academy of Sciences of the United States of America, 99 (3), 1389–1394. https://doi.org/10.1073/pnas.012249999
- Wu, C., S.R. Coffield, M.L. Goulden, J.T. Randerson, A.T. Trugman, and W.R.L. Anderegg, 2023: Uncertainty in US forest carbon storage potential due to climate risks. Nature Geoscience, 16 (5), 422–429. https://doi.org/10.1038/s41561-023-01166-7
- Kang, J.-N., Y.-M. Wei, L.-C. Liu, R. Han, B.-Y. Yu, and J.-W. Wang, 2020: Energy systems for climate change mitigation: A systematic review. Applied Energy, 263, 114602. https://doi.org/10.1016/j.apenergy.2020.114602
- Bataille, C., H. Waisman, M. Colombier, L. Segafredo, and J. Williams, 2016: The deep decarbonization pathways project (DDPP): Insights and emerging issues. Climate Policy, 16 (sup1), S1–S6. https://doi.org/10.1080/14693062.2016.1179620
- Bistline, J.E., E. Hodson, C.G. Rossmann, J. Creason, B. Murray, and A.R. Barron, 2018: Electric sector policy, technological change, and U.S. emissions reductions goals: Results from the EMF 32 model intercomparison project. Energy Economics, 73, 307–325. https://doi.org/10.1016/j.eneco.2018.04.012
- Arent, D.J., P. Green, Z. Abdullah, T. Barnes, S. Bauer, A. Bernstein, D. Berry, J. Berry, T. Burrell, B. Carpenter, J. Cochran, R. Cortright, M. Curry-Nkansah, P. Denholm, V. Gevorian, M. Himmel, B. Livingood, M. Keyser, J. King, B. Kroposki, T. Mai, M. Mehos, M. Muratori, S. Narumanchi, B. Pivovar, P. Romero-Lankao, M. Ruth, G. Stark, and C. Turchi, 2022: Challenges and opportunities in decarbonizing the U.S. energy system. Renewable and Sustainable Energy Reviews, 169, 112939. https://doi.org/10.1016/j.rser.2022.112939
- Costa Jr., C., E. Wollenberg, M. Benitez, R. Newman, N. Gardner, and F. Bellone, 2022: Roadmap for achieving net-zero emissions in global food systems by 2050. Scientific Reports, 12 (1), 15064. https://doi.org/10.1038/s41598-022-18601-1
- Robertson, G.P., S.K. Hamilton, K. Paustian, and P. Smith, 2022: Land-based climate solutions for the United States. Global Change Biology, 28 (16), 4912–4919. https://doi.org/10.1111/gcb.16267
- Roe, S., C. Streck, M. Obersteiner, S. Frank, B. Griscom, L. Drouet, O. Fricko, M. Gusti, N. Harris, T. Hasegawa, Z. Hausfather, P. Havlík, J. House, G.-J. Nabuurs, A. Popp, M.J.S. Sánchez, J. Sanderman, P. Smith, E. Stehfest, and D. Lawrence, 2019: Contribution of the land sector to a 1.5 °C world. Nature Climate Change, 9 (11), 817–828. https://doi.org/10.1038/s41558-019-0591-9
- Denholm, P., P. Brown, W. Cole, T. Mai, and B. Sergi, 2022: Examining Supply-Side Options to Achieve 100% Clean Electricity by 2035. NREL/TP6A40-81644. U.S. Department of Energy, National Renewable Energy Laboratory, Golden, CO. https://doi.org/10.2172/1885591
- Rosenow, J. and N. Eyre, 2022: Reinventing energy efficiency for net zero. Energy Research & Social Science, 90, 102602. https://doi.org/10.1016/j.erss.2022.102602
- IEA, 2021: Net Zero by 2050: A Roadmap for the Global Energy Sector. International Energy Agency, Paris, France. https://www.iea.org/reports/net-zero-by-2050
- Clark, M. and D. Tilman, 2017: Comparative analysis of environmental impacts of agricultural production systems, agricultural input efficiency, and food choice. Environmental Research Letters, 12 (6), 064016. https://doi.org/10.1088/1748-9326/aa6cd5
- Stehfest, E., L. Bouwman, D.P. van Vuuren, M.G.J. den Elzen, B. Eickhout, and P. Kabat, 2009: Climate benefits of changing diet. Climatic Change, 95 (1), 83–102. https://doi.org/10.1007/s10584-008-9534-6
- Blair, N., C. Augustine, W. Cole, P. Denholm, W. Frazier, M. Geocaris, J. Jorgenson, K. McCabe, K. Podkaminer, A. Prasanna, and B. Sigrin, 2022: Storage Futures Study: Key Learnings for the Coming Decades. NREL/TP-7A40-81779. U.S. Department of Energy, National Renewable Energy Laboratory, Golden, CO. https://www.nrel.gov/docs/fy22osti/81779.pdf
- Comello, S. and S. Reichelstein, 2019: The emergence of cost effective battery storage. Nature Communications, 10 (1), 2038. https://doi.org/10.1038/s41467-019-09988-z
- Bistline, J., S. Bragg-Sitton, W. Cole, B. Dixon, E. Eschmann, J. Ho, A. Kwon, L. Martin, C. Murphy, C. Namovicz, and A. Sowder, 2023: Modeling nuclear energy’s future role in decarbonized energy systems. iScience, 26 (2), 105952. https://doi.org/10.1016/j.isci.2023.105952
- Duan, L., R. Petroski, L. Wood, and K. Caldeira, 2022: Stylized least-cost analysis of flexible nuclear power in deeply decarbonized electricity systems considering wind and solar resources worldwide. Nature Energy, 7 (3), 260–269. https://doi.org/10.1038/s41560-022-00979-x
- Carton, W., A. Asiyanbi, S. Beck, H.J. Buck, and J.F. Lund, 2020: Negative emissions and the long history of carbon removal. WIREs Climate Change, 11 (6), e671. https://doi.org/10.1002/wcc.671
- Fuss, S., W.F. Lamb, M.W. Callaghan, J. Hilaire, F. Creutzig, T. Amann, T. Beringer, W. de Oliveira Garcia, J. Hartmann, T. Khanna, G. Luderer, G.F. Nemet, J. Rogelj, P. Smith, J.L.V. Vicente, J. Wilcox, M. del Mar Zamora Dominguez, and J.C. Minx, 2018: Negative emissions—Part 2: Costs, potentials and side effects. Environmental Research Letters, 13 (6), 063002. https://doi.org/10.1088/1748-9326/aabf9f
- Jägermeyr, J., C. Müller, A.C. Ruane, J. Elliott, J. Balkovic, O. Castillo, B. Faye, I. Foster, C. Folberth, J.A. Franke, K. Fuchs, J.R. Guarin, J. Heinke, G. Hoogenboom, T. Iizumi, A.K. Jain, D. Kelly, N. Khabarov, S. Lange, T.-S. Lin, W. Liu, O. Mialyk, S. Minoli, E.J. Moyer, M. Okada, M. Phillips, C. Porter, S.S. Rabin, C. Scheer, J.M. Schneider, J.F. Schyns, R. Skalsky, A. Smerald, T. Stella, H. Stephens, H. Webber, F. Zabel, and C. Rosenzweig, 2021: Climate impacts on global agriculture emerge earlier in new generation of climate and crop models. Nature Food, 2 (11), 873–885. https://doi.org/10.1038/s43016-021-00400-y
- Stehfest, E., W.-J. van Zeist, H. Valin, P. Havlik, A. Popp, P. Kyle, A. Tabeau, D. Mason-D’Croz, T. Hasegawa, B.L. Bodirsky, K. Calvin, J.C. Doelman, S. Fujimori, F. Humpenöder, H. Lotze-Campen, H. van Meijl, and K. Wiebe, 2019: Key determinants of global land-use projections. Nature Communications, 10 (1), 2166. https://doi.org/10.1038/s41467-019-09945-w
- Strefler, J., E. Kriegler, N. Bauer, G. Luderer, R.C. Pietzcker, A. Giannousakis, and O. Edenhofer, 2021: Alternative carbon price trajectories can avoid excessive carbon removal. Nature Communications, 12 (1), 2264. https://doi.org/10.1038/s41467-021-22211-2
- Workman, M., K. Dooley, G. Lomax, J. Maltby, and G. Darch, 2020: Decision making in contexts of deep uncertainty—An alternative approach for long-term climate policy. Environmental Science & Policy, 103, 77–84. https://doi.org/10.1016/j.envsci.2019.10.002
- Peng, W., G. Iyer, V. Bosetti, V. Chaturvedi, J. Edmonds, A.A. Fawcett, S. Hallegatte, D.G. Victor, D. van Vuuren, and J. Weyant, 2021: Climate policy models need to get real about people—Here’s how. Nature, 594 (7862), 174–176. https://doi.org/10.1038/d41586-021-01500-2
- Brown, M.A., P. Dwivedi, S. Mani, D. Matisoff, J.E. Mohan, J. Mullen, M. Oxman, M. Rodgers, R. Simmons, B. Beasley, and L. Polepeddi, 2021: A framework for localizing global climate solutions and their carbon reduction potential. Proceedings of the National Academy of Sciences of the United States of America, 118 (31), e2100008118. https://doi.org/10.1073/pnas.2100008118
- Daley, D.M., T.D. Abel, M. Stephan, S. Rai, and E. Rogers, 2023: Can polycentric governance lower industrial greenhouse gas emissions: Evidence from the United States. Environmental Policy and Governance. https://doi.org/10.1002/eet.2051
- Hultman, N.E., Clarke, L., , C. Frisch, K. Kennedy, H. McJeon, T. Cyrs, P. Hansel, P. Bodnar, M. Manion, M.R. Edwards, R. Cui, C. Bowman, J. Lund, M.I. Westphal, A. Clapper, J. Jaeger, A. Sen, J. Lou, D. Saha, W. Jaglom, K. Calhoun, K. Igusky, J. deWeese, K. Hammoud, J.C. Altimirano, M. Dennis, C. Henderson, G. Zwicker, and J. O'Neill, 2020: Fusing subnational with national climate action is central to decarbonization: The case of the United States. Nature Communications, 11 (1). https://doi.org/10.1038/s41467-020-18903-w
- Peng, W., G. Iyer, M. Binsted, J. Marlon, L. Clarke, J.A. Edmonds, and D.G. Victor, 2021: The surprisingly inexpensive cost of state-driven emission control strategies. Nature Climate Change, 11 (9), 738–745. https://doi.org/10.1038/s41558-021-01128-0
- Wakiyama, T. and E. Zusman, 2021: The impact of electricity market reform and subnational climate policy on carbon dioxide emissions across the United States: A path analysis. Renewable and Sustainable Energy Reviews, 149, 111337. https://doi.org/10.1016/j.rser.2021.111337
- CDP, 2023: States and Regions Climate Tracker. CDP Worldwide. https://www.cdp.net/en/research/global-reports/states-and-regions-climate-action-tracker
- NC Clean Energy Technology Center, 2022: Database of State Incentives for Renewables & Efficiency. NC State University, NC Clean Energy Technology Center, accessed August 19, 2022. https://www.dsireusa.org/
- UNFCCC, 2023: Global Climate Action. United Nations Framework Convention on Climate Change. https://climateaction.unfccc.int/
- ETC, 2018: Mission Possible: Reaching Net-Zero Carbon Emissions from Harder-to-Abate Sectors. Energy Transitions Commission. https://www.energy-transitions.org/publications/mission-possible/
- Grubert, E. and S. Hastings-Simon, 2022: Designing the mid-transition: A review of medium-term challenges for coordinated decarbonization in the United States. WIREs Climate Change, 13 (3), e768. https://doi.org/10.1002/wcc.768
- Baker, E., A.P. Goldstein, and I.M.L. Azevedo, 2021: A perspective on equity implications of net zero energy systems. Energy and Climate Change, 2, 100047. https://doi.org/10.1016/j.egycc.2021.100047
- Johnson, J.X. and J. Novacheck, 2015: Emissions reductions from expanding state-level renewable portfolio standards. Environmental Science & Technology, 49 (9), 5318–5325. https://doi.org/10.1021/es506123e
- Wiser, R., T. Mai, D. Millstein, G. Barbose, L. Bird, J. Heeter, D. Keyser, V. Krishnan, and J. Macknick, 2017: Assessing the costs and benefits of US renewable portfolio standards. Environmental Research Letters, 12 (9), 094023. https://doi.org/10.1088/1748-9326/aa87bd
- Young, D. and J. Bistline, 2018: The costs and value of renewable portfolio standards in meeting decarbonization goals. Energy Economics, 73, 337–351. https://doi.org/10.1016/j.eneco.2018.04.017
Likelihood
| Virtually Certain | Very Likely | Likely | As Likely as Not | Unlikely | Very Unikely | Exceptionally Unlikely |
|---|---|---|---|---|---|---|
| 99%–100% | 90%–100% | 66%–100% | 33%–66% | 0%–33% | 0%–10% | 0%–1% |
Confidence Level
| Very High | High | Medium | Low |
|---|---|---|---|
|
|
|
|