Douglas Rissing
Wall Street on Wednesday waits with bated breath for one of the most pivotal Federal Reserve monetary policy rate decisions in recent history.
The central bank is widely expected to cut its key policy rate for the first time since the COVID-19 pandemic, after having embarked upon one of its most aggressive tightening campaigns in decades over the last two years.
Seeking Alpha takes a look at how Wall Street's benchmark S&P 500 (SP500) index has performed in the one year after the first rate cut in the last six policy-easing cycles. The overall trend saw the gauge post a positive annual return in four of the six time periods.
See below for a chart summarizing the S&P's (SP500) performance:
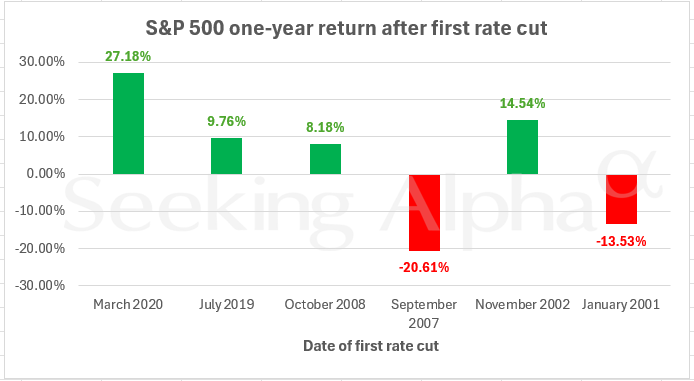
The following is a timeline of the last six cycles:
Emergency COVID Actions
The Fed cut its federal funds rate by 50 basis points to 1%-1.25% on March 3, 2020, in an emergency unscheduled meeting in response to the pandemic.
"The fundamentals of the U.S. economy remain strong. However, the coronavirus poses evolving risks to economic activity," the Fed had said in a brief statement.
The central bank then delivered another unscheduled cut twelve days later.
The S&P 500 (SP500) advanced a whopping 27.18% in the year from March 3, 2020, to March 3, 2021.
"Mid-cycle Adjustment"
The Fed cut its federal funds rate by 25 basis points to 2%-2.25% on July 31, 2019.
"This action supports the Committee’s view that sustained expansion of economic activity, strong labor market conditions, and inflation near the Committee’s symmetric 2 percent objective are the most likely outcomes, but uncertainties about this outlook remain," the Fed had said in a statement.
The central bank delivered two more rate cuts on September 18, 2019, and October 30, 2019, in what Fed chief Jerome Powell called a "mid-cycle adjustment."
The S&P 500 (SP500) climbed 9.76% in the year from July 31, 2019, to July 31, 2020.
The Great Recession
In an unprecedented move at that time, major global central banks including the Fed moved together to reduce interest rates to stimulate a flagging world economy.
The Fed in an unscheduled meeting cut its federal funds rate by 50 basis points to 1.5% on October 8, 2008.
"Throughout the current financial crisis, central banks have engaged in continuous close consultation and have cooperated in unprecedented joint actions such as the provision of liquidity to reduce strains in financial markets," the Fed had said in a joint statement with the Bank of Canada, the Bank of England, the European Central Bank, Sveriges Riksbank, and the Swiss National Bank.
The Fed delivered two more rate cuts on October 29, 2008, and December 16, 2008.
The S&P 500 (SP500) added 8.18% in the year from October 8, 2008, to October 8, 2009.
Housing Market Collapse
The Fed cut its federal funds rate by 50 basis points to 4.75% on September 18, 2007, in response to the infamous U.S. housing bubble and the effects of its collapse on the economy.
"Economic growth was moderate during the first half of the year, but the tightening of credit conditions has the potential to intensify the housing correction and to restrain economic growth more generally. Today’s action is intended to help forestall some of the adverse effects on the broader economy that might otherwise arise from the disruptions in financial markets and to promote moderate growth over time," the Fed had said in a statement.
The Fed continued to cut rates until April 2008.
The S&P 500 (SP500) crashed 20.61% in the year from September 18, 2007, to September 18, 2008.
Sputtering Economy
The Fed cut its federal funds rate by 50 basis points to 1.25% on November 6, 2002.
"Incoming economic data have tended to confirm that greater uncertainty, in part attributable to heightened geopolitical risks, is currently inhibiting spending, production, and employment. Inflation and inflation expectations remain well contained. In these circumstances, the Committee believes that today's additional monetary easing should prove helpful as the economy works its way through this current soft spot," the Fed had said in a statement.
The central bank delivered another rate cut in June 2003.
The S&P 500 (SP500) rose 14.54% in the year from November 6, 2002, to November 6, 2003.
Dot-com Crash, 9/11
The Fed cut its federal funds rate by 50 basis points to 6% on January 3, 2001.
"These actions were taken in light of further weakening of sales and production, and in the context of lower consumer confidence, tight conditions in some segments of financial markets, and high energy prices sapping household and business purchasing power. Moreover, inflation pressures remain contained. Nonetheless, to date there is little evidence to suggest that longer-term advances in technology and associated gains in productivity are abating," the Fed had said in a statement.
The central bank kept reducing rates through the rest of the year, as the economy sputtered in the aftermath of the internet boom that began in the late-1990s and its subsequent blowup that peaked in 2000.
Later in the year, the central bank also had to deal with the fallout of the 9/11 terrorist attacks on the economy.
The S&P 500 (SP500) shed 13.53% in the year from January 3, 2001, to January 3, 2002.
For investors looking to track Wall Street's three major averages - the benchmark S&P 500 (SP500), the tech-heavy Nasdaq Composite (COMP:IND) and the blue-chip Dow (DJI) - here are some exchange-traded funds of interest: (VOO), (IVV), (RSP), (SSO), (UPRO), (SH), (SDS), (SPXU), (QQQ), (QLD), (TQQQ), (QID), (SQQQ), (DIA), (DDM), (UDOW), (DOG), (DXD), and (SDOW).
Seeking Alpha editor Niloofer Shaikh contributed to this story
More on the markets
- The Implications For Markets As Fed Rate Decision Looms
- This Bull Market Is Gaining Strength
- Atlanta Fed GDP Tracker Revised To 3.0% Growth In Q3; Focus On Fed's Rate Cut Move Today
- Nasdaq, S&P, Dow trade cautiously with rate cuts on the horizon
- UBS highlights 30 stocks poised for potential moves after the Fed’s expected rate cut