adventtr
Gold and silver have been rallying lately. Gold has even hit all-time highs, while silver is still well below its all-time highs.
However, with investor excitement focused on NVIDIA and artificial intelligence, the performance of these "barbarous relics" is off the radar screen of most investors.
I hope to change that with this article, in which I will attempt to present the case that gold and silver are likely in the early stages of a long-term secular bull market. I will discuss why this is happening and the signs that support it to help investors profit from this emerging trend.
But before I present the fundamental and technical case for a long-term precious metals bull market, I want to explain what makes gold and silver such unique assets in the investment world.
Gold And Silver Have A Long History As Money
In ancient times, people traded with others by barter, exchanging one unique good or service for another. But as time went on and economies became more complex, people learned they could sell goods or services for certain widely used commodities and then use those commodities to buy other goods and services. By doing this, these widely used commodities became "money".
Over time, gold and silver became the most widely used forms of money, since they are highly valued for their beauty and durability. They are also easily divisible and portable. Most importantly, they are scarce, and their supply is relatively fixed, since it is very expensive to find gold and silver and dig it out of the ground. Gold and silver coins have been used as money in most civilizations for over 2000 years.
Government Money Creation Causes Inflation And Boom-Bust Cycle
Governments initially funded their spending solely via taxation. But since most people do not like having their hard-earned money taken from them against their will, governments looked for other ways to finance their spending on wars and other activities. They soon discovered they could also fund their spending by creating money out of thin air.
Roman emperors and other ancient rulers were notorious for reducing the amount of gold and silver in coins so they could spend more freely. Over time, governments created paper money that was backed by gold and silver. This included the British pound sterling and the US dollar, which used to be exchangeable into specific weights of gold or silver.
Over time, governments removed the metal backing of their money. For example, the US made it illegal for individuals to own gold in the 1930s and then in 1971 President Nixon severed all ties between gold and the US dollar. Now all money is government fiat paper (and digital) money that can be created out of thin air at the whims of politicians and unelected bureaucrats.
Who wouldn't want the legal right to create money out of thin air? No need to worry about the hassles of working, saving and investing! Since the temptation to create new money for more spending is irresistible to virtually everyone, particularly for politicians trying to get re-elected, it is not surprising that we see large increases in the money supply over time.
What are the economic hazards of governments creating new money out of thin air? There are two key problems. First, due to the law of supply and demand, a higher supply of money results in price inflation and a higher cost of living. Second, it causes the recurring boom-bust business cycle, as I discussed in this Seeking Alpha article.
Gold Maintains Its Value Over Time
The supply of gold typically increases about 1% to 2% annually. Thus, in a productive free market economy under a gold monetary system, prices would typically remain flat or fall modestly each year, as gold supply growth would typically be outpaced by real production growth of one to three percent.
US prices fell -0.2% annually from 1800 to 1913, before the Federal Reserve was created. Then from 1913 to 2023, US prices rose 3.2% annually. As a result of this inflation, the value of the US dollar has fallen 97% since 1913. Since Nixon severed the dollar's link to gold in 1971, the value of the dollar has fallen 87%.
Unlike the US dollar, gold has maintained its value over long periods of time. This is shown in the chart below of the purchasing power of gold, the nominal gold price index and the wholesale price index in the United Kingdom for the 515-year period from 1500 to 2015.
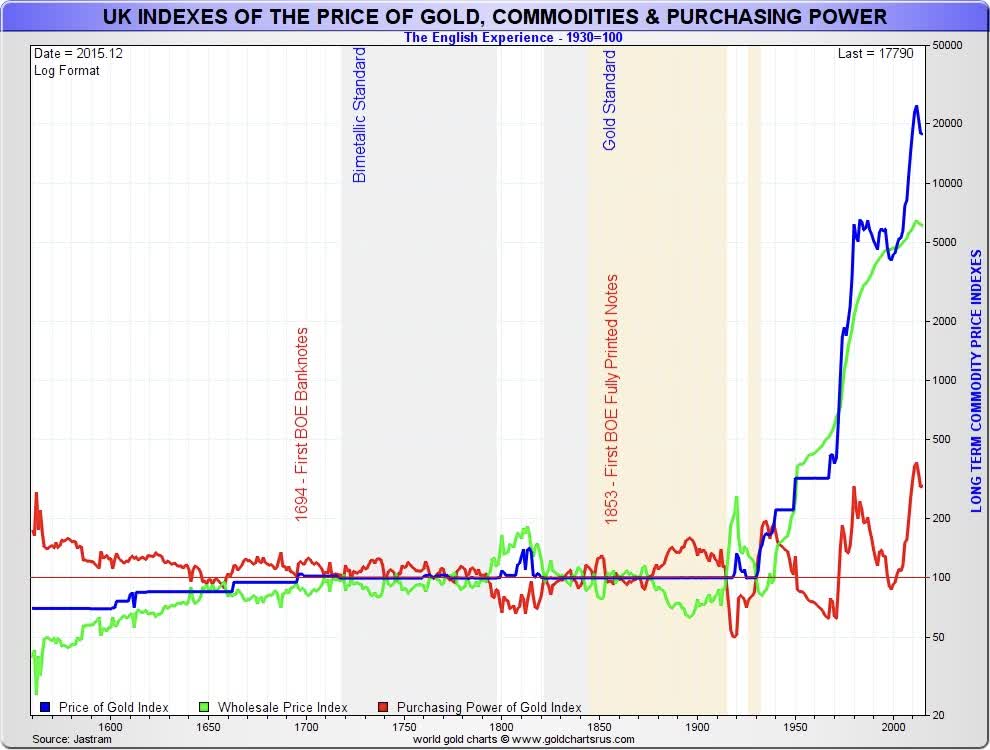
goldchartus.com
It is because of their long history of being used as money and maintaining their purchasing power that gold and silver are such unique assets in the investment world.
Gold Bull And Bear Market Cycles
Over the past century, there have been three major long-term stock bear market periods: 1) the Great Depression of the 1930s, 2) the "stagflationary" 1970s and 3) the tech and housing busts of the 2000s. The chart below shows these long-term secular stock bear market periods (red rectangles), when stock were flat to down for a decade or more.
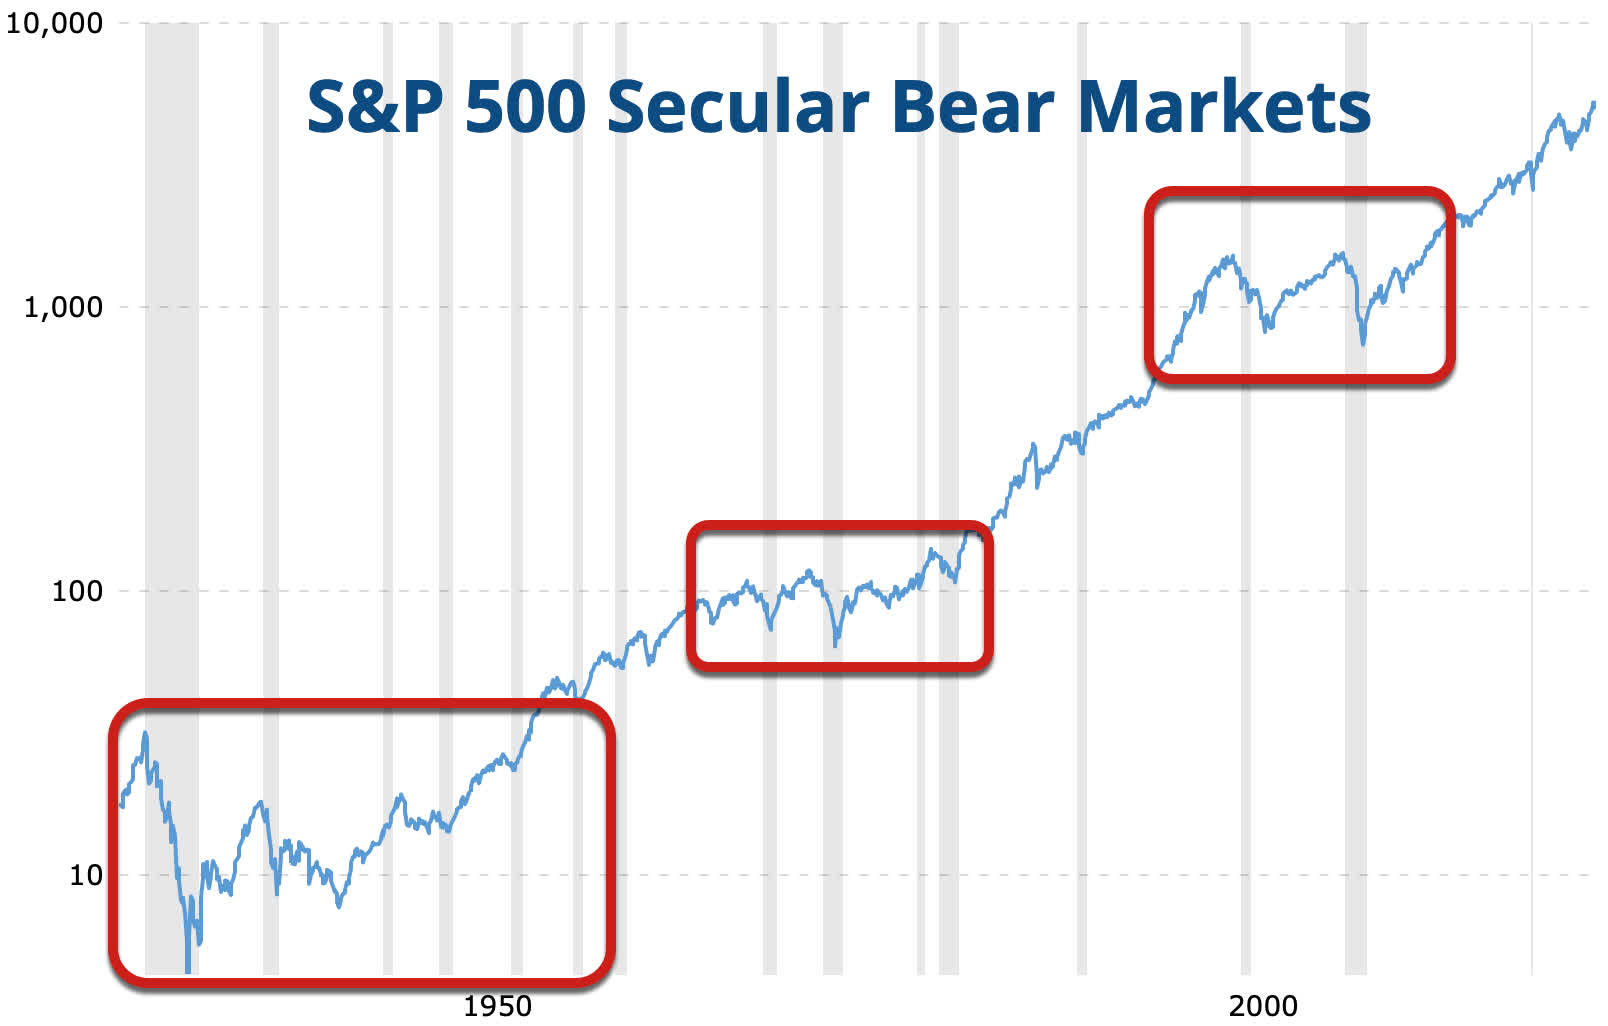
Macrotrends | The Long Term Perspective on Markets
Gold outperformed stocks significantly during those secular stock bear markets. The chart below shows the price of the S&P 500 relative to gold (not including S&P 500 dividends) since the late 1920s. This shows the long periods of time when the price of the S&P 500 underperformed that of gold (red rectangles).
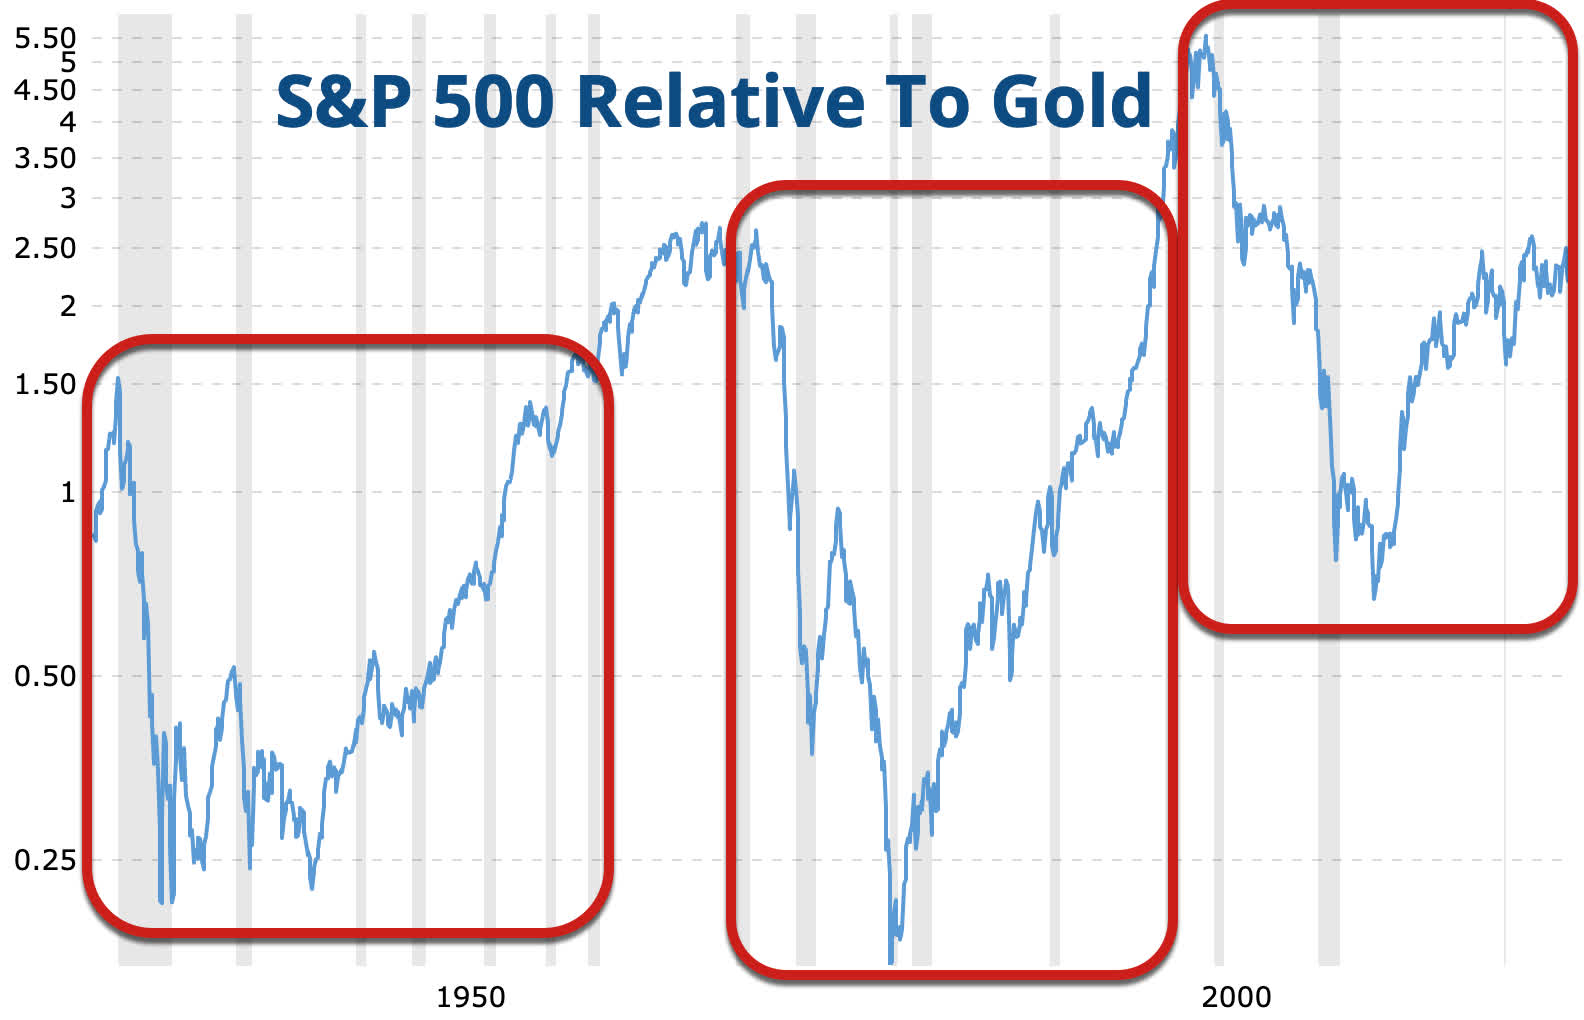
Macrotrends | The Long Term Perspective on Markets
Valuation Drives Alternating Stock And Precious Metals Bull Markets
While there are many fundamental and psychological reasons for these stock versus gold cycles, I believe one of the simplest and most important reasons is the valuation of the S&P 500 (and gold) at the beginning of these secular stock bear market and gold bull market periods.
The chart below from economist and fund manager John Hussman shows the stock market valuation metric that most accurately predicts long-term (10-12 year) future stock market returns: "nonfinancial market capitalization / nonfinancial corporate gross-value added including estimated foreign revenues". This is similar to Warren Buffett's favorite stock market valuation metric: "total stock market capitalization / GDP".
All of the long-term secular bear markets for stocks -- and long-term secular bull markets for gold - started when stock market valuations were at historically high levels (red circles).
Since stocks are currently trading near all-time high valuation levels - seen only at the stock market peaks in 1920, 2000 and 2021 - it is highly likely that a secular bear market period for stocks and a secular bull market period for gold is on the horizon.
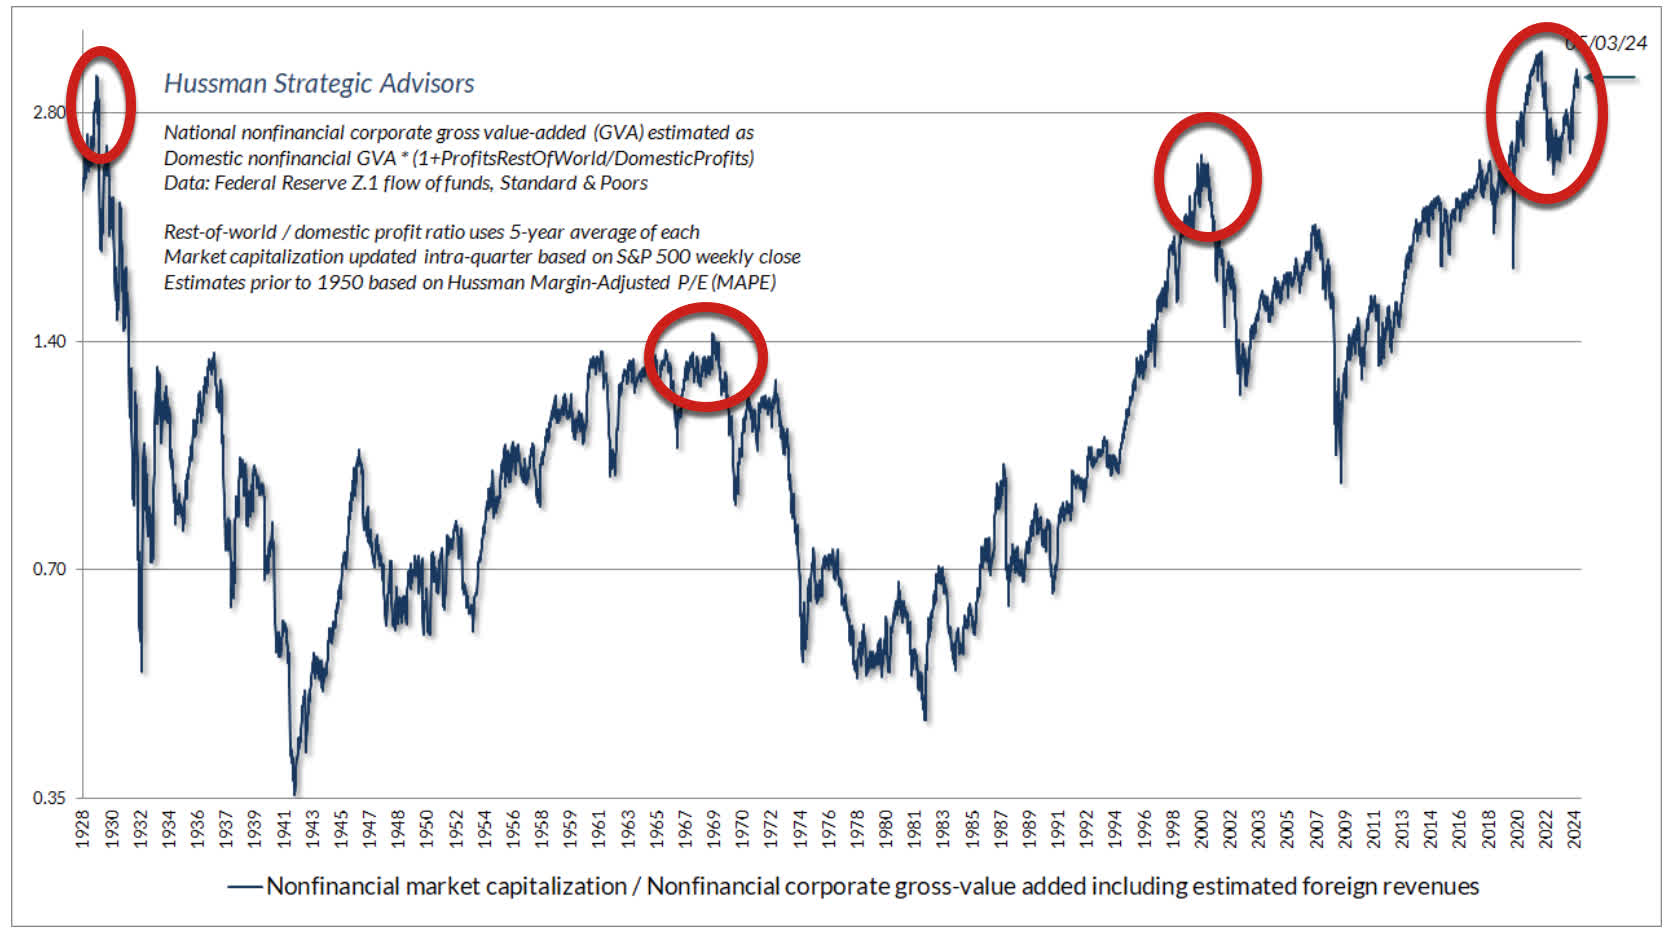
Hussman Strategic Advisors
Psychology And Fundamentals Drives Alternating Stock And Precious Metals Bull Markets
In addition to valuation (although related, since everything is intertwined in financial markets), the mass psychology and herding behavior of investors is a key driver of the alternating stocks versus gold bull market cycles.
While this cannot be easily quantified, I believe these alternating cycles are largely due to the waxing and waning of investor confidence and uncertainty.
During periods of high investor confidence and low uncertainty, investors tend to be optimistic about the future and aggressively buy stocks to profit from their visions of a better future. Such periods include the decades of the 1920s, 1950s, 1960s, 1980s, 1990s and 2010s.
By contrast, during periods of low investor confidence and high uncertainty, investors tend to be pessimistic about the future and aggressively sell stocks and buy gold to achieve greater perceived comfort and safety. Such periods include the decades of the 1930s, 1940s, 1970s and 2000s.
Here are some of the key fundamental factors resulting in greater investor uncertainty in the decades when investors shifted from stocks to gold:
1930s:
- Unprecedented government economic interventions and shift away from free market policies by both the Hoover and FDR administrations
- Unprecedented bank failures
- Unprecedented price deflation
- Unprecedented unemployment
1940s:
- Pearl Harbor
- World War II
- Wage and price controls
- Nuclear bombs dropped on Japan
1970s:
- President Nixon severing ties of US dollar to gold for the first time in history in 1971
- Unprecedented price inflation
- Unprecedented inflationary recessions ("stagflation")
- Wage and price controls
- Watergate
- Vietnam War
- Iranian hostage situation
- Unprecedented Fed interest rate hikes
2000s:
- Tech bust
- 9/11 attacks on World Trade Center and Pentagon
- "Wars on terror" in Iraq, Afghanistan, etc.
- Significant Fed interest rate manipulation resulting in housing bubble and bust
- Great Recession, the worst economic downturn since the Great Depression of the 1930s
This chart shows how gold significantly outperformed the S&P 500 (top clip) during the 2000s secular stock bear market (bottom clip).
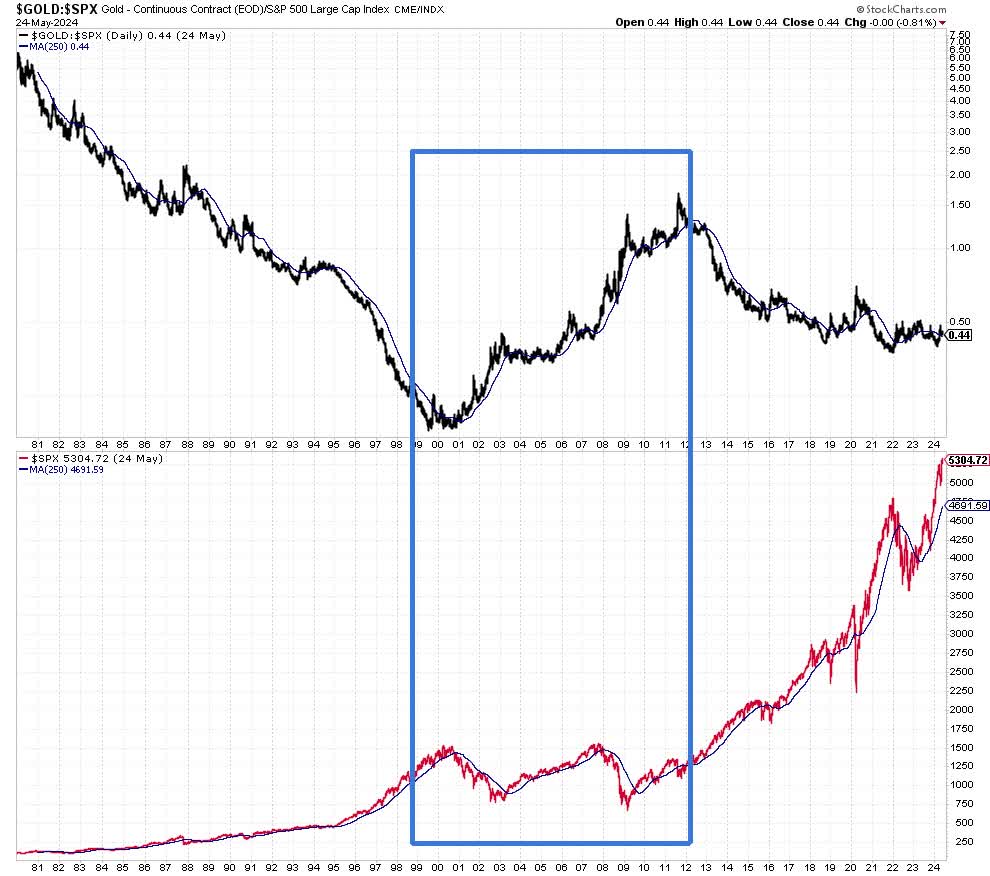
StockCharts.com
Here are some key fundamental factors behind rising investor uncertainty now, which may encourage investors to shift from stocks to gold:
- Unprecedented government policies in response to a virus in recent years
- Federal Reserve's unprecedented 40% increase in the money supply in 2020
- Highest inflation in four decades
- Highly unpredictable Fed policy and uncertain Fed commitment to lowering inflation
- Unprecedented US government spending, debt levels and interest expense, leading to increasing risk of a government bond and fiscal crisis and threats to Social Security, Medicare and other entitlements
- Unprecedented threats to US dollar reserve status from BRICS countries, cryptocurrencies and central bank digital currencies (CBDCs)
- Major wars in Russia and the Middle East that have the potential to broaden and involve nuclear weapons
- Increasing political division and widespread lack of confidence in political leaders
Note that while many investors believe gold is driven primarily by the Fed creating money out of thin air and the price level rising, this does not always happen. For example, gold prices fell 70% from their peak in 1980 to their low in 2001, despite significant Fed money creation and rising prices during that time. Gold also fell about 45% from 2011 to 2015 despite the Fed's aggressive "Quantitative Easing" money creation then.
Again, I believe investor uncertainty is the bigger driver of gold and silver prices, which Federal Reserve policy can play a major role in causing, as it appears to be doing now.
Gold And Bitcoin Behave Very Differently
Bitcoin is considered by cryptocurrency enthusiasts as a new and improved version of gold. Many call it "gold 2.0". I am also hopeful that Bitcoin can help lead to a stronger monetary system that avoids the hazards of government fiat currencies, particularly inflation and the boom-bust business cycle. And Bitcoin has significantly outperformed gold, stocks and virtually all other investment options in its brief 15 year history.
But so far, Bitcoin has proven to be highly correlated to stocks, as I discussed in this Seeking Alpha article. Historically, when stocks have sold off, Bitcoin has typically sold off even more. Thus, unless something changes, Bitcoin is likely to continue to join stocks in bear markets downturns, as it did in 2022. Since gold often moves opposite of stocks, it is not surprising to see gold outperforming Bitcoin (top clip) during stock market selloffs (S&P 500 in bottom clip), as highlighted in the chart below (blue rectangles).

StockCharts.com
Technical Signs Supporting Long-Term Gold And Silver Bull Market
Silver typically outperforms gold in the early stages of a strong gold bull market. That is happening now, which suggests this precious metals bull market has long-term potential. The chart below shows a) silver has broken above its long-term 250-day moving average and multi-year resistance levels (top clip) and b) silver relative to gold has broken above its long-term 250-day moving average and a multi-year trend line (bottom clip).
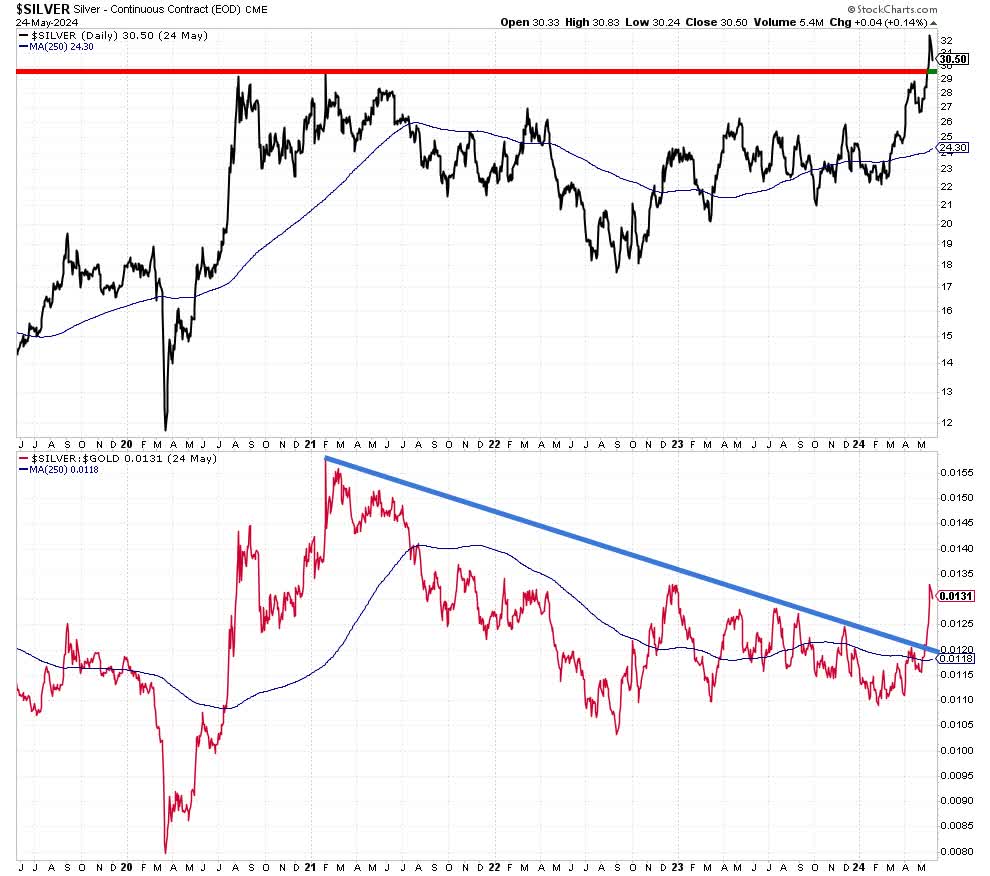
StockCharts.com
Similarly, gold mining stocks typically outperform gold in the early stages of a strong gold bull market. That is also happening now, which is another bullish sign. This chart shows a) the VanEck Gold Miners ETF (GDX) has broken above its long-term 250-day moving average and multi-year trend line (top clip), although it has recently dropped back below that trend line and b) GDX relative to gold has broken above its long-term 250-day moving average and a multi-year trend line (bottom clip).
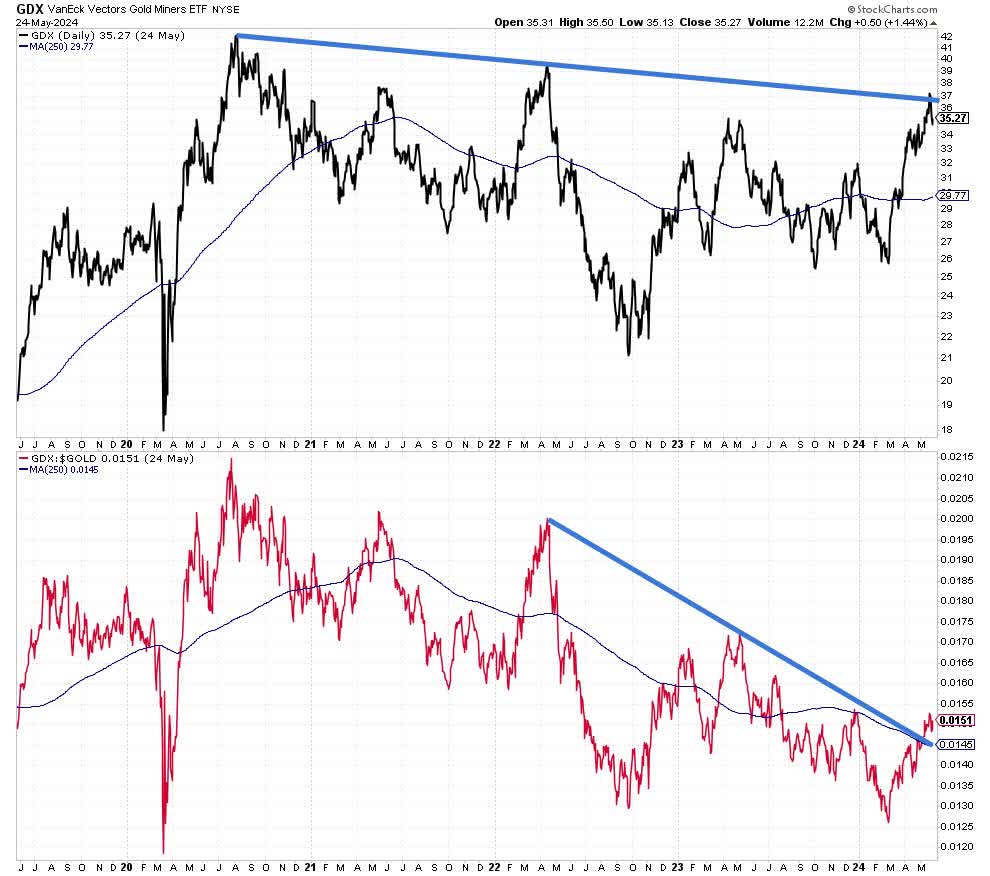
StockCharts.com
Another bullish sign for the sustainability of the current precious metals bull market is the outperformance of silver mining stocks relative to silver. This last chart shows a) the Global X Silver Miners ETF (SIL) has broken above its long-term 250-day moving average and multi-year trend line (top clip) and b) SIL relative to silver has broken above its long-term 250-day moving average and multi-year trend line (bottom clip).
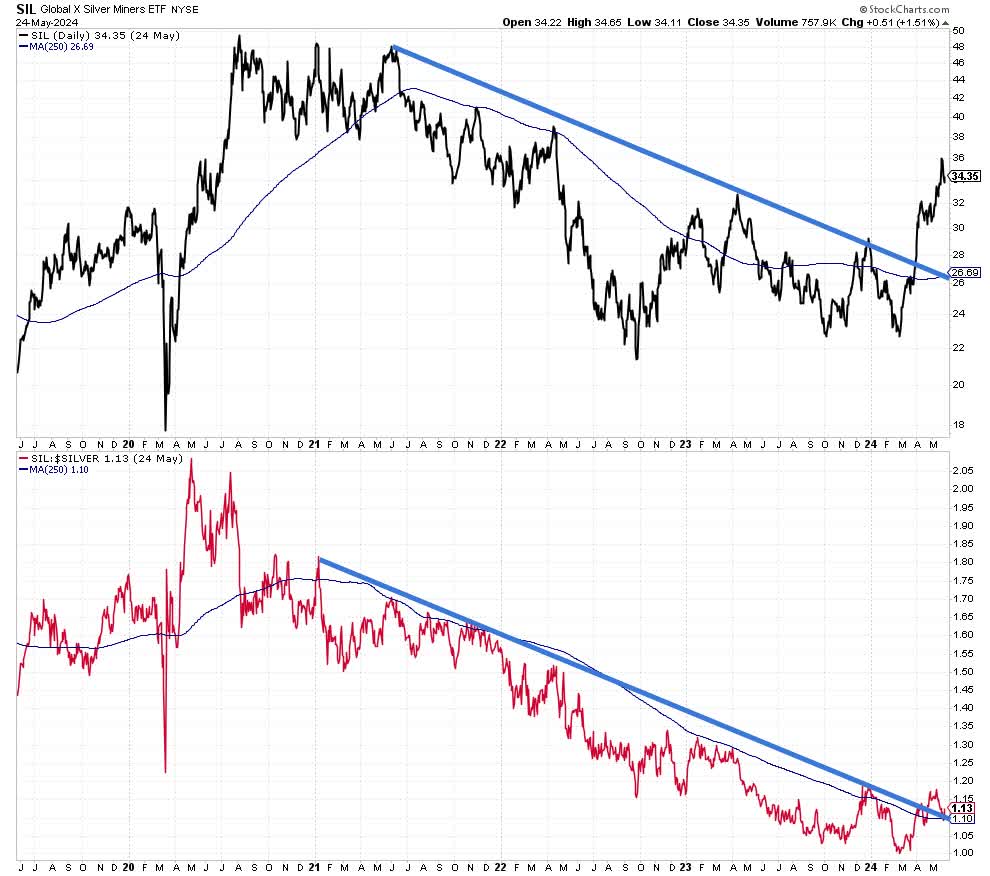
StockCharts.com
Investment Implications
I believe the high valuation levels of US stocks combined with numerous factors causing widespread investor uncertainty has the potential to drive a secular stock bear market and a secular gold and silver bull market in the years to come.
There are many investment vehicles available to investors to profit from this gold and silver bull market, beyond owning physical gold and silver. Popular ETFs are the SPDR Gold Shares ETF (NYSEARCA:GLD) and iShares Silver Trust ETF (NYSEARCA:SLV). For mining stocks, popular ETFs are the VanEck Gold Miners ETF (GDX) and Global X Silver Miners ETF (SIL).
If you agree or disagree with the shiny future ahead that I see for gold and silver, please share your thoughts in the comments. I look forward to reading and learning from them.
