
John Snow, Asiatic Cholera and the inductive-deductive method - republished
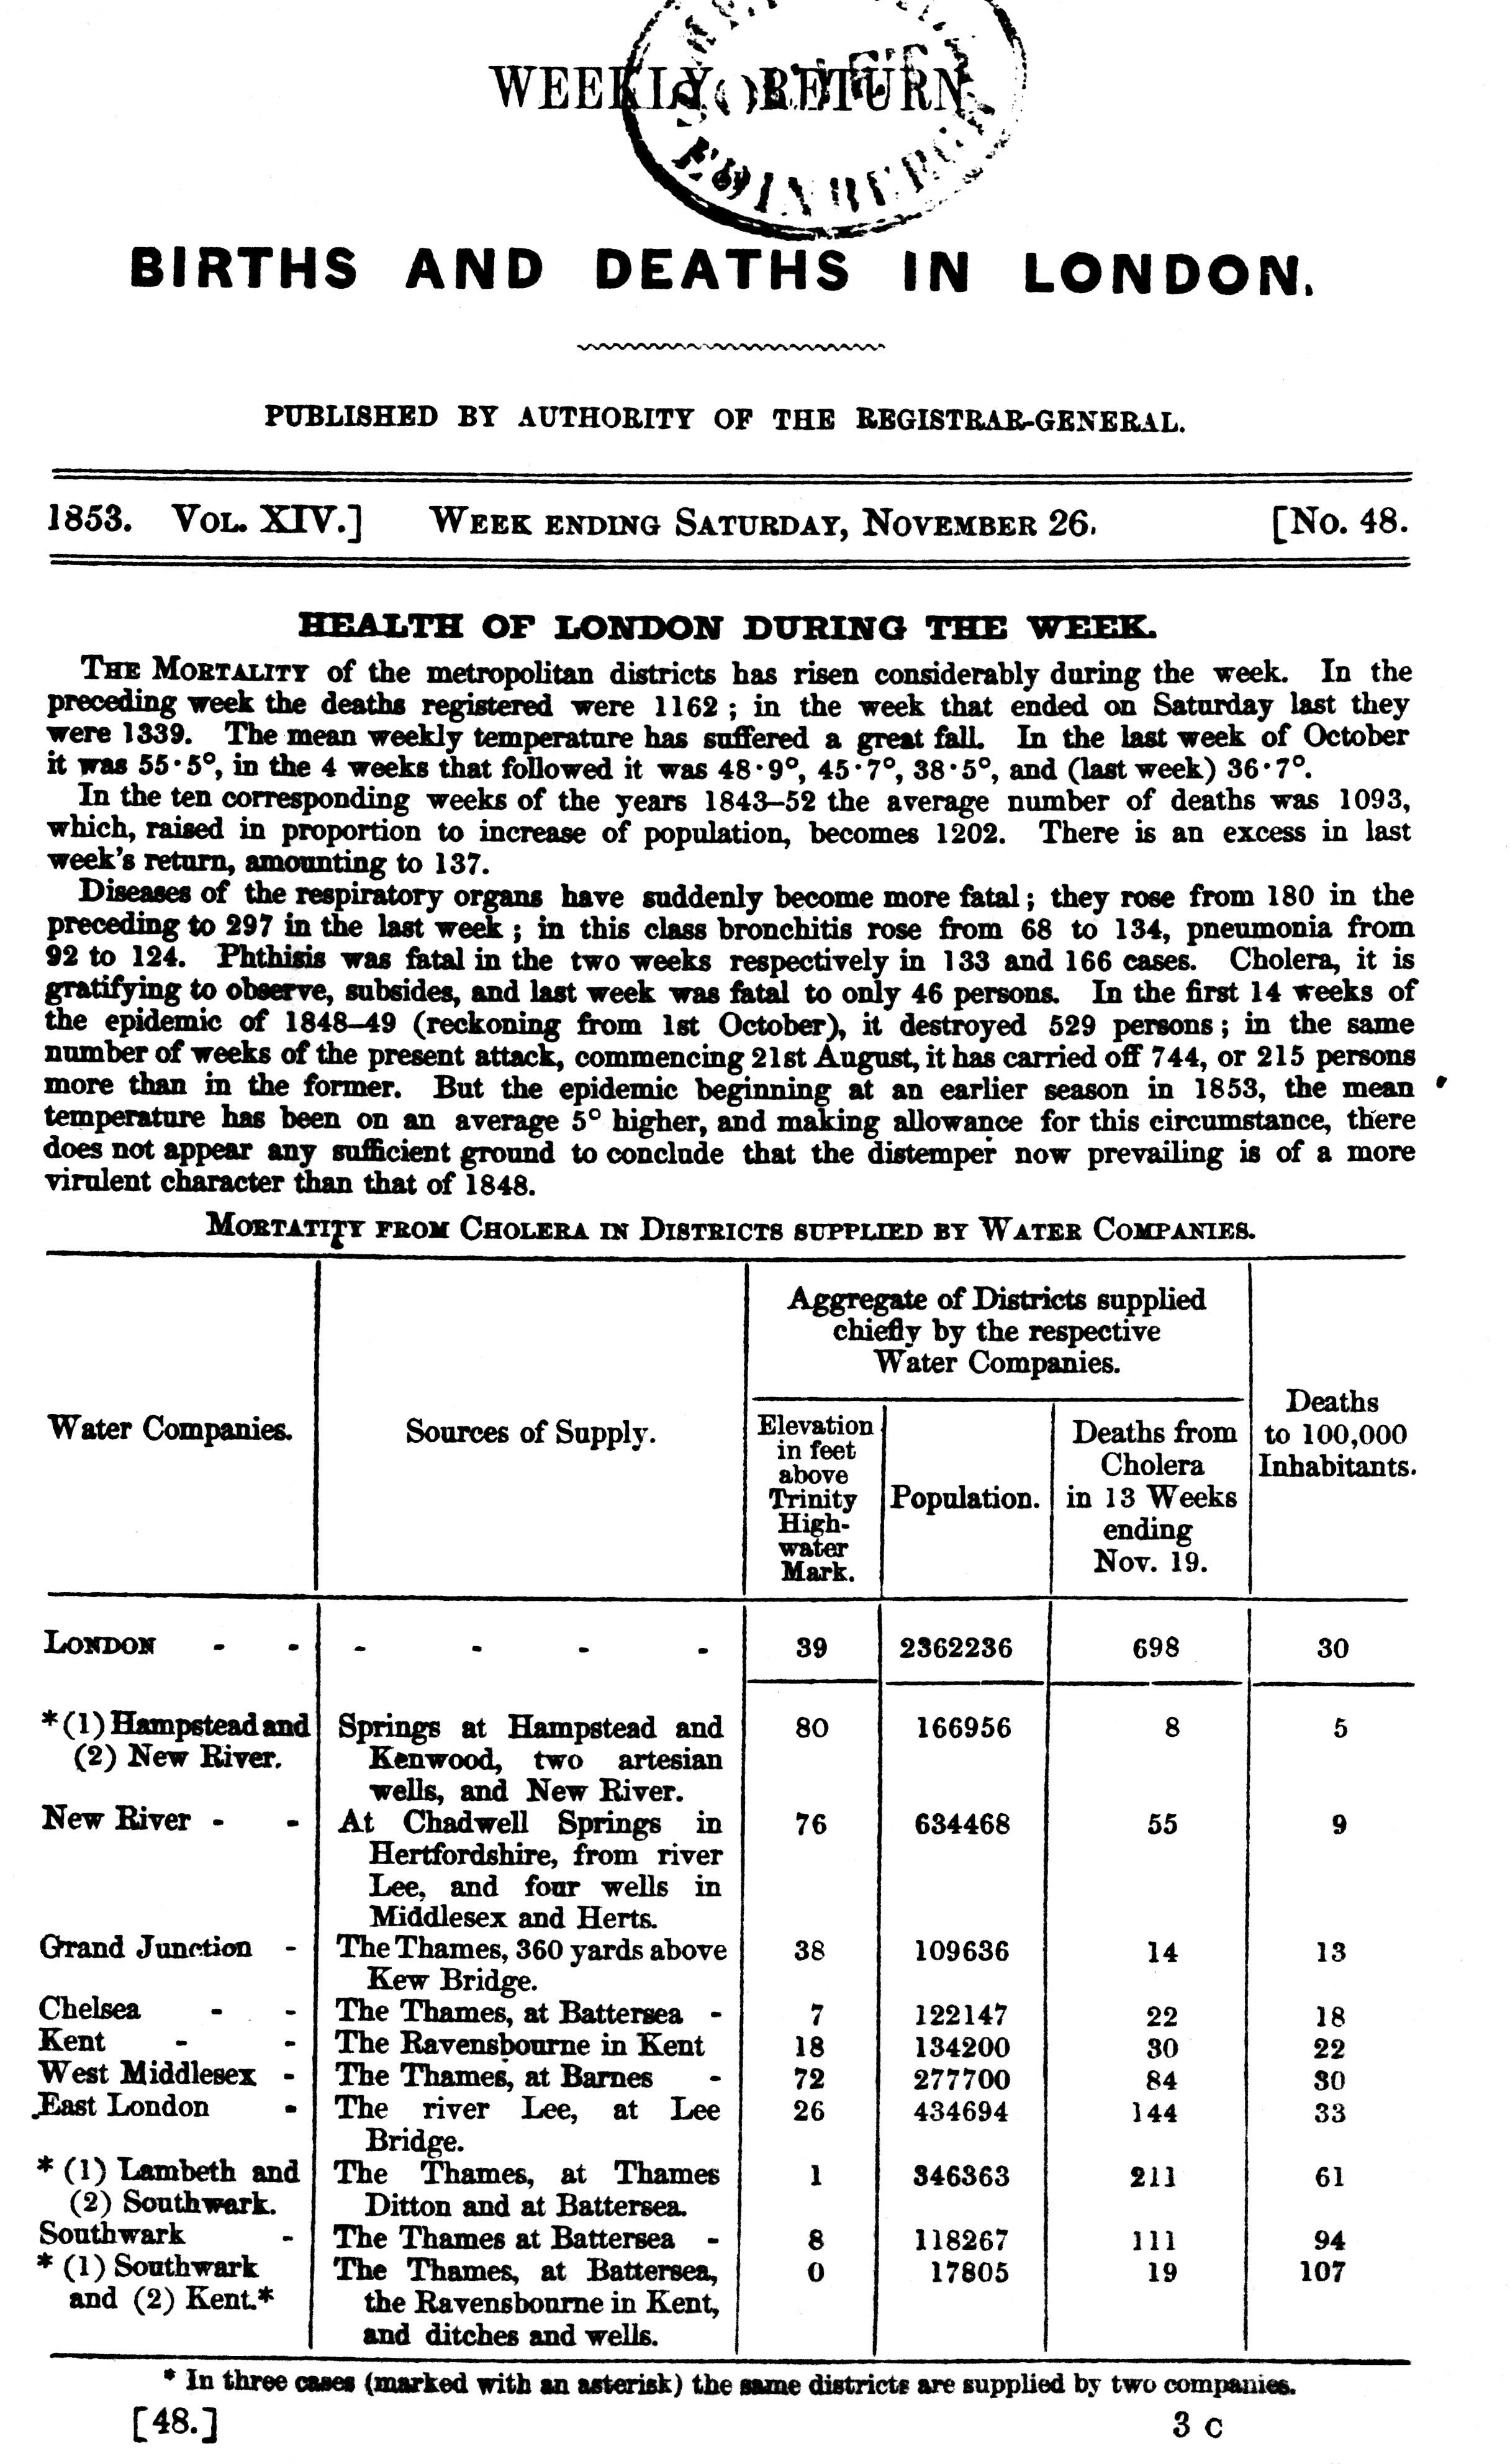
Lecture 7: Changes in the water intake and table of mortality by source
The Snow series is an educational course. We hope you will recognise our efforts by donating to TTE or becoming a paying subscriber, as writing the series took a lot of time and effort.
The possibility of testing his first hypothesis came about with the change of the boundaries and water collection inlets in South London, around the Southwark area, in what Snow called the “great experiment” or sometimes the “natural experiment”.
In the 26 November publication, the Registrar-General reports on the change in temperature and the increase in respiratory fatalities. ‘Cholera, it is gratifying to observe, subsides, and last week was fatal to only 46 persons.
The publication contains the mortality from cholera in districts supplied by water companies.
As reported in his note in the table footer, in 1854, Snow lacked the precise numbers of dwellings or people supplied by each company (the denominator). As we shall see in Lecture 15, at the time, the lack of specific subdistrict data by exposure would significantly impact his peers' reception of the content of On the mode of communication of cholera, 2nd edition, 1855 (MCC2).
Snow persisted on the exposure-outcome theme in the next table based on The “Weekly Return of Births and Deaths”. This is Table IV from MCC2 for 1853. The insistence on the relationship between exposure and outcome is perhaps Snow’s most original contribution to modern epidemiology.
The following table has been extracted and synthesised from On the Mode of Communication of Cholera, 2nd edition, 1855 (MCC2) for 1853. Table IX (page 86).
The data show the marked differential in mortality by the water supplier or inhabitant in 1854, using data from 1853 as denominators.
Snow notes that the alteration made by the Lambeth Company on the progress of cholera was not so evident.
Why was the increase in mortality not so evident?
In 1854, Snow didn't have the subdistrict data to calculate the denominator. Snow could only estimate the population death rates for the different and mixed supply areas when these were made available. Deaths per 100k inhabitants were nearly double in the Southwark & Vauxhall supply dwellings compared to where both companies provided the supply. The absence of a precise denominator by the supplier - which, according to Snow’s theory, signified exposure to different quality water for the mixed sub-districts supplied by both companies meant inflation of the denominator. This, in turn, affected the visible mortality rates (see areas in blue in Snow’s map in the next Lecture - 8)
The marked mortality difference, however, could be attributed to several other causes besides water supply. These include factors such as social class, foul-smelling miasmata, changes in weather variables, types of dwellings, and knowledge of suppliers (so-called ascertainment bias).
CONTEMPORARY THEMES
Snow had his experiment, but governments from 2020 could have had scores of better-controlled and designed ones if science had been on the agenda. Instead, the golden opportunity to test all manner of theories was lost. Are any of our readers aware of any similar natural experiments that could give us answers to transmission riddles?
The covid saga was peppered with hasty decisions and contradictory and ever-changing policies, which means that retrospectively comparing areas with restriction A in place with other areas is almost impossible, even in comparison with Sweden, given the underlying fault lines of unclear case definitions and attribution rules, so clear for cholera and a complete mess in the recent pandemic.
One simple calculation underpins epidemiology: E = N/D. While numerators are often easy to calculate - i.e., the total number of deaths, the population denominator often proves challenging to ascertain. Between the years of the census, we rely on population estimates. Some populations are more difficult to calculate than others; the birth cohort is easy, as they are all registered at birth - we can be reasonably sure the estimate of the number of under 1s is accurate. However, calculating the denominator for an unvaccinated population is practically impossible.
The UK statistics authority makes this point:
“Using the ONS mid-year 2020 estimates as a denominator, the positive case rates for those who are not vaccinated is higher than for those who are vaccinated (in all age groups below 80). While we don’t yet know the true figure for the unvaccinated population, this seemingly simple choice has a huge impact. It is particularly problematic in this circumstance because any error in the total population estimate is applied in its entirety to the unvaccinated population.”
Changes in the population will, over time, significantly impact estimates of disease and death rates. As Snow showed, understanding the impact of the denominator choice is essential to interpreting the data appropriately.
Only when you have an accurate estimate of the rate of death (i.e., you know the numerator and the denominator with some accuracy) can you make comparisons and account for any confounders that might explain any differences.
Subscribe to Trust the Evidence
Informing health decisions by separating evidence from opinion
The fact that "natural experiments" were going to be impossible seemed almost by design. Here's a fairly innocent email I sent to someone after reading a newspaper report (in France) on 3 april, 2020:
"Why is the disease causing more deaths in France than in Germany? It is a very striking difference and it is surely the same disease. I can't think of a reason. The answer I get from people I have asked (including from a senior UK Health Service Administrator) is that "somehow" Germany is better at dealing with disease or that Germans are possibly more compliant with regard to social control. I don't believe the first. There are data on the second in the form of car-use and it shows little difference. France has been generally very compliant. I conclude the data are not comparable across countries. This is extremely bad news."
Thanks again for this lecture!
You write "Snow had his experiment" - yes, but before that, he collected and thus had data!
What if data were wrongly increased or not collected at all because propaganda needs, i.e. Fear Porn, needed to be maintained? Remember how practically every hospital death became 'due to covid', regardless, and how pathologists were told to drop autopsies - something which happened in Germany?
If data are manipulated or plain wrong, conclusions must be wrong in a way which is worse than being just erroneous because data are lacking.