

Smokescreens - Part 3


As we have seen, the 10th revision of the International Classification of Disease (ICD) is used to code events. The series of codes which interest us are the J codes:
ICD Code
J09 Influenza due to certain identified influenza virus
J10 Influenza due to other identified influenza virus
J11 Influenza, virus not identified
J12 Viral pneumonia not elsewhere classified
J13 Pneumonia due to Streptococcus pneumoniae
J14 Pneumonia due to Haemophilus influenzae
J15 Bacterial pneumonia, not elsewhere classified
J16 Pneumonia due to other infectious organisms, not elsewhere classified
J17 Pneumonia in diseases classified elsewhere
J18 Pneumonia, organism unspecified
The first thing to note is that only deaths directly attributed to influenza are the ones with the J09-J11 codes. All the rest are Flu/F word-related.
To be 100% sure that influenza is in the frame, we would have to look at notes examine lab results, and post-mortem results, if they exist. However, let’s assume the J09-J10 codes are accurate, for now.
In February, we reported carrying out a simple calculation for English data. We took the ONS data, which provides separate reporting of the yearly data, and by subtracting data coded J09-J11 for the period 2015-2018 from the J09-J18 “pot”, we got the following totals:


The yearly influenza deaths are minimal. For example, in 2015, there were about 3 deaths per million, rising to roughly 24 per million in 2018.
However, the other viruses, bacteria or agents which are not influenza (e.g. measles, S Pneumonia, M Pneumoniae) or are unknown or not identified are the ones adding far more to the tally than influenza.
How do other European nations fare? A TTE reader, Eugenio Florean, managed to get similar coded data from ISTAT, Italy’s ONS equivalent, in record time (no mean feat). Here are the data for all age groups:

Considering that Italy has just under 59 million inhabitants and England just under 56 million, the figures appear very similar and very low.
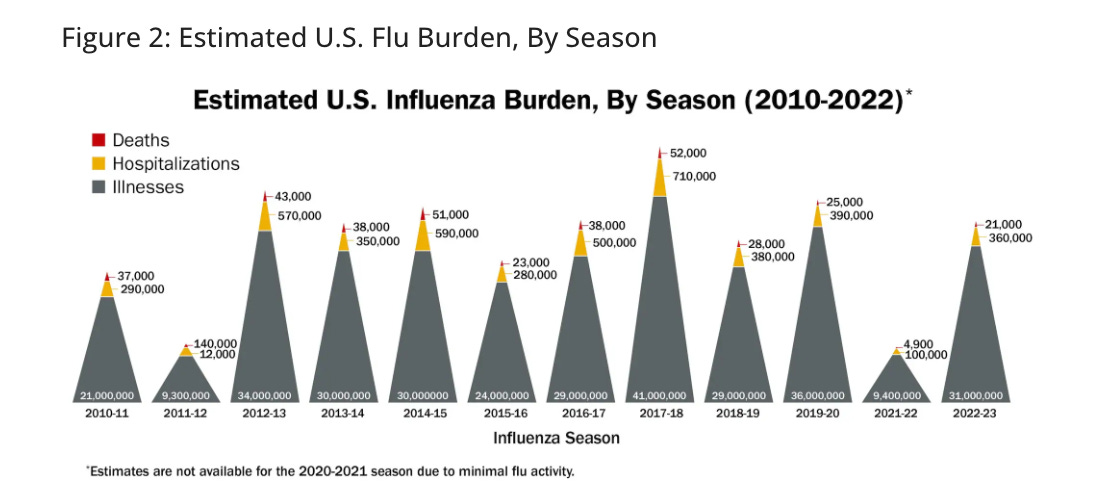
However, the US CDC spews out data for tens of thousands of US influenza deaths.
How is this difference possible? How can it come about?
Part of the answer lies (as always) in the use of models. CDC uses four types:
Rate-difference models
Serfling least squares cyclical regression models,
Serfling–Poisson regression models,
Autoregressive integrated moving average models.
Readers will ask us what all this means. We must confess that we find it difficult to understand, let alone explain.
But the text assured us that the four models give similar results, so all is well in the thousands. The only slight worry is the sentence: “Human subject review was not required for this study as only aggregate national data without personal identifiers were used in analyses”.
I.e. never mind who these folk are or what their circumstances were; we use their anonymised data and add it all up. This is a sign of the presence of a serious syndrome, probably incurable: the big data syndrome.
What about the rest of the EU then? Again, the European CDC counterpart, ECDC, assures readers of the fact sheet for citizens that around 40,000 folk succumb to influenza each year in the EU. Alas, for Germany, we were unable to find the J09-J10 data, but we found a report lumping J00-J99 diseases of the respiratory system with all ages for 2015, including lung cancer with a total of 68,300 - Still mega numbers but at odds with more specific coding.
The rarity of the outcome “influenza death” is one of the explanations for its absence as an outcome in three long-standing Cochrane reviews of influenza vaccines, regardless of study design (yes, observational data were included). This is especially important as most of the studies were prospective with protocols.
So what is going on? As Pontius Pilate said, “what is truth?” or should we correct him to say where is truth?
Reference
Thompson WW et al. (2009), Estimates of US influenza-associated deaths made using four different methods. Influenza and Other Respiratory Viruses, 3: 37-49. https://doi.org/10.1111/j.1750-2659.2009.00073.x


Smokescreens - Part 3
Up to 2020 I did not think much about this and believed what I was told by government agencies. Because of work I did some years ago I was familiar with the ICD9 codes for orthopaedics, which seemed well defined. Your articles confirm what I had come to think after 2020. I will learn a lot from this series.
Great detective work. Incredible that simple coding decisions can have such massive implications for public spending.
A few years ago the nhs created an enhanced service for people with rheumatoid arthritis. In the practice I worked in we realised that someone had been using a rheumatoid diagnosis code for every rheumatoid TEST done so our practice rheumatoid register appeared to be very high. Similar thing for coeliac and wheat intolerance - same code used and some had been invited in for annual coeliac bloods for years.
Wouldn’t be a problem except when people are making strategic decisions based on bad big data( or big bad data?).
Btw John Dee in his substack has done some excellent work on the J coding illusions in his flip flop flu articles (most recent update a few weeks ago). You might be covering the same thing in this series but his flip flop flu graph of J code deaths going back in time is amazing, demonstrating that a coding change in the WHO rule 3 caused a dramatic fall in J code deaths from 1984 to 92 then they changed back to the old way of recording in 1993 and reversed it again in 2001. Basically caused J code deaths to appear to fall dramatically after 2001 as the deaths were coded as something else. The graph is most unnatural. Might make flu vaccines look good though.