Fundamentals of Data Architecture to Help Data Scientists Understand Architectural Diagrams Better
Before pretending you understand the diagram your smart colleague shows to you.

Introduction
Within a company using data to derive business value, although you may not be appreciated with your data science skills all the time, you always are when you manage the data infrastructure well. Everyone wants the data stored in an accessible location, cleaned up well, and updated regularly.
Backed up by these unobtrusive but steady demands, the salary of a data architect is equally high or even higher than that of a data scientist. In fact, based on the salary research conducted by PayScale (https://www.payscale.com/research/US/Country=United_States/Salary) shows the US average salary of Data Architect is $121,816, while that of Data Scientist is $96,089.
Not to say all data scientists should change their job, there would be a lot of benefits for us to learn at least the fundamentals of data architecture. Actually, there is one simple (but meaningful) framework that will help you understand any kinds of real-world data architectures.
Table of Contents
- Three Components in Data Architecture: Data Lake -> Data Warehouse -> Data Mart
- Tools Used in Each Component
- Case Study — Building Scheduled & Automatic Data Feed from BigQuery (Data Warehouse) to Google Sheets (Data Mart)
- Ending Note
Three Components in Data Architecture: Data Lake -> Data Warehouse -> Data Mart
“Data Lake”, “Data Warehouse”, and “Data Mart” are typical components in the architecture of data platform. In this order, data produced in the business is processed and set to create another data implication.

Three components take responsibility for three different functionalities as such:
- Data Lake: holds an original copy of data produced in the business. Data processing from the original should be minimal if any; otherwise in case some data processing turned out to be wrong in the end, it will not be possible to fix the error retrospectively.
- Data Warehouse: holds data processed and structured by a managed data model, reflecting the global (not specific) direction of the final use of the data. In many cases, the data is in tabular format.
- Data Mart: holds a subpart and/or aggregated data set for the use of a particular business function, e.g. specific business unit or specific geographical area. A typical example is when we prepare the summary of KPIs for a specific business line followed by visualization in BI tool. Especially, preparing this kind of separate and independent component after the warehouse is worthwhile when the user wants the data mart regularly and frequently updated. On contrary, this portion can be skipped in cases the user only wants some set of data for ad hoc analysis done only once.

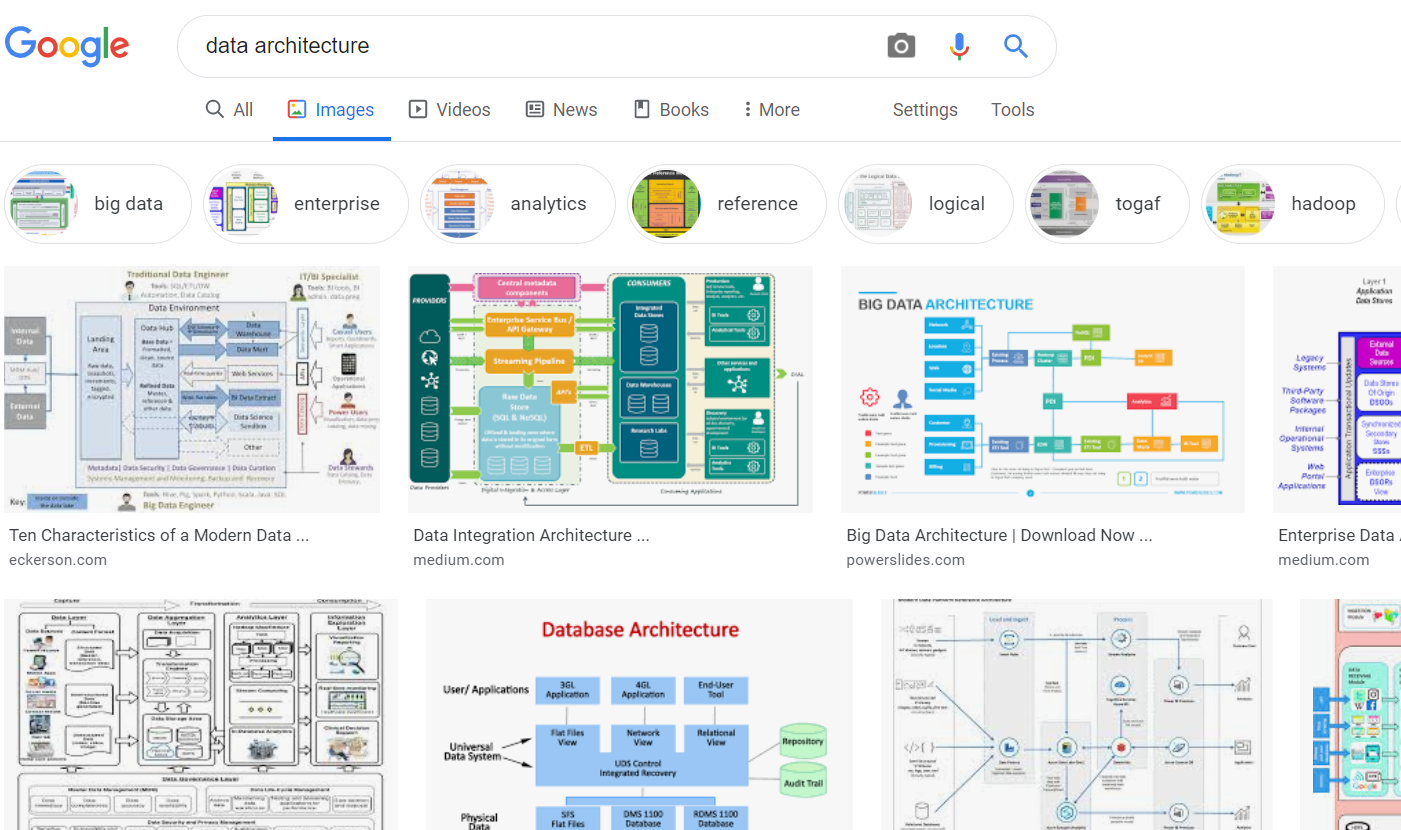
For more real-world examples beyond this bare-bone-only description, enjoy googling “data architecture” to find a lot of data architecture diagrams.
Why do we need to split into these three components?
Because different stages within the process have different requirements.
In the data lake stage, we want the data is close to the original, while the data warehouse is meant to keep the data sets more structured, manageable with a clear maintenance plan, and having clear ownership. In the data warehouse, we also like the database type to be analytic-oriented rather than transaction-oriented. On the other hand, data mart should have easy access to non-tech people who are likely to use the final outputs of data journeys.
Differently-purposed system components tend to have re-design at separate times. Then, configuring the components loosely-connected has the advantage in future maintenance and scale-up.
How do data engineers and data scientists work to these three components?
Roughly speaking, data engineers cover from data extraction produced in business to the data lake and data model building in data warehouse as well as establishing ETL pipeline; while data scientists cover from data extraction out of data warehouse, building data mart, and to lead to further business application and value creation.
Of course, this role assignment between data engineers and data scientists is somewhat ideal and many companies do not hire both just to fit this definition. Actually, their job descriptions tend to overlap.
New trend beyond the three-component approach
Last but not the least, it should be worth noting that this three-component approach is conventional one present for longer than two decades, and new technology arrives all the time. For example, “Data Virtualization” is an idea to allow one-stop data management and manipulation interface against data sources, regardless of their formats and physical locations.
Tools Used in Each Component
Now, we understood the concept of three data platform components. Then, what tools do people use? Based on this “Data Platform Guide” (in Japanese) , here’re some ideas:
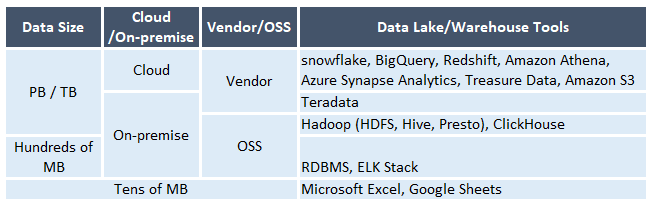
Data lake/warehouse
There are the following options for data lake and data warehouse.
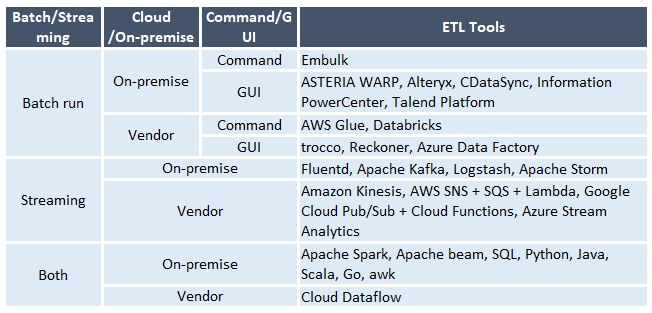
ETL tools
ETL happens where data comes to the data lake and to be processed to fit the data warehouse. Data arrives in real-time, and thus ETL prefers event-driven messaging tools.
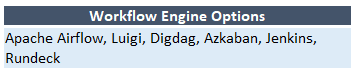
Workflow engine
A workflow engine is used to manage the overall pipelining of the data, for example, visualization of where the process is in progress by a flow chart, triggering automatic retry in case of error, etc.
Data mart/BI tools
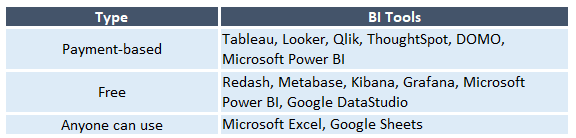
The following tools can be used as data mart and/or BI solutions. The choice will be dependent on the business context, what tools your company is familiar with (e.g. are you Tableau person or Power BI person?), the size of aggregated data (e.g. if the data size is small, why doesn’t the basic solution like Excel or Google Sheets meet the goal?), what data warehouse solution do you use (e.g. if your data warehouse is on BigQuery, Google DataStudio can be an easy solution because it has natural linkage within the Google circle), and etc.
Case Study — Building Scheduled & Automatic Data Feed from BigQuery (Data Warehouse) to Google Sheets (Data Mart)
When the data size stays around or less than tens of megabytes and there is no dependency on other large data set, it is fine to stick to spreadsheet-based tools to store, process, and visualize the data because it is less-costly and everyone can use it.
Once the data gets larger and starts having data dependency with other data tables, it is beneficial to start from cloud storage as a one-stop data warehouse. (When the data gets even larger to dozens of terabytes, it can make sense to use on-premise solutions for cost-efficiency and manageability.)
In this chapter, I will demonstrate a case when the data is stored in Google BigQuery as a data warehouse. BigQuery data is processed and stored in real-time or in a short frequency. The end-user still wants to see daily KPIs on a spreadsheet on a highly aggregated basis. This means data mart can be small and fits even the spreadsheet solution. Instead of Excel, let’s use Google Sheets here because it can be in the same environment as the data source in BigQuery. Oh, by the way, do not think about running the query manually every day. Try to find a solution to make everything running automatically without any action from your side.

Data to be used in this case study
In this case study, I am going to use a sample table data which has records of NY taxi passengers per ride, including the following data fields:
- Car ID
- Driver ID
- Date of ride
- Number of passengers
- Amount of fare
- etc.
The sample data is stored in the BigQuery as a data warehouse.
Can Google Sheets pull data from BigQuery tables?
Technically yes, but at the moment this is only available through Connected Sheets and you need an account of G Suite Enterprise, Enterprise for Education, or G Suite Enterprise Essentials account.
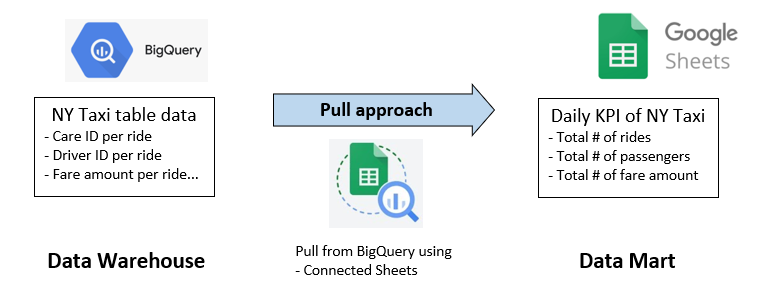
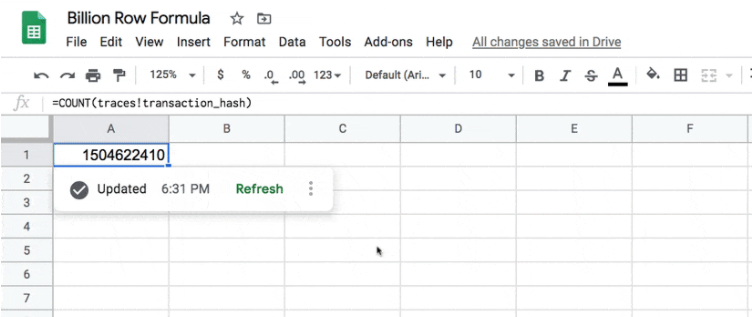
Connected Sheets allows the user to manipulate BigQuery table data almost as if they play it on spreadsheet. See the GIF demonstration in this page on “BenCollins” blog post.
Connected Sheets also allows automatic scheduling and refresh of the sheets, which is a natural demand as a data mart.
Although it demonstrates itself as a great option, one possible issue is that owing G Suite account is not very common.
For more details about the setups, see this blog post from “BenCollins”.
What can we do to push data from BigQuery to Google Sheets?
To extract data from BigQuery and push it to Google Sheets, BigQuery alone is not enough, and we need a help of server functionality to call the API to post a query to BigQuery, receive the data, and pass it to Google Sheets.
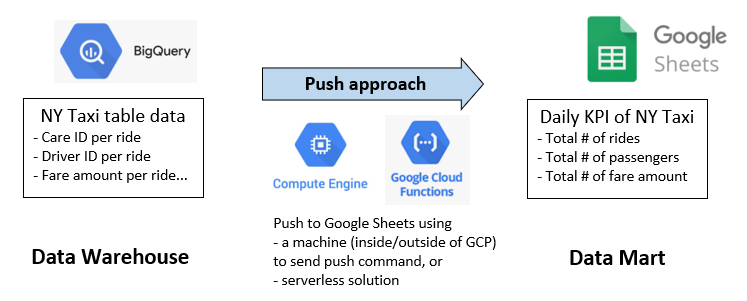
The server functionality can be on a server machine, external or internal of GCP (e.g. ‘Compute Engine’ instance on GCP; or ‘EC2’ instance on AWS). The code run can be scheduled using unix-cron job. But one downside here is that it takes maintenance work and cost on the instance and is too much for a small program to run.
‘Google Cloud Functions’ is a so-called “serverless” solution to run code without the launch of a server machine. Putting code in Cloud Functions and setting a trigger event (e.g. scheduled timing in this case study, but also can be HTML request from some internet users), GCP automatically manages the run of the code.
Set-ups in my case study
There are two steps in the configuration of my case study using NY taxi data.
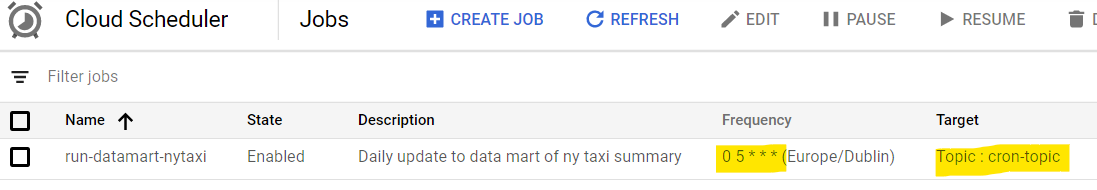
Step 1: Set up scheduling — set Cloud Scheduler and Pub/Sub to trigger a Cloud Function.
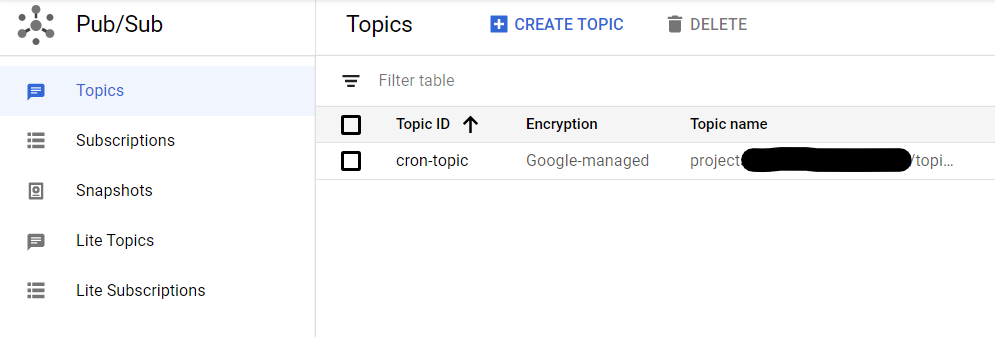
Here, “Pub/Sub” is a messaging service to be subscribed by Cloud Functions and to trigger its run every day at a certain time. “Cloud Scheduler” is functionality to kick off something with user-defined frequency based on unix-cron format. Combining these two, we can create regular messages to be subscribed by Cloud Function. See this official instruction on how to do it. Here are screenshots from my GCP set-up.

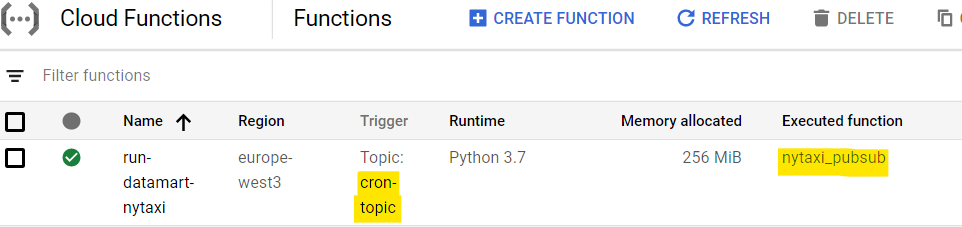
Step 2: Set up code — prepare code on Cloud Functions to query BigQuery table and push it to Google Sheets.
The next step is to set up Cloud Functions. In Cloud Functions, you define 1) what is the trigger (in this case study, “cron-topic” sent from Pub/Sub, linked to Cloud Scheduler which pulls the trigger every 6 am in the morning) and 2) the code you want to run when the trigger is detected.
See this official instruction for further details, and here are screenshots from my set-up.

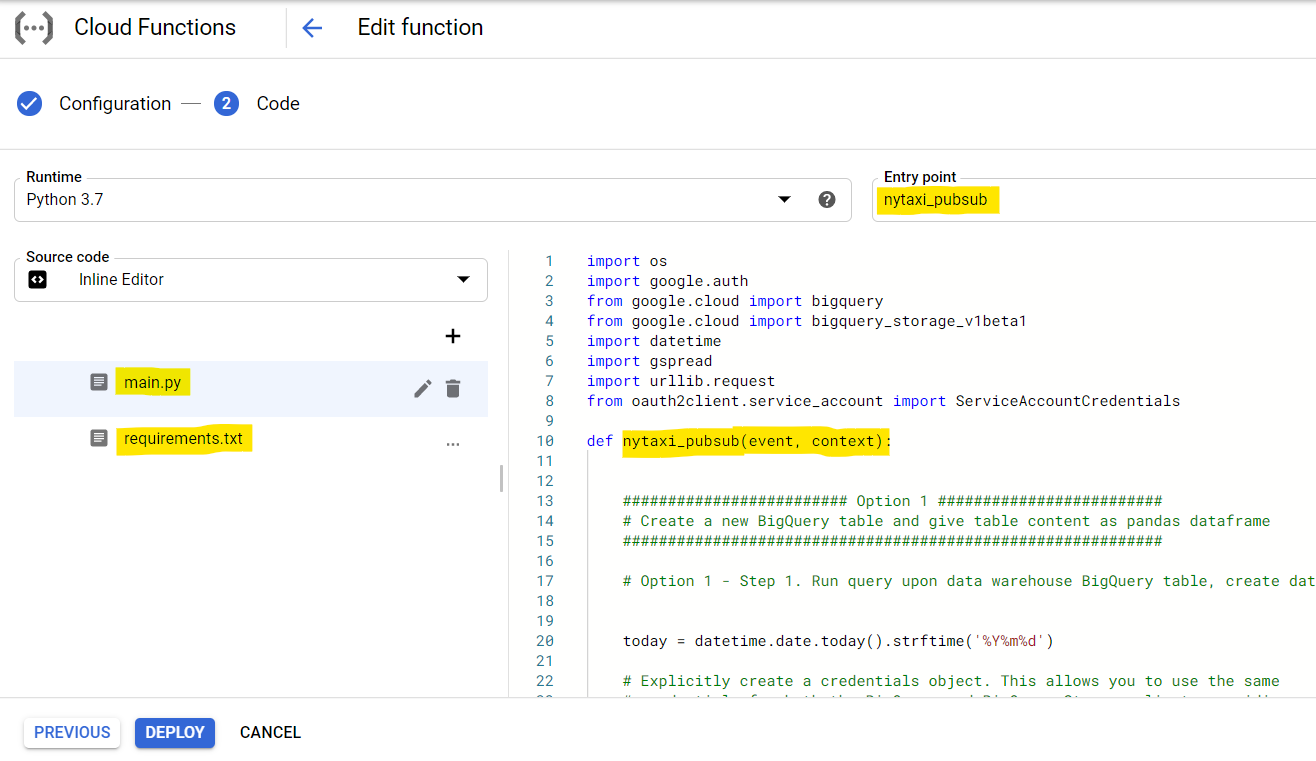
The code to run has to be enclosed in a function named whatever you like (“nytaxi_pubsub” in my case.) The code content consists of two parts: part 1 to run a query on BigQuery to reduce the original BigQuery table to KPIs and save it as another data table in BigQuery, as well as make it a Pandas data frame, and part 2 to push the data frame to Sheets.
Here’re the codes I actually used. Importantly, the authentication to BigQuery is automatic as long as it resides within the same GCP project as Cloud Function (see this page for explanation.) Yet, this is not the case about the Google Sheets, which needs at least a procedure to share the target sheet through Service Account. See the description in gspread library for more details.
Final data mart on Google Sheets
Finally, I got the aggregated data in Google Sheets like this:
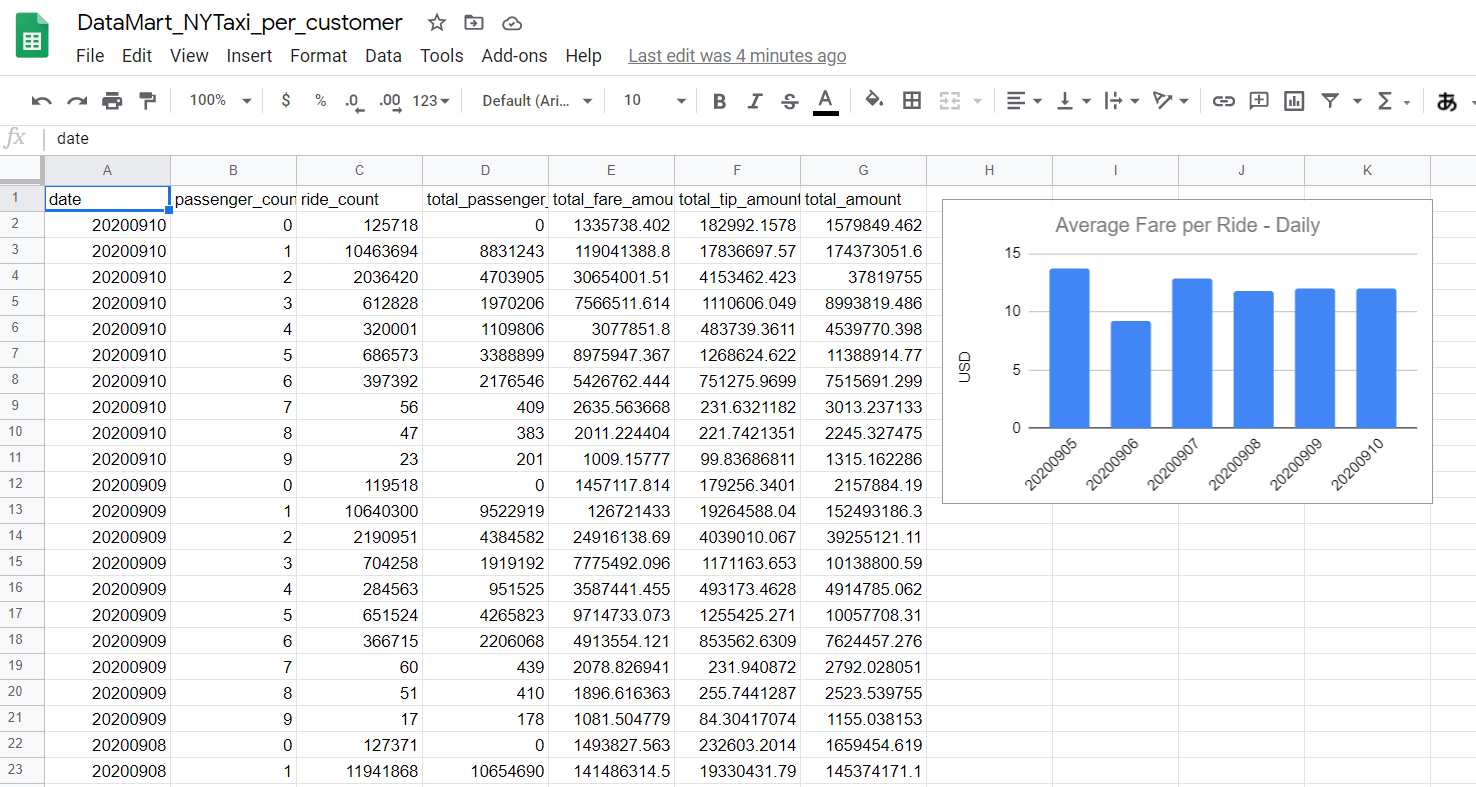
This sheet is automatically updated every morning, and as the data warehouse is receiving new data through ETL from the data lake, we can easily keep track of the NY taxi KPIs the first thing every morning.
Ending Note
In a large company who hires data engineers and/or data architects along with data scientists, a primary role of data scientists is not necessarily to prepare the data infrastructure and put it in place, but knowing at least getting the gist of data architecture will benefit well to understand where we stand in the daily works.
Data Lake -> Data Warehouse -> Data Mart is a typical platform framework to process the data from the origin to the use case. Separating the process into three system components has many benefits for maintenance and purposefulness.
There are many options in the choice of tools. They are to be wisely selected against the data environment (size, type, and etc.) and the goal of the business.
Finally in this post, I discussed a case study where we prepared a small size data mart on Google Sheets, pulling out data from BigQuery as a data warehouse. With the use of Cloud Scheduler and Pub/Sub, the update was made to be automatic.
Reference
- “Data Lake vs Data Warehouse vs Data Mart”, Jatin Raisinghani, Holistic Blog (https://www.holistics.io/blog/data-lake-vs-data-warehouse-vs-data-mart/)
- A slide “Data Platform Guide” (in Japanese), @yuzutas0 (twitter), https://speakerdeck.com/yuzutas0/20200715
- “Connected Sheets: Analyze Big Data In Google Sheets”, BenCollins, https://www.benlcollins.com/spreadsheets/connected-sheets/