What Are the “plt” and “ax” in Matplotlib Exactly?
Plotting on a paper, or in a cell on the paper?
Indeed, as the most popular and fundamental data visualisation library, Matplotlib is kind of confusing in some perspectives. It is usually to see that someone asking about
- When should I use “axes”?
- Why some examples using “plt” while someone else using “ax”?
- What’s the difference between them?
It is good that there are so many examples online to show people how to use Matplotlib to draw this kind of chart or that kind of chart, but I rarely see any tutorials mentioning “why”. This may cause people who have less programming experience or switching from other languages like R becomes very confusing.
In this article, I won’t teach you to draw any specific charts using Matplotlib but will try to explain the basic but important regarding Matplotlib — what are the “plt” and “ax” people usually use.
Concepts


To clarify, when I say “plt”, it doesn’t exist in the Matplotlib library. It is called “plt” because most of Python programmers like to import Matplotlib and make an alias called “plt”, which I believe you should know, but just in case.
import matplotlib.pyplot as pltThen, come back to our main topic. Let’s draw a simple chart for demonstration purposes.
import numpy as npplt.plot(np.random.rand(20))
plt.title('test title')
plt.show()

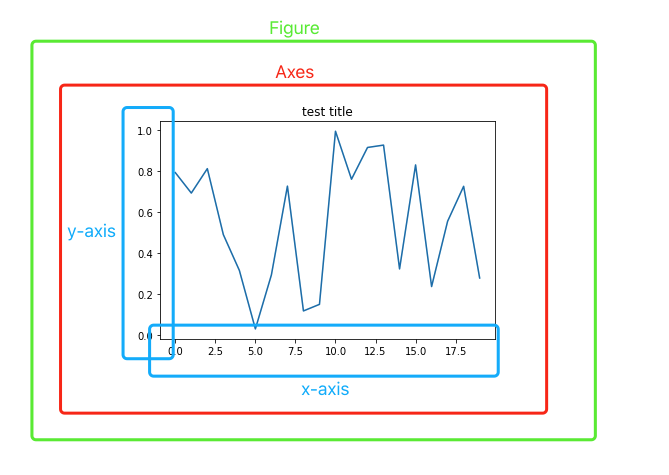
As shown in the above-annotated screenshot, when we draw a graph using plt:
- A
Figureobject is generated (shown in green) - An
Axesobject is generated implicitly with the plotted line chart (shown in red) - All the elements of the plot such as x and y-axis are rendered inside the
Axesobject (shown in blue)
Well, if we use some kind of metaphor here:
Figureis like a paper that you can draw anything you want- We have to draw a chart in a “cell”, which is
Axesin this context - If we’re drawing only one graph, we don’t have to draw a “cell” first, just simply draw on the paper anyway. So, we can use
plt.plot(...).
Explicitly Draw the “Cell”


Of course, we can explicitly draw a “cell” on the “paper”, to tell Matplotlib that we’re gonna draw a chart inside this cell. Then, we have the following code.
fig, ax = plt.subplots()
ax.plot(np.random.rand(20))
ax.set_title('test title')
plt.show()
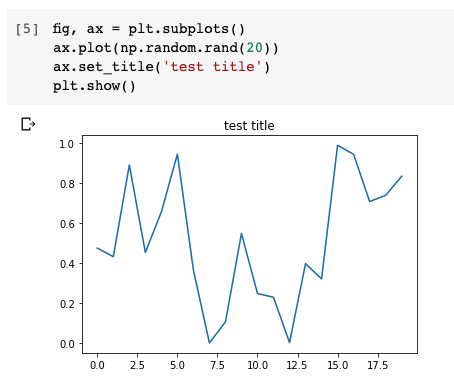
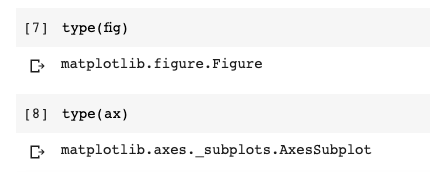
Exactly the same results. The only difference is that we explicitly draw the “cell” so that we are able to get the Figure and Axes object.
Indeed, when we just want to plot one graph, it is not necessary to “draw” this cell. However, you must be noticed that we have to do this when we want to draw multiple graphs in one plot. In other words, the subplots.
n_rows = 2
n_cols = 2fig, axes = plt.subplots(n_rows, n_cols)
for row_num in range(n_rows):
    for col_num in range(n_cols):
        ax = axes[row_num][col_num]
        ax.plot(np.random.rand(20))
        ax.set_title(f'Plot ({row_num+1}, {col_num+1})')fig.suptitle('Main title')
fig.tight_layout()
plt.show()

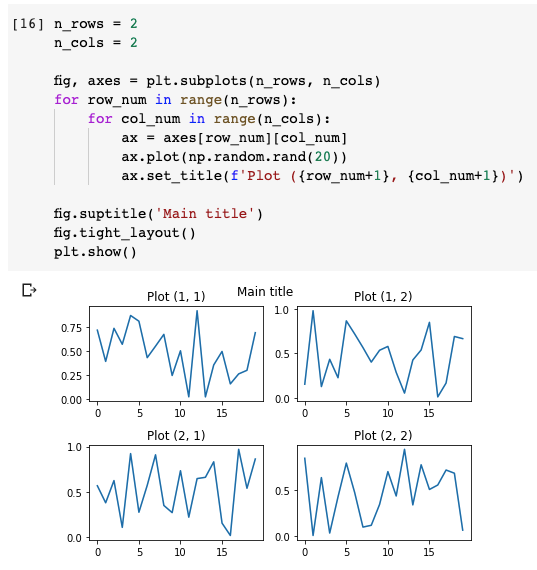
In this code snippet, we firstly declared how many rows and columns we want to “draw”. 2 by 2 means that we want to draw 4 “cells”.
Then, in each cell, we plot a random line chart and assign a title based on its row number and column number. Please note that we’re using Axes instances.
After that, we define a “Main title” on the “paper”, which is the Figure instance. So, we have this supertitle that does not belong to any “cell”, but on the paper.
Finally, before calling the show() method, we need to ask the “paper” — Figure instance — to automatically give enough padding between the cells by calling its tight_layout() method. Otherwise,
Summary


Hopefully, now you understand better what are plt and ax people are using exactly.
Basically, the plt is a common alias of matplotlib.pyplot used by most people. When we plot something using plt such as plt.line(...), we implicitly created a Figure instance and an Axes inside the Figure object. This is totally fine and very convenient when we just want to draw a single graph.
However, we can explicitly call plt.subplots() to get the Figure object and Axes object, in order to do more things on them. When we want to draw multiple subplots on a Figure, it is usually required to use this approach.
Also, here are the Matplotlib official API reference for the Figure and Axes classes. It is highly recommended to check them out and try some methods yourselves to make sure you understand even deeper.