Parameter Actions: KPI Navigator
Parameter Actions are now available in Tableau’s 19.2 Beta release. This new feature will enable you to interactively answer new types of questions and get to insights faster.
Let’s walk through an example together.
The Problem
You have a view that contains a couple of metrics for disparate measures (i.e. YtD Profit, YtD Sales).
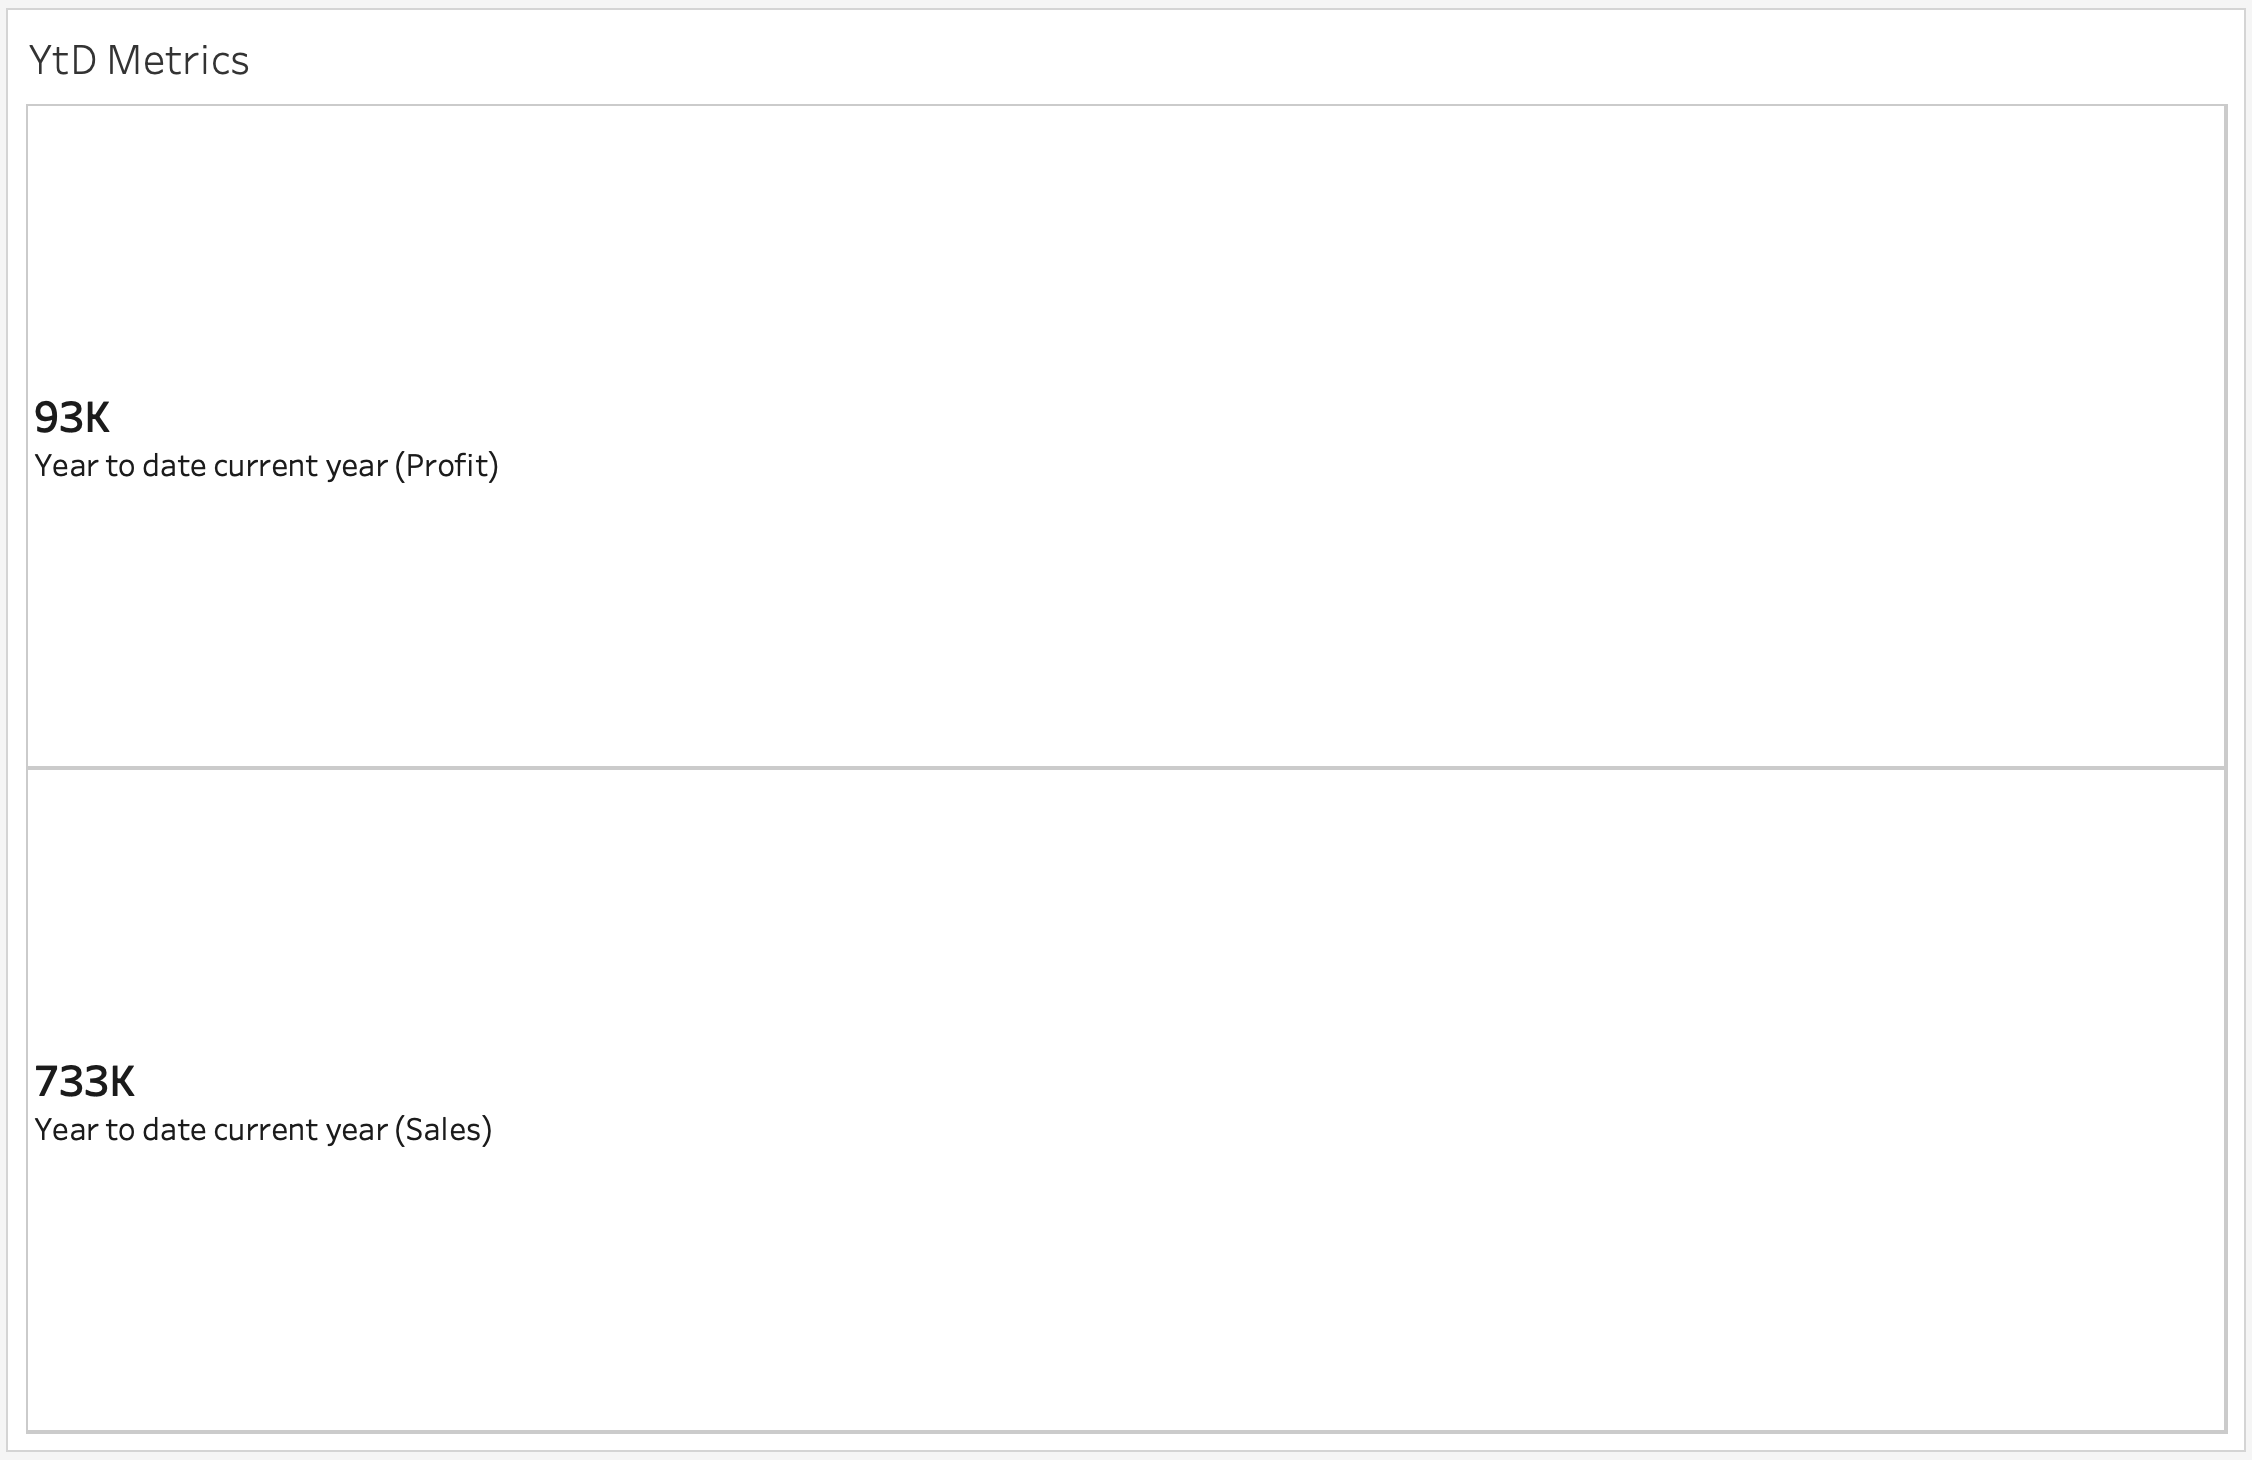
You want to understand the reasons behind Sales adding up to 733k so far this year. How did different data source attribute values (Ship Modes, States etc.) contribute to this number? You do not want to use a filter because you do not want to slice your table and you don’t want to use a set because a set’s domain does not contain attribute title values.
While Navigation Actions allow you to navigate to any sheet or dashboard, how do you conditionally drill-down to a measure of your choice in the destination dashboard?
Parameter Actions to the rescue.
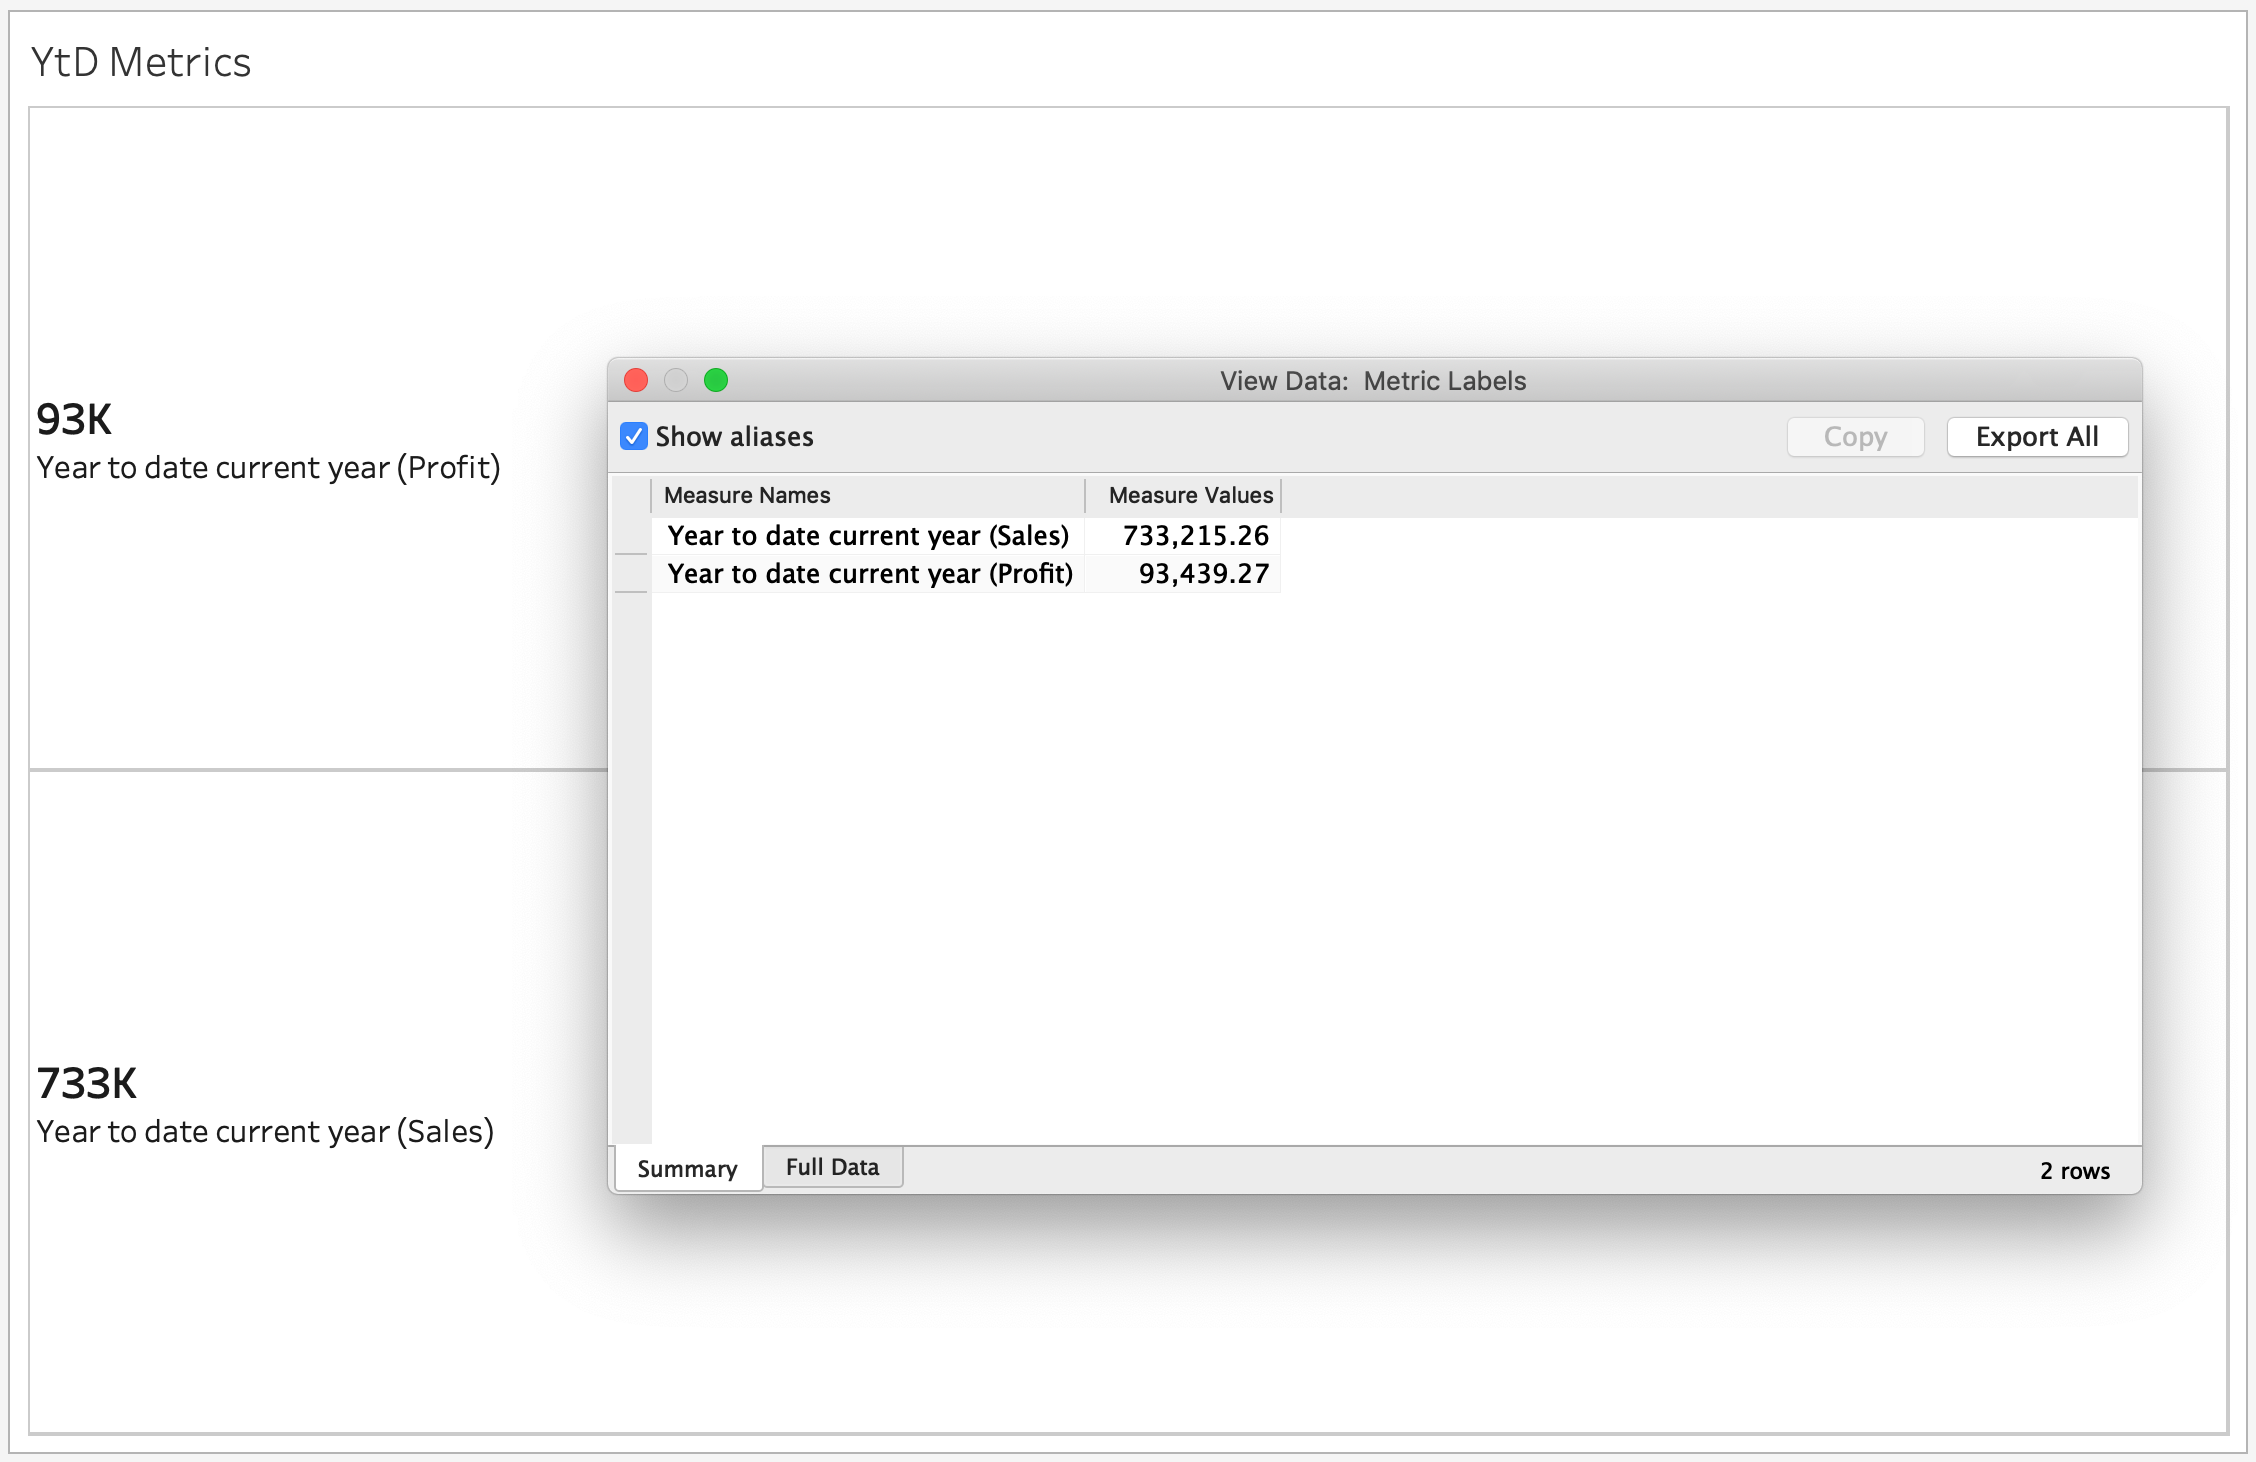
The assigned value for the parameter does not have to be a row-level computed value, it can be a result of an operation (aggregation, table calculation, pivot). For instance, in the example above, you can now leverage values in the Measure Names column along with the Navigation Action to visually decide which YtD measure you want to learn more about.
The data in the origin sheet looks as follows:
Let’s define a new parameter “Selected Measure.” We will set its datatype to String and let it have an arbitrary value.
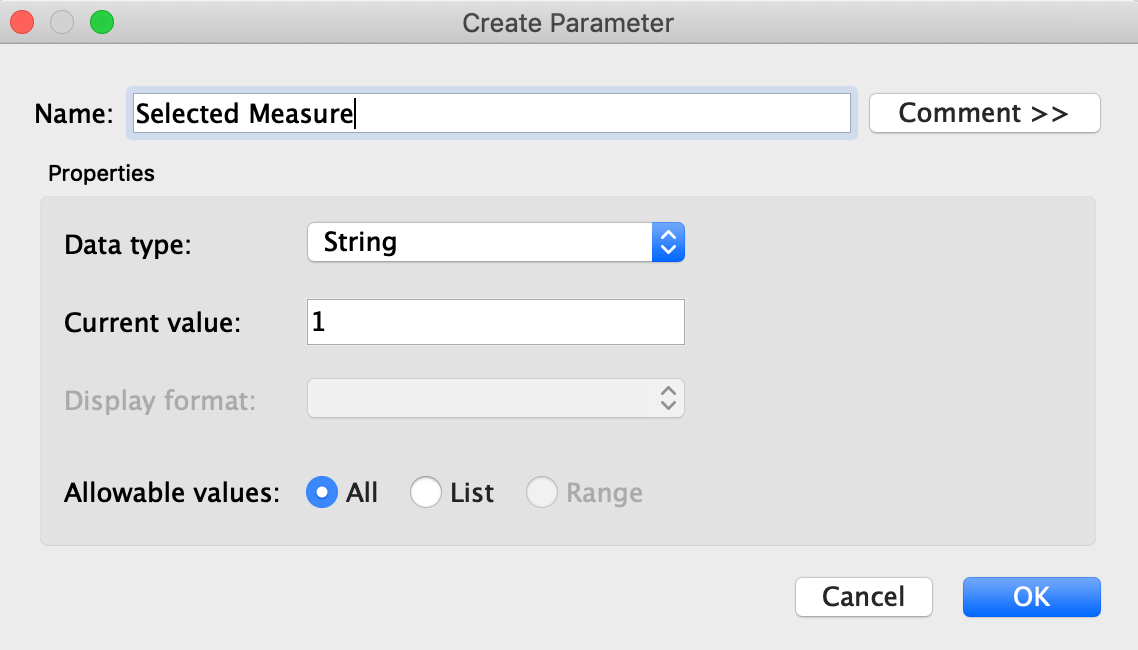
We will then create a Parameter Action that picks the value of the “Measure Names” column from the viz and assigns it to the “Selected Measure” parameter.
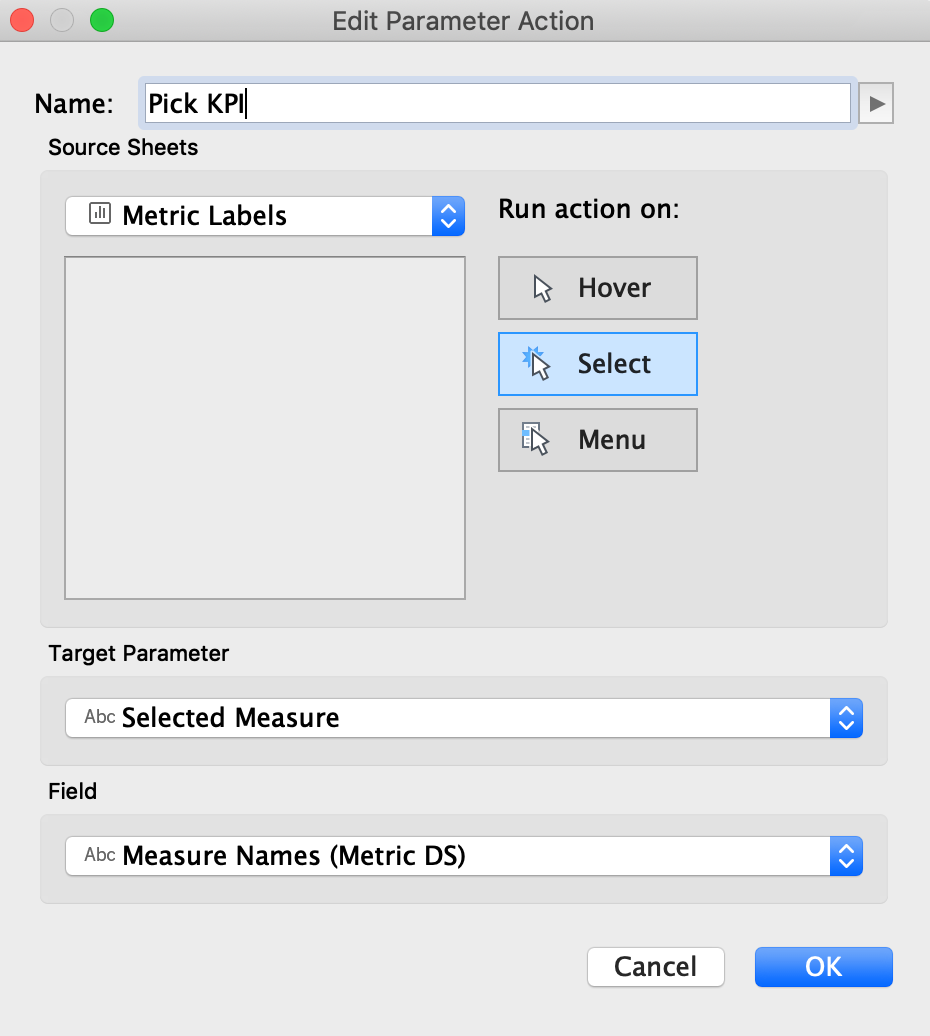
Now notice how the selection of a cell in the following viz, results in the parameter’s value changing to “Year to date current year (Sales/Profit),” respectively.
However, this still is not having any effect on my analysis unless I consume the parameter in a calculation. In our schema the measure names are “Sales” and “Profit” so let’s check if the “Selected Measure” parameter contains either one of the two strings. If so, we will run respective calculations for that measure. You can ignore the nested case statements using “Period Type,” but all this is, is a different parameter that returns different metrics based on a viz consumer’s selection. For instance, after I select the Sales metric and land to the destination dashboard, I may want to change the vizes to show “Difference Year to Date (Sales)” or “Rolling 3 Months (Sales)” etc.
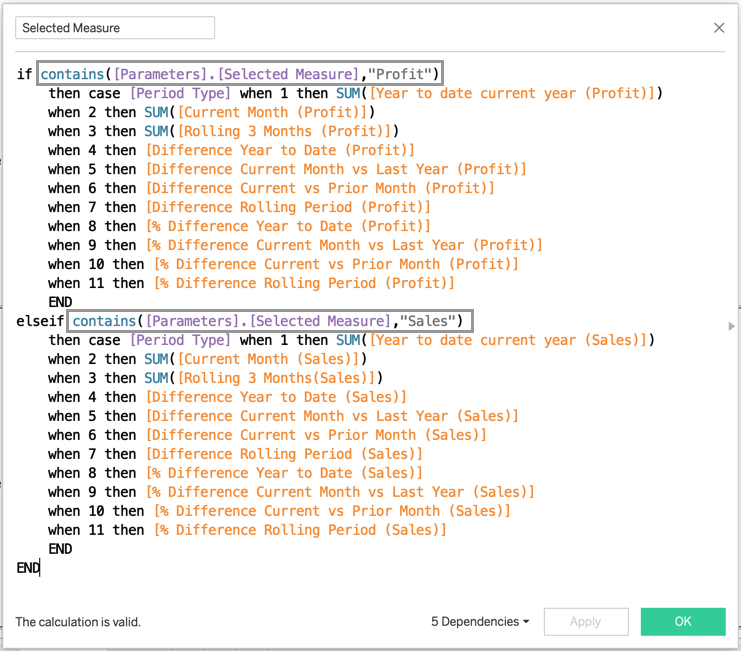
Now I can use the “Selected Measure” calc in any viz I want.
And by constructing different vizes, we can combine them into a single dashboard.
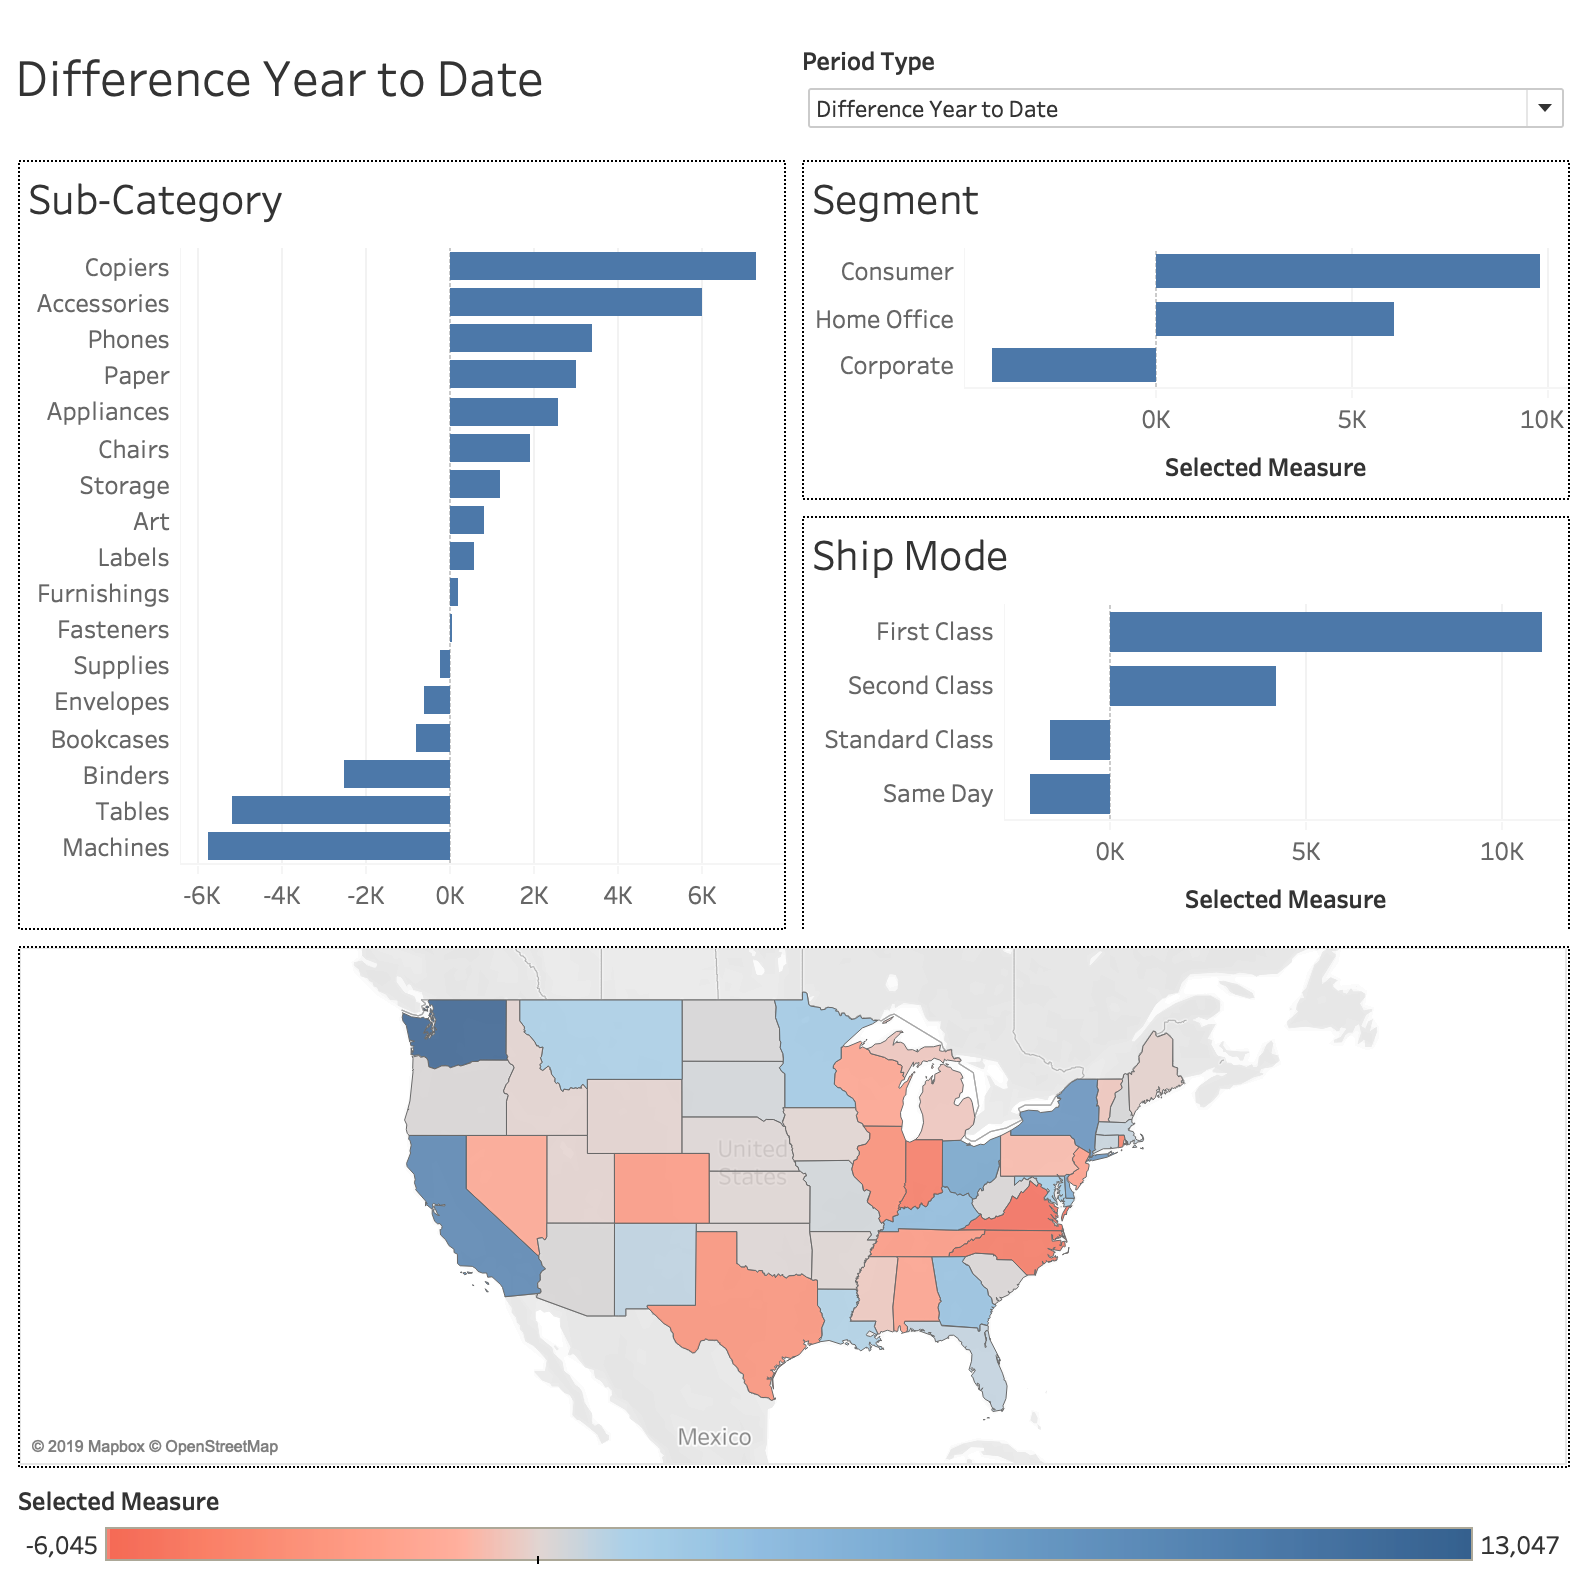
The parameter action is doing what it is supposed to be doing and we have setup our origin and destination dashboards. In order to handle the navigation facet of this setup we will use a Navigation Action that will run in tandem with the Parameter Action and move us between the two views. We will also include a back button at the top left corner of the destination dashboard.
I hope you found this useful! Feel free to reach out with any questions or ideas you may have to improve Tableau interactive analytics :)