SeaLevel.info
Your one-stop source for sea-level information.
Learn about climate change...
If you'd like to learn more about climate change, here are some trustworthy resources:
https://tinyurl.com/learnmore4
News...
- August 31, 2019 — CNN vs. what the science says (and there's a slightly abbreviated version on WUWT).
- August 27, 2019 — Former President Obama apparently doesn't actually believe the nonsense he used to parrot, about dangerous climate change and sea-level rise. He and Michelle just purchased an enormous seaside mansion, barely above sea-level, on Martha's Vineyard.
- January 31, 2019 — Drs. Roy Spencer and John Christy debunk speculation that global warming causes frigid winters: If the Polar Vortex is due to Global Warming, Why are U.S. Cold Waves Decreasing? ↑
- December 19, 2018 — Dave Burton's remarks to Gov. Cooper's “NC Climate Change Interagency Council” (which apparently fell on deaf ears). ↑
- December 8, 2018 — I can recommend this excellent guest editorial today by Paul Driessen, at TownHall.com: Climate Lunacy Takes Center Stage ↑
- November 14, 2018 — Most readers here probably know that I am very honored to have been invited to join the CO2 Coalition, an organization of mostly-prominent scientists (plus a few no-names like me!), dedicated to de-politicizing the public debate surrounding CO2 emissions and climate change, and helping to substitute sound scientific analysis for unscientific climate hysteria.
Today I'm pleased to share a letter by Prof. William H. Smith (pdf or ePub), entitled, The Double Bind and Scientific Honesty, in which (among other things) he explains why he, too, is very pleased to be a member of the CO2 Coalition.
In his letter Prof. Smith also mentions this 30 year old (1988) editorial, by the late Dr. Stephen Schneider, in which Dr. Schneider wrestled with “groping to find the balance between being effective and being honest.” Not mentioned in his editorial was the fact that, at that time, Dr. Schneider was a relatively fresh convert to global warming alarmism. A decade earlier, he made an appearance in this 1978 television program (starting at about the 6:00 minute mark), worrying about (can you guess?), global cooling. ↑ - October 7, 2018 — An audit of global warming data finds it riddled with errors: #Datagate! First ever audit of global temperature data finds freezing tropical islands, boiling towns, boats on land.
Follow-up (Oct. 15) — Met Office responds to HadCRUT global temperature audit by McLean. ↑ - September 26, 2018 — I can highly recommend this excellent article by Jim Steele on WUWT, about the tug-of-war in California between science and sea-level alarmism. ↑
- September 24, 2018 — Another short WUWT article:
Greenland Ice Sheet apparently gains mass for the 2nd year in a row. ↑ - September 10, 2018 —
Apologies in advance if sealevel.info goes down during the hurricane, which is likely.In the meantime, if you want to learn more about climate change, here are some good resources:
https://sealevel.info/learnmore.html
UPDATE: Thankfully, we had no problems, and no damage. The power didn't even go off. ↑ - August 15, 2018 — Our CO2 data and graphs have been updated to include an estimate for 2018, 408.4 ppmv (based on seasonally-adjusted June & July measurements). ↑
- August 14, 2018 — WUWT article: A shining example of @Google and @YouTube protecting us against misinformation. ↑
- August 13, 2018 — I'm looking forward to watching this series of educational lectures, from Camp Constitution 2018:
- Climate Change, with Lord Monckton
- California Wild Fires, Agenda 21-2030, with Debbie Bacigalupi
- The Global Warming, Climate Change Hoax, with Prof. Willie Soon
- Are the Sea Levels Rising? with Prof. Willie Soon ↑
- July 2, 2018 — Prof. Ross McKitrick's June 20, 2018 Financial Post article is an exceptionally clear yet thorough discussion of ECS climate sensitivity. (You can also find information on that topic on the salevel.info “Resources” page.) ↑
- June 2, 2018 — We
 got a letter to the editor in the Wall Street Journal, with a lot of help from my friends, meteorologist Tom Wysmuller, and Prof. Will Happer. Here's the original version, as we submitted it (with references and a graph).
Here's the WSJ's online version (or here):
https://www.wsj.com/articles/you-wouldnt-think-sea-level-is-so-complex-1527873471
If you want to learn more about climate change, here are some resources:
Introductions:
http://ClimateCurious.com
http://prageru.com/playlists/what-science-reveals-about-climate-change
Balanced debate:
http://thebestschools.org/special/karoly-happer-dialogue-global-warming
Amicus brief in Calif v. BP lawsuit, by 3 top scientists:
http://co2coalition.org/wp-content/uploads/2018/03/Happer-Koonin-Lindzen.pdf
Our sites:
http://sealevel.info (Burton)
http://colderside.com (Wysmuller)
http://co2coalition.org (Happer, et al)
The top climate blog (news & discussion):
http://wattsupwiththat.com - April 26, 2018 — Updated with latest PSMSL data.
- April 14, 2018 — It's now been six years since the “Fakegate” scandal, in which the Climate Movement's top ethicist, Dr. Peter Gleick, and the climate activists at DeSmogBlog, conspired to smear Heartland Institute with a clumsily forged fake “strategy memo.”
They got caught, which you'd think would end their careers, and land at least some of them in prison. But it really hasn't hurt them much. The Obama-appointed U.S. Attorney protected them by refusing to prosecute until the statute of limitations had run out, and most climate activists don't seem to mind being lied to. - March 27, 2017 — A Tutorial On Climate Change. Oakland and San Francisco, California, have have filed lawsuits against oil companies to recover costs associated with adapting to climate change. U.S. District Judge William Alsup, who is presiding over the case, requested that the parties provide tutorials on climate change and the history of climate science.
This is one such tutorial, submitted to the Court as an amicus brief by three extremely distinguished scholars: Drs. William Happer, Steven Koonin, and Richard Lindzen: Happer-Koonin-Lindzen.pdf (or here) - February 14, 2018 — A few decades ago, the focus of most “climate scientists” (who were generally called climatologists, back then), shifted from observations to modeling. These days, all the climate catastrophists' predictions are based on alarming computer models, which, desite 2/3 century of rapidly climbing greenhouse gas emissions and levels, are still largely unconfirmed by measurements.
Enough time has elapsed to compare those early computer projections with measured reality. So how have they fared? Here I examine the very alarming predictions of a groundbreaking and highly influential 1988 climate modeling paper:
http://sealevel.info/hansen1988_retrospective.html
3½ months after that paper was published, the IPCC was founded, to address that perceived problem—which turns out to have been much ado about very little. - January 19, 2018 — I am quite impressed by PragerU's videos on climate change.
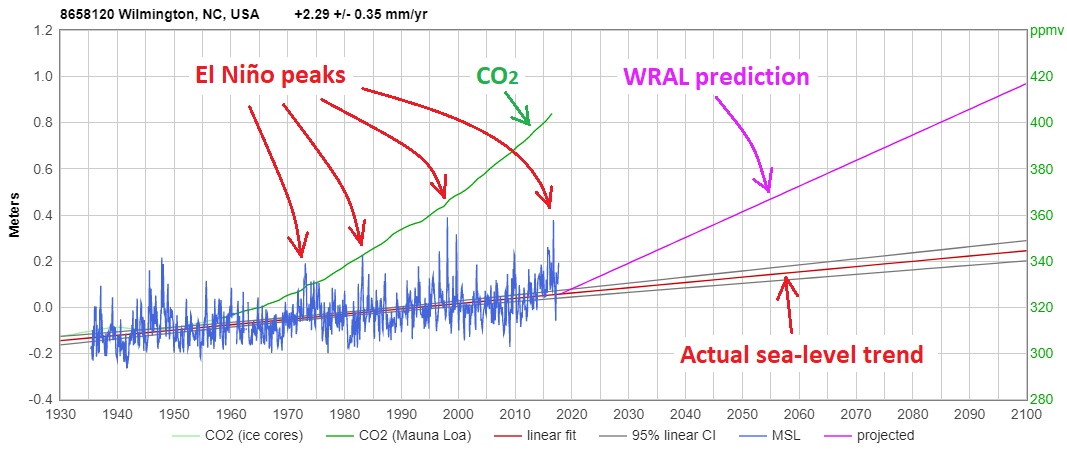
- October 27, 2017 — How did news organizations like WRAL come to believe that it's valid journalism to seek out "experts" at only one extreme of the range of the scientific opinion, for their "documentaries?" That's not news reporting, that's propagandizing.
Here's NC's longest, highest-quality sea-level record (Wilmington), plus the WRAL prediction.

Sea-level there has been rising at about 2.3 mm/year for the last 82 years. WRAL predicts 11.1 mm/year over the next 83 years = ~5x as fast as the real trend. That's despite the fact that, other than spikes with strong El Ninos, there's been no significant acceleration in sea-level rise, so far.
Read more here:
http://sealevel.info/cmt_on_wral_2017-10_sealevel_documentary.html - October 25, 2017 — The New Republic and Wired both ran a ridiculous disinformation story entitled, “Climate Change Is Killing Us Right Now.” This was my reply:
http://sealevel.info/Emily_Atkin_Climate_Change_Is_Killing_Us_Now_is_nonsense.html - On Tuesday, Sept. 12, 2017, at 7 p.m. there
will bewas an ICON Lecture in Chapel Hill, NC, with my friend, Princeton physicist Will Happer. (I manned the info table.)
http://sealevel.info/Happer_ICON_lecture_2017.html - July 29, 2017 — Our Internet service went down yesterday, and it's still down. As of this morning, the server is back up (sort of), limping along on a lower-bandwidth, jury-rigged temporary connection. Please forgive the outage and the sluggish response times.
Update: as of July 31, 2017 we're back up on the regular connection. - June 1, 2017 — I'm proud that North Carolina's U.S. Senator Thom Tillis signed this excellent letter to President Trump:
http://sealevel.info/Letter_from_22_US_Senators_to_President_Trump_on_Paris_climate_treaty.pdf - May 23, 2017 — I've
 made several minor improvements on the site. One is that on the data analysis pages for tide gauges you may now override the default width and height for the graphs.
 - May 21, 2017 — New WUWT article: Climate scientist Josh Willis shows you how to deal with your climate change denying uncle - but fails.
- March 27, 2017 — I've added an option to plot an extra line segment or curve, typically used to display a forecast of future sea-level rise. The projection can be drawn with either a constant acceleration curve, or a constant slope (linear). For example, here are the linear and constant acceleration graphs showing the wildly unrealistic accelerations required to reach the “three feet by 2060” prediction of some of the crazier climate alarmists for Miami.
- February 9, 2017 — The Next / Previous buttons on the sea-level analysis pages now do a better job of taking you to a related page (e.g., another site in the same country/coast).
- January 26, 2017 — Try the new (preliminary) country/coastline code list on the Data page.
- January 21, 2017 — Article on WUWT about this site: New website gives you the real deal on sea level rise and rates (or here).
- January 9, 2017 — All 1269 tide stations now have "thumbnail" graphs. (Technical note: the graphs are generated using Google Visualization tools, in Javascript — which can't write files. Ask me how I extracted the graphs, to make the thumbnail files!)
- January 5, 2017 — First release of interactive sea-level analysis and visualization tools. There are currently 1269 tide-station locations in the database, with sea-level data.
There are still a few rough edges, and a hefty to-do list; your feedback is valued! - December 25, 2016 — Merry Christmas! For your holiday enjoyment, here are five facts about climate change, which I posted on Quora.
Here's an earlier Quora screed, about what it means to be a “skeptic” about global warming. - December 2, 2016 — North Carolina's top environmental official, DEQ Secretary Don van der Vaart, has written two excellent letters about the role and policies of the EPA, which are worth your time to read. The first, which was also signed by the top environmental officials of four other States, was to President-elect Donald Trump. The second was to EPA Administrator Gina McCarthy. ↑
- October 3 - November 27, 2016 — Here's a preview of upcoming sea-level visualization tools at SeaLevel.info. These are graphs of sea-level at Honolulu, Hawaii, Wilmington, North Carolina, Chuuk Atoll, Micronesia, Brest, France and many other locations, with many interactive features and options.
Options are provided to choose the data source (NOAA vs. PSMSL, though not yet for all locations), to choose whether to display the linear trend (calculated from all available data, rather than recalculated every few years, as NOAA does) and/or quadratic trend (for detecting acceleration/


deceleration), and to choose whether to display confidence intervals, prediction intervals, and CO2 level. Additionally, you can optionally constrain the range of dates shown or analyzed, smooth the data in various ways, and adjust various display options, such as colors and line thickness. April 6, 2016 — Sea-level is not rising everywhere. The measured rate of coastal sea-level change varies from -17.59 mm/yr at Skagway, Alaska to +9.39 mm/yr at Kushiro, Japan. The average, as measured by the world's best long-term coastal tide gauges, is just under +1.5 mm/yr. That rate has not increased (“accelerated”) in over 85 years.
- March 28, 2016 - Ooops! Alarm over sinking islands premature as sea level falls at Kwajalein Atoll.
- February 3, 2016 — New "Feedbacks" page added. Everything You Always Wanted to Know About Climate Feedbacks* (*But Were Afraid to Ask).
It's still a bit rough around the edges. As always, I would be grateful for yourfeedbackcomments & corrections. - December 18, 2015 — The Heartland Institute is one of the world's finest public policy think tanks, and they've compiled an impressive collection of information about the COP-21 Paris climate conference, here: https://www.heartland.org/Cop21/
P.S. (12/28/2015) — someone complained about this link, who had apparently been misled by the Peter Gleick / DeSmogBlog forged document smear of Heartland. If you're not familiar with the story, read on. Dr. Gleick tried to anonymously distribute a “strategy memo” purportedly leaked from Heartland, which was actually a forgery, almost certainly created by Gleick, himself. Here's an article about the affair, from The Atlantic. Gleick was subsequently rewarded for his crimes by National Geographic's ScienceBlog subsidiary, where he's now their resident “scientist, innovator, and communicator” on global water, environment, climate, and presumably identity theft, fraud, character assassination, and forgery. ↑ - December 14, 2015 — Good essay today in USA Today by Rep. Lamar Smith (R-TX), chairman of the U.S. House Science, Space and Technology Committee.
- December 8, 2015 — The Resources page of this site got a long-overdue reorganization. Suggestions for further improvement are very welcome.
- October 16, 2015 — Environmentalist David Siegel shares What I Learned about Climate Change. He learned a lot, and so can you.
- May 12, 2015 — Australia's Joanne Nova reports on The scandal of sea levels — rising trends, acceleration — largely created by adjustments.
- May 5, 2015 — Here are Dave Burton's remarks at the North Carolina Coastal Resources Commission meeting in Manteo, NC, on April 29, 2015. It's part of the latest chapter in North Carolina's simmering kerfuffle over sea-level rise.
- April 2, 2013 — NOAA has released a major update of their tidestation data, with updated trend analysis and graphs for many stations, and many newly-analyzed PSMSL stations! See the new 2013 spreadsheets on the sealevel.info data page. (Note: as a result of these changes there are a few dead links in some of the older spreadsheets, which I've not yet fixed.)
- March 23, 2013 — Rev 0.7, added a spreadsheet with just the 45 NOAA-administered GLOSS-LTT tide stations, and also one with just the 42 of those 45 for which there was data through 2011. (The other stations were three Pacific Islands: Johnston Atoll, Pago Pago, and Chuuk.) Notes: In 2012 NOAA recalculated sea-level trends for those 42 U.S. tide gauges using data through 2011. The results were illuminating.The sea-level records for the 42 gauges had an average duration of 87.4 years (through 2011), and NOAA's calculated trends had an average confidence interval of ±0.515 mm/yr.When new (through 2011) trends were compared to the old (through 2006) trends, 23 sites showed slight declines in the rate of sea-level rise, and 19 showed slight increases.A simple, unweighted average of the 42 gauges comes to 2.025 mm/yr average rate of SLR through 2006, or 2.026 mm/yr through 2011 (a difference of one one-thousandth of a millimeter/year), or 1.286 mm/yr if you include Peltier's VM2 GIA adjustments.The bottom line is that, as measured by the 42 best U.S. long-term trend tide stations, the average rate of sea-level rise over the 5-year period from 2006-2011 is virtually identical to the rate for the full data record (averaging 87.4 years duration) -- more proof that there's been no detectable acceleration in rate of sea-level rise in response to elevated CO2 levels.
- March 8, 2013 — updated spreadsheets with latest NOAA and PSMSL data.
- March 1, 2013 — Rev 0.6, most of the spreadsheets here now have clickable column headers. Click a column header to sort the data by that column. Click again to reverse the sort order.
- September 29, 2012 — Rev. 0.5, added more papers to the Papers page, and more resources to the Resources page
- August 23, 2012 — Rev 0.2-0.4, moved resources list to Resources page, and added BlogRoll, Papers & Data pages
- August 19, 2012 — Rev 0.1
- August 15, 2012 — under construction


Last modified: 21-Jun-2019 (version 106)
Copyright © 2012-2019, David A. Burton.
Note: the “last modified” date and version number on this web
page are maintained automatically by TLIB Version Control.