SonarQubeでソースコードの静的解析とレビューを自動化してみる(前編)


はじめに
サーバーレス開発部@大阪の岩田です。 私が現在参画しているプロジェクトでは、GitHubFlowに近いフローで開発を進めています。 おおまかにですが、下記のようなフローです
- 各メンバーはmasterブランチをベースに自分がアサインされた機能を開発するためのブランチを作成して開発を進める
- 一通りの実装が完了したらプルリクエストを上げる
- レビュアーがソースコードレビューを行い、気になる点があればフィードバックし、問題なければmasterブランチにマージ。対象機能の開発が完了する
プロジェクトの中でレビュアーを担当する機会もあるのですが、指摘事項の中には静的解析ツールで機械的に検出できそうなポイントと、人間の目でアナログでチェックしないと検出できなさそうなポイントとに分かれることに気付きます。 例えばですが、
- 別機能と重複コードが多く、共通化した方が良い
- メソッドが肥大化しており、まとまった処理の単位で適宜分割した方が良い
- 未使用変数が存在する
こういった指摘事項はツールを利用してソースコードの静的解析を行うことで自動化できそうです。
今回ソースコードの静的解析にSonarQubeを利用する手法について調査したので、手順をご紹介します。 この前編ではEC2上にSonarQubeServerを構築し、手元のMacでPythonのソースコードをスキャンした結果をUPするところまでを行います。
SonarQubeとは?
SonarQubeはオープンソースの品質管理プラットフォームです。
- 重複コードの検出
- サイクロマチック数の計測
- 脆弱性のあるコードの検出
- バグを誘発しそうなコードの検出
- 指摘されたissueの管理
等々の機能を持っています。 また、プラグインが豊富で、多くのプログラミング言語をサポートしていることも特徴の1つです。
SonarQubeのアーキテクチャ
SonarQubeは下記の通り4つのコンポーネントが協調して動作します。
| コンポーネント | 役割 |
|---|---|
| SonarQube Server | DatabaseやScannerと連携し、品質指標の管理を行う。また、ユーザー向けにWebUIの提供も行う |
| SonarQube Database | Serverの情報や諸々の設定、スキャン結果を保存する |
| SonarQube Plugins | Serverの機能を拡張する |
| SonarQube Scanners | ソースコードを解析し、結果をServerに連携する |
SonarQubeServerの構築
それではさっそくSonarQubeの環境を構築していきます! まずはEC2上にSonarQubeServerを構築してみます。 今回は下記のような環境を構築していきます。
- インスタンスタイプ:t2.medium
- OS:Amazon Linux2
- DB:postgresql-9.2.23-3.amzn2.x86_64
- JDK:openjdk:1.8.0_171
- SonarQube:7.2.1
EC2インスタンスの作成
手順は省略します。 GIPを割り当てつつ、セキュリティグループで22,9000ポートを解放しておいておいて下さい。
Postgresのインストールと初期設定
作成したEC2にまずPostgresのインストールを行います。
1 2 | sudo yum install postgresql-serversudo systemctl enable postgresql.service |
次にDBクラスタの初期化を行います
1 2 | sudo su - postgresinitdb --encoding=UTF-8 --no-locale |
TCP/IPで接続できるように設定ファイルを修正します
1 | listen_addresses = '0.0.0.0' # what IP address(es) to listen on; |
1 | host all all 0.0.0.0/0 md5 |
postgresユーザーからec2-userに戻り、サービスを起動します
1 | sudo systemctl start postgresql |
SonarQube用のユーザーとデータベースを作成します。
まずはpsqlに入り、、、
1 | psql template1 postgres |
psql内で下記のコマンドを実行し、SonarQube用のユーザー、データベースを作成します。 ユーザー、パスワード、データベース全てsonarで作成しています。
1 2 3 | create user sonar with password 'sonar' createdb;\c template1 sonarcreate database sonar; |
SonarQubeServerのインストール
次にSonarQubeServerのインストールを行います。
SonarQubeユーザーの作成
SonarQube実行用のユーザーを作成しておきます
1 | sudo useradd sonarqube |
Javaのインストール
Javaが必要になるのでJavaをインストールします
1 | sudo yum install java-1.8.0-openjdk |
OSのパラメータ調整
SonarQubeは内部的にElasticSearchも利用しています。 ElasticSearch向けにカーネルパラメータとulimitの設定を行います。
カーネルパラメータの調整
1 2 | fs.file-max=65536vm.max_map_count=262144 |
Ulimitの設定
1 2 | sonarqube - nofile 65536sonarqube - nproc 2048 |
ここまでできたらOSを再起動してカーネルパラメータの変更を有効化します。
1 | sudo shutdown -r now |
SonarQubeのDLと配置
1 2 3 4 | wget https://sonarsource.bintray.com/Distribution/sonarqube/sonarqube-7.2.1.zip -O /tmp/sonarqube.zipunzip /tmp/sonarqube.zipsudo mv sonarqube-7.2.1 /usr/local/sudo chown -R sonarqube:sonarqube /usr/local/sonarqube-7.2.1/ |
SonarQubeが先ほど構築したPostgresqlのDBを使用するように設定ファイルを修正します。
1 2 3 4 5 | #----- PostgreSQL 8.x or greater# If you don't use the schema named "public", please refer to http://jira.sonarsource.com/browse/SONAR-5000sonar.jdbc.url=jdbc:postgresql://localhost/sonarsonar.jdbc.username=sonarsonar.jdbc.password=sonar |
SonarQubeを起動します。
1 | sudo su sonarqube -c "/usr/local/sonarqube-7.2.1/bin/linux-x86-64/sonar.sh start" |
動作確認
ここまでできたら、ブラウザのアドレスバーに http://<EC2のGIP>:9000 と入力してアクセスしてみます。

OKです! ダッシュボードが表示されています。
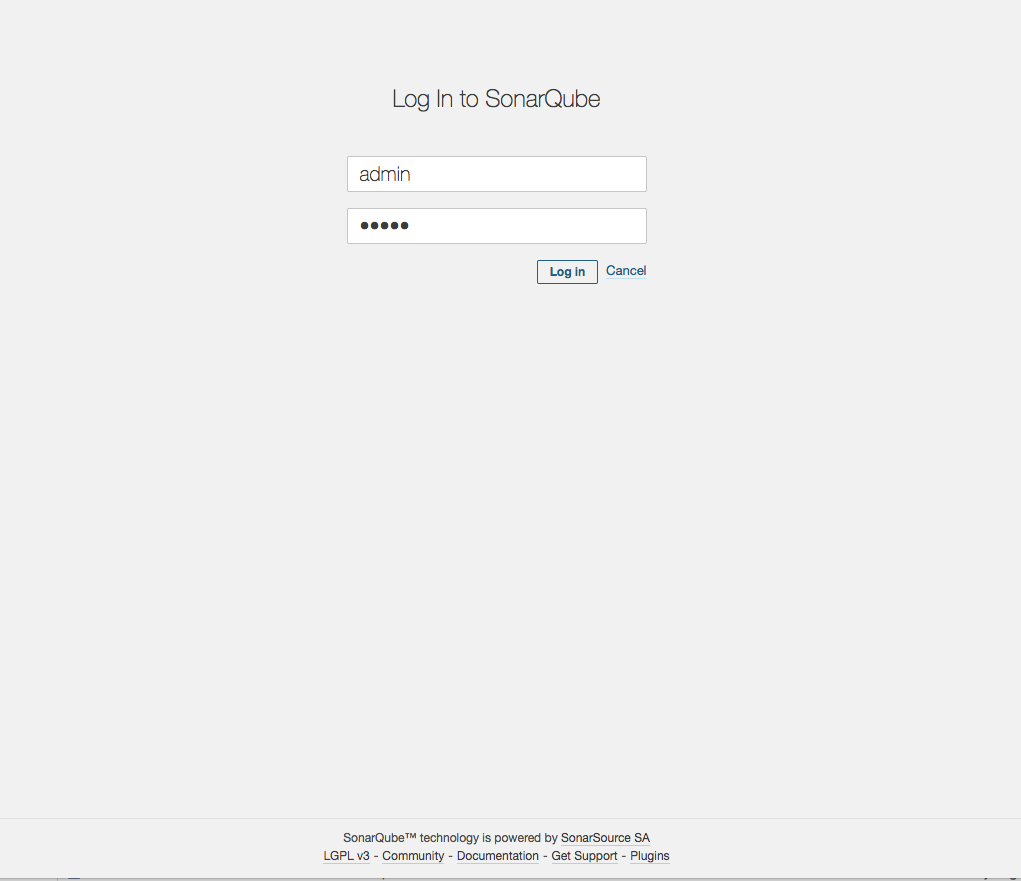
次に右上のLoginリンクをクリックし、ログインしてみます。 初期のID,パスワードは共にadminです。
ログインすると、ウィザードが起動するので、トークンを作成します。 ここで作成したトークンがScannerを実行する際に必要になるので、忘れずに控えておいて下さい。

次にPython向けの静的解析ルールをカスタマイズしてpylint関連のルールを有効化していきます。 メニューからQuality Profilesを選択し、デフォルト設定のSonar wayをコピーして独自の設定を作成します。
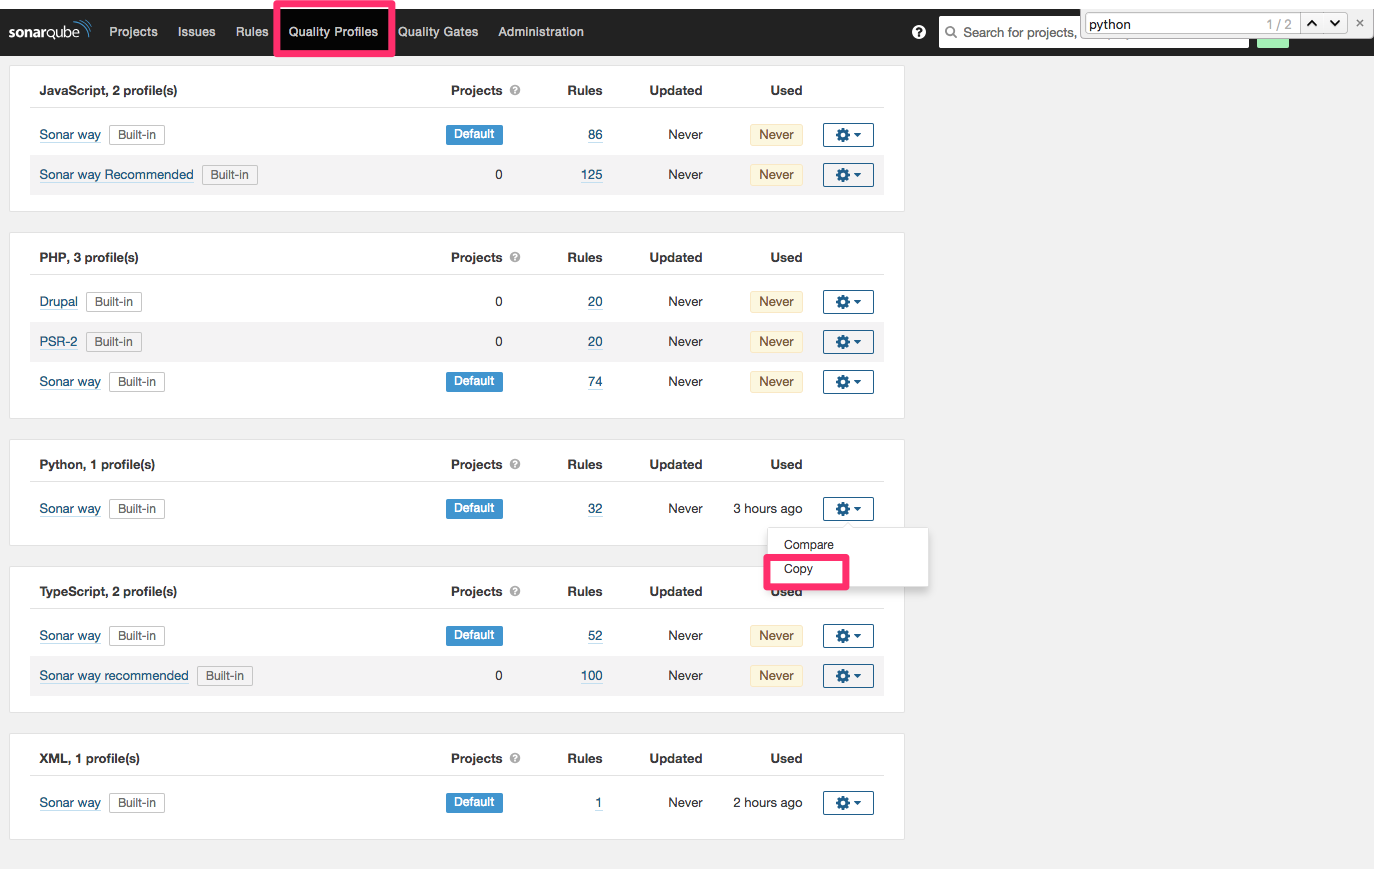
この例ではpython_custom_profileという名前で独自の設定を作成しています。
設定を作成したら、メニューのRulesからPython関連のルールを選択し、Bulk Changeをクリック。 先ほど作成した上記の設定内でルールを有効化します。
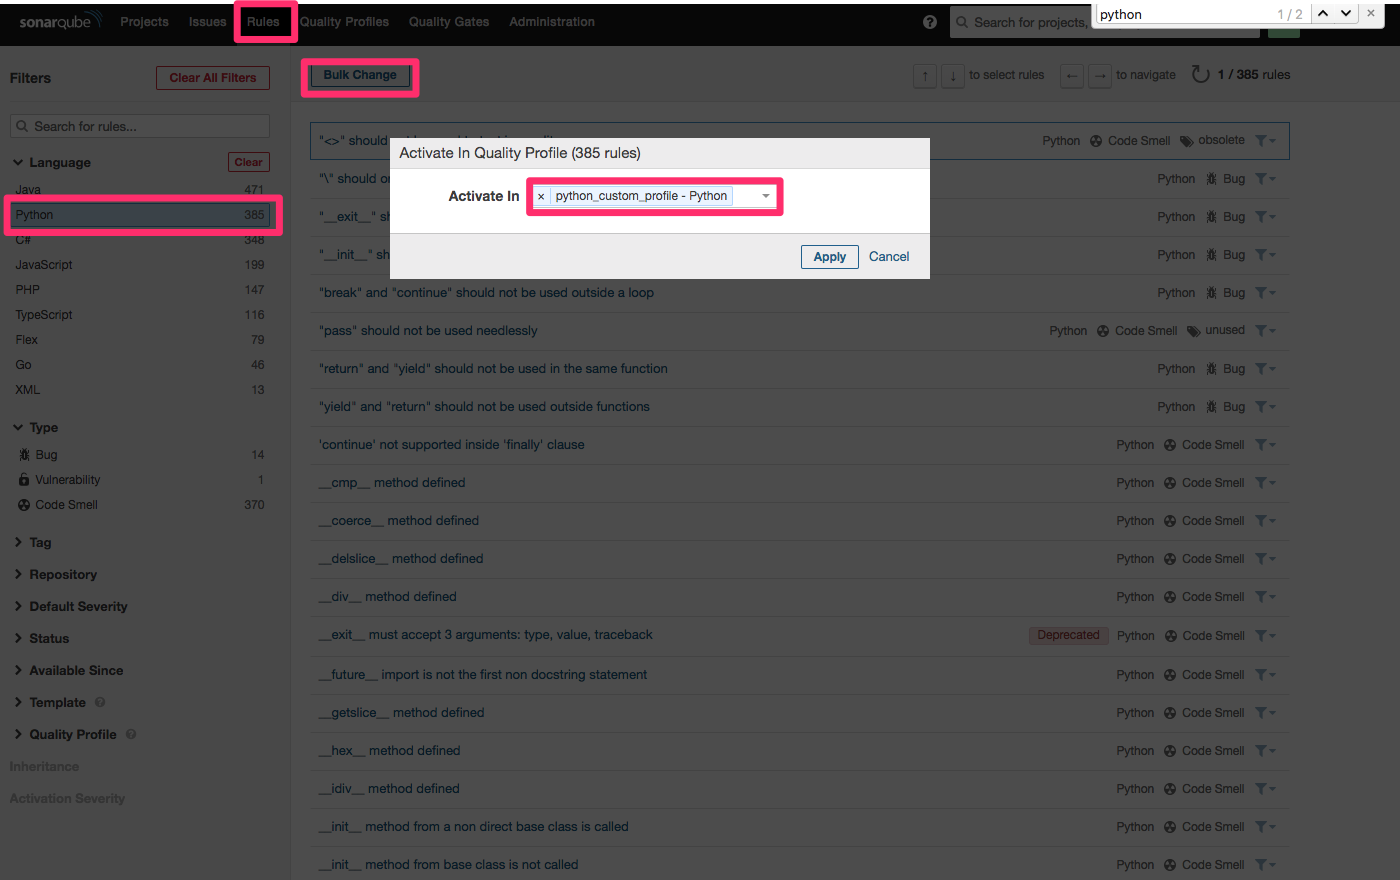
ここまでできたら一旦SonarQubeServerの構築は完了です。
SonarQube Scannerの準備
サーバー側が準備できたので、今度はローカルのMac側を準備していきます。 今回構築した環境は下記の通りです。
- OS:Mac OS X 10.13.5 x86_64
- JRE:1.8.0_121
- SonarQube Scanner:3.2.0.1227
まずSonarScannerをDL・解凍します。
1 2 | wget https://sonarsource.bintray.com/Distribution/sonar-scanner-cli/sonar-scanner-cli-3.2.0.1227-macosx.zipunzip sonar-scanner-cli-3.2.0.1227-macosx.zip |
設定ファイルの準備
スキャン用の設定ファイルsonar-project.propertiesをスキャン対象のプロジェクト直下に用意します。 今回は下記のような設定としました。 SonarQubeServerやSonarScanner単体ではPythonのユニットテストを実行したりカバレッジを取得することはできないので、MAC上でユニットテストとカバレッジの取得を行い、SonarQubeServerにUPします。
1 2 3 4 5 6 7 8 9 | sonar.host.url=http://<EC2のGIP>:9000 #SonarQubeServerを指定sonar.projectKey=pythondemo #SonarQubeServerで管理するプロジェクトのキーを指定sonar.projectName=pythondemo #SonarQubeServerのWebUI上で表示するプロジェクトの名前sonar.sources=. #ソースのパスを指定sonar.login=xxxxxxxxx #作成したトークンを設定sonar.exclusions=.venv/**,**/tests*.py #対象外とするファイルを指定sonar.python.coverage.reportPath=report/cover.xml #カバレッジレポートのXMLファイルsonar.python.xunit.reportPath=report/nosetests.xml #jUnit形式のユニットテストのレポートファイル |
django-noseの導入とカバレッジ取得
今回スキャンしたい対象がDjangoで作成したアプリケーションなので、django-noseというライブラリを導入してDjangoアプリのカバレッジを取得できるようにします。
1 | pipenv install --dev django-nose |
Djangoのテストがdjango-noseを使用するように設定ファイルを修正します。
1 2 3 4 5 6 7 8 9 10 11 12 13 14 | INSTALLED_APPS = [ ... 'django_nose',]TEST_RUNNER = 'django_nose.NoseTestSuiteRunner'NOSE_ARGS = [ '--with-coverage', '--cover-erase', '--cover-xml', '--cover-xml-file=report/cover.xml', '--with-xunit', '--xunit-file=report/nosetests.xml',] |
カバレッジのレポートをreport/cover.xmlに、ユニットテストに結果をreport/nosetests.xmlに吐き出すように設定しています。
準備ができたのでテストを実行し、カバレッジとユニットテストのレポートを生成します。
1 2 3 4 5 6 | python manage.py testnosetests batch --with-coverage --cover-package=batch --cover-erase --cover-xml --cover-xml-file=report/cover.xml --with-xunit --xunit-file=report/nosetests.xml --verbosity=1Creating test database for alias 'default'...... |
スキャンしてみる
準備ができたので、スキャンを実行してみます。
1 2 3 4 5 6 7 8 9 10 11 12 13 14 15 16 17 18 19 20 21 22 23 24 25 26 27 28 29 30 31 32 33 34 35 36 37 38 39 40 41 42 43 44 45 46 47 48 49 | /Users/xxxxxx/Downloads/sonar-scanner-3.2.0.1227-macosx/bin/sonar-scannerINFO: Scanner configuration file: /Users/xxxxxx/Downloads/sonar-scanner-3.2.0.1227-macosx/conf/sonar-scanner.propertiesINFO: Project root configuration file: /Users/xxxxxx/Documents/xxxxxx/sonar-project.propertiesINFO: SonarQube Scanner 3.2.0.1227INFO: Java 1.8.0_121 Oracle Corporation (64-bit)INFO: Mac OS X 10.13.5 x86_64INFO: User cache: /Users/xxxxxx/.sonar/cacheINFO: SonarQube server 7.2.1INFO: Default locale: "ja_JP", source code encoding: "UTF-8" (analysis is platform dependent)INFO: Publish modeINFO: Load global settingsINFO: Load global settings (done) | time=172msINFO: Server id: AWTuoUvf50APRC1pYevzINFO: User cache: /Users/xxxxxx/.sonar/cacheINFO: Load/download pluginsINFO: Load plugins indexINFO: Load plugins index (done) | time=102msINFO: Load/download plugins (done) | time=149msINFO: Loaded core extensions:INFO: Process project propertiesINFO: Load project repositoriesINFO: Load project repositories (done) | time=141msINFO: Load quality profilesINFO: Load quality profiles (done) | time=64msINFO: Load active rulesINFO: Load active rules (done) | time=787msINFO: Load metrics repositoryINFO: Load metrics repository (done) | time=60msINFO: Project key: pythondemoINFO: Project base dir: /Users/xxxxxx/Documents/xxxxxxINFO: ------------- Scan pythondemoINFO: Load server rulesINFO: Load server rules (done) | time=114msINFO: Base dir: /Users/xxxxxx/Documents/xxxxxx/INFO: Working dir: /Users/xxxxxx/Documents/xxxxxx/.scannerworkINFO: Source paths: .INFO: Source encoding: UTF-8, default locale: ja_JPINFO: Index filesINFO: Excluded sources:INFO: .venv/**INFO: **/tests*.pyINFO: 509 files indexedINFO: 164 files ignored because of inclusion/exclusion patternsINFO: Quality profile for py: Sonar wayINFO: Quality profile for xml: Sonar wayINFO: Sensor Python Squid Sensor ... |
しばらく待つとスキャンが完了するので、SonarQubeServerを確認してみます。
スキャン結果を確認してみる
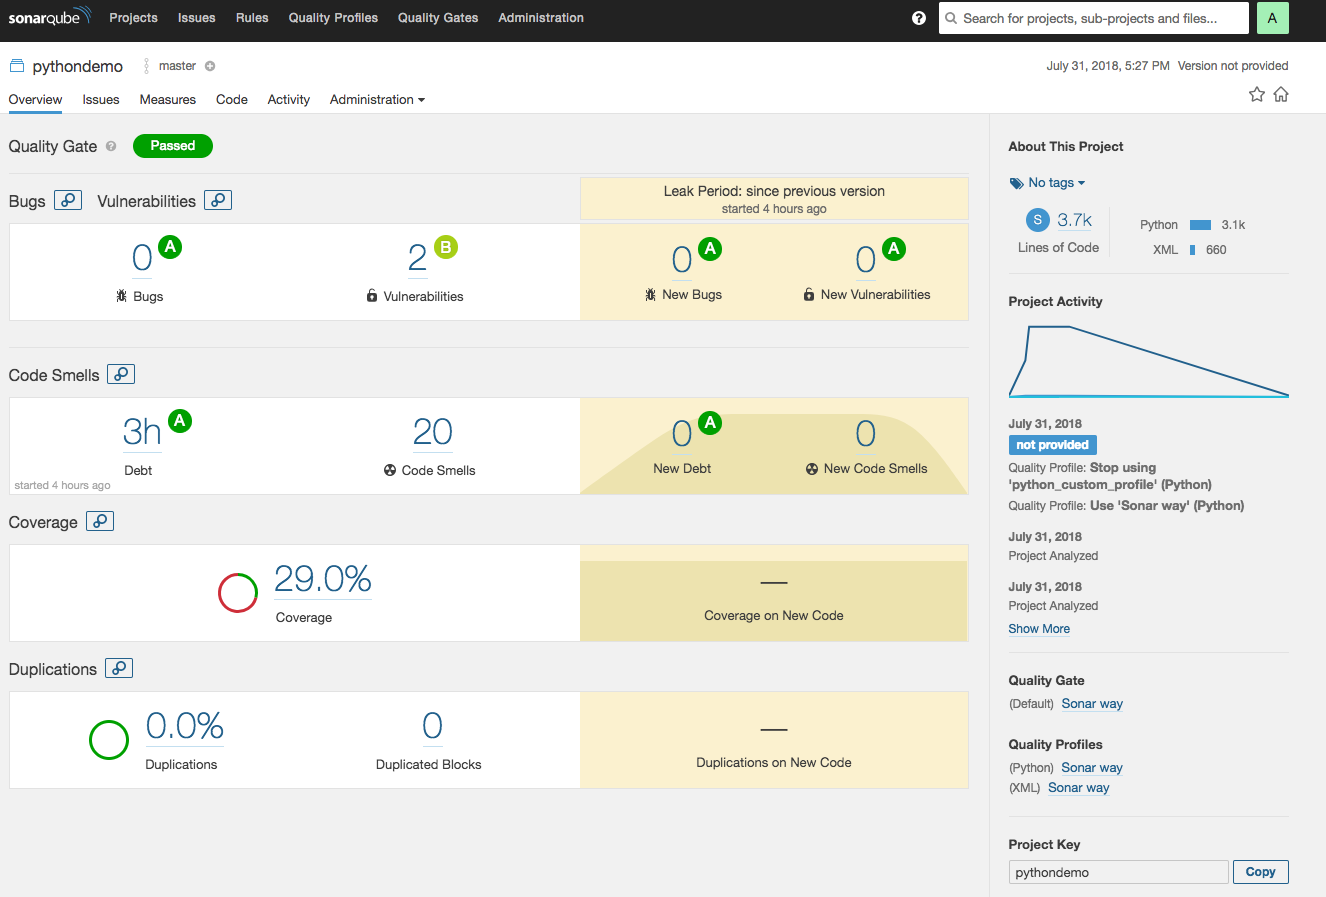
スキャン完了後にダッシュボードにアクセスすると、先ほどスキャンしたプロジェクトがダッシュボードに表示されています。
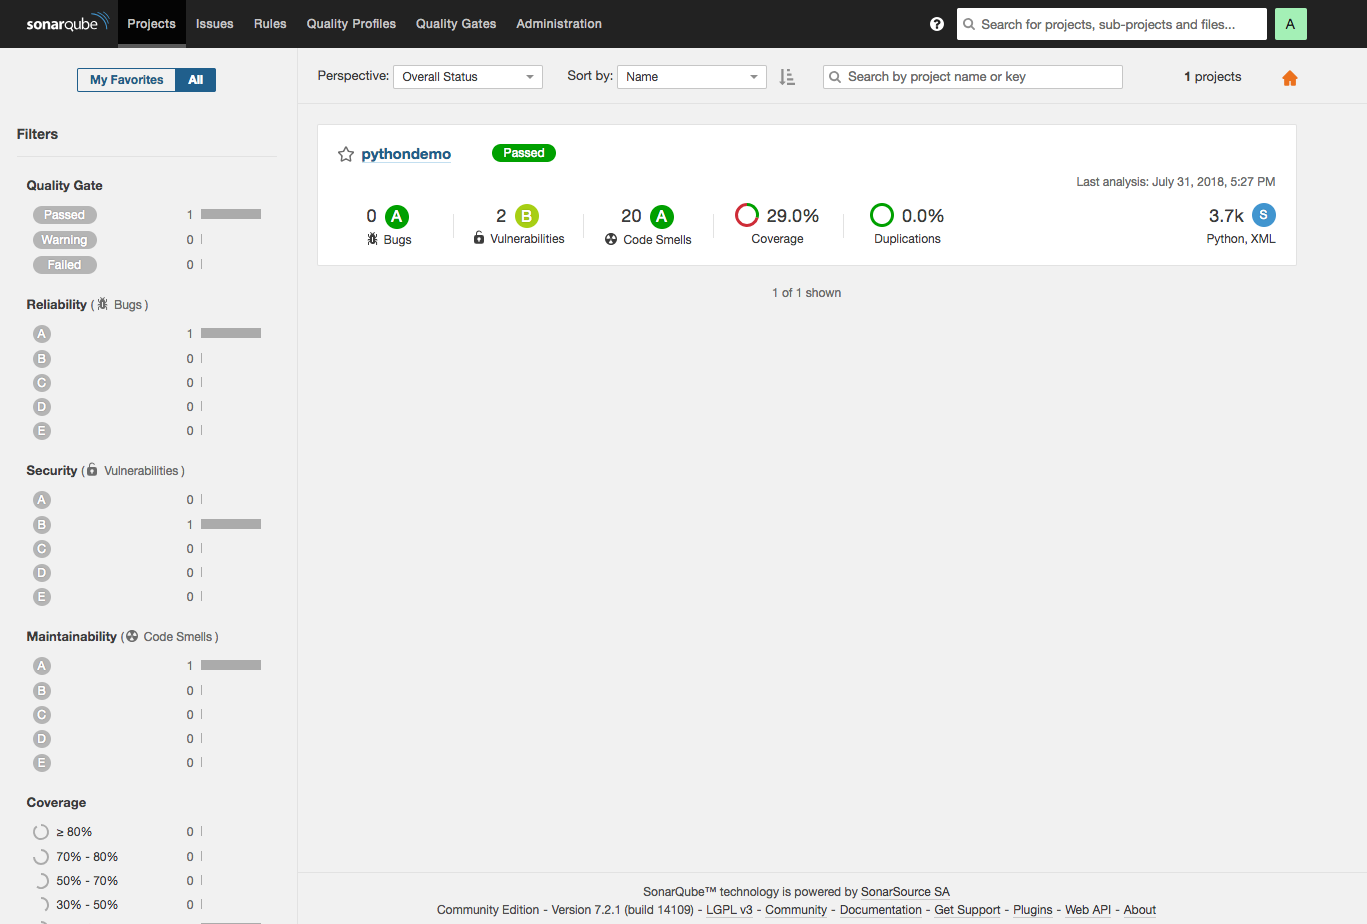
プロジェクトの詳細に入ると、スキャン結果のサマリを確認することができます。
試しに指摘事項の1つの詳細を確認してみます。

ここでは無意味なif文のネストが指摘されており、どのように修正すれば良いかサンプルも提示されています。
まとめ
SonarQubeを利用したソースコードの静的解析について見てきました。 こういったツールを活用することでシステムの品質、プロジェクトの生産性、共に向上させることが出来るのでは無いでしょうか?
次回はスキャンをCI/CDに組み込みつつ、使い方についてもう少し深掘りしてみようと思います。
参考
