
はじめに
物体検出とかではIoU(Intersection over Union、Jaccard index)をよく使いますが、どのくらいの数値でどのくらいの重なり具合なのかがよくわからなかったので図にしてみました。
図
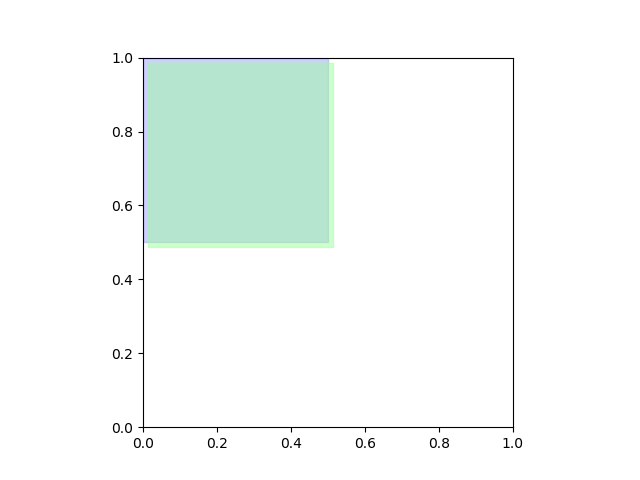
IoU == 0.9
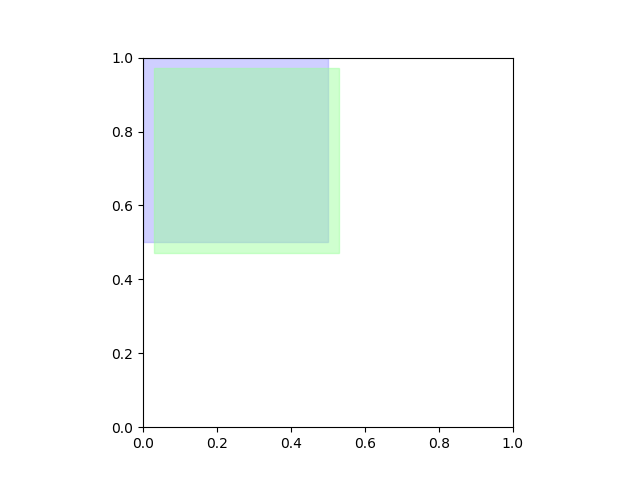
IoU == 0.8
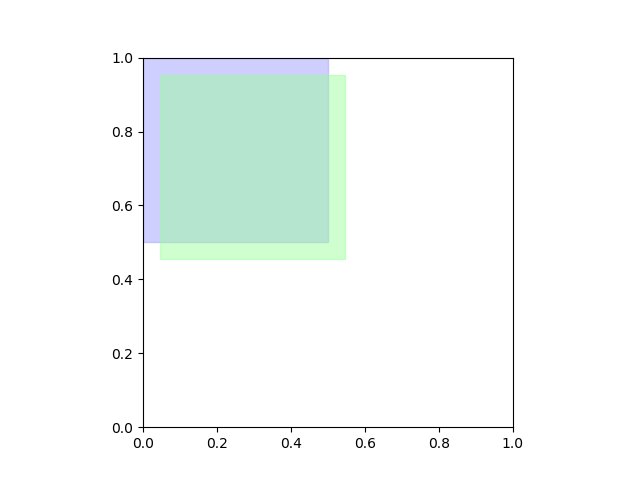
IoU == 0.7
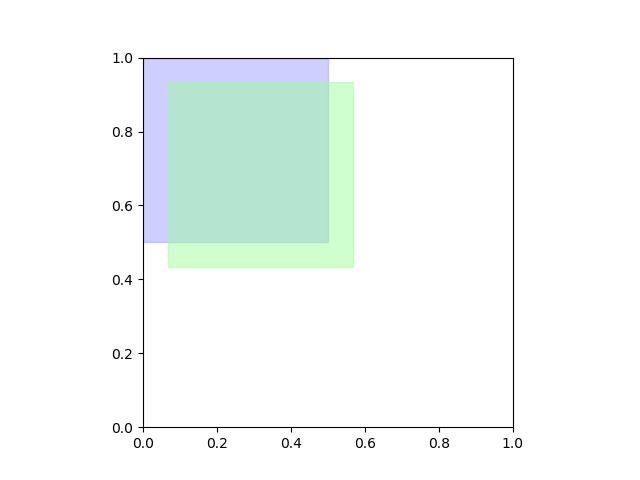
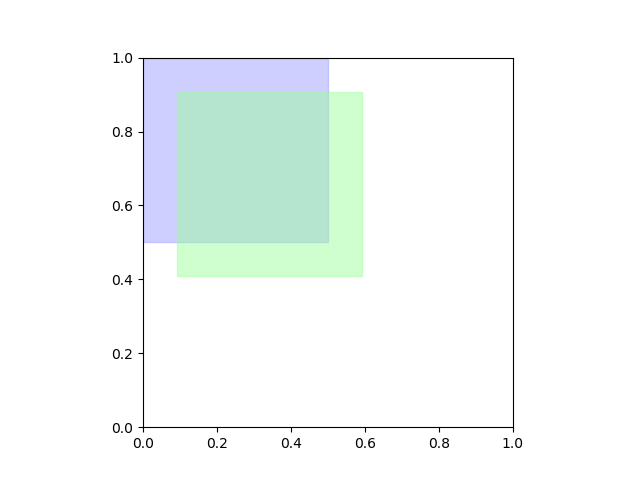
IoU == 0.6
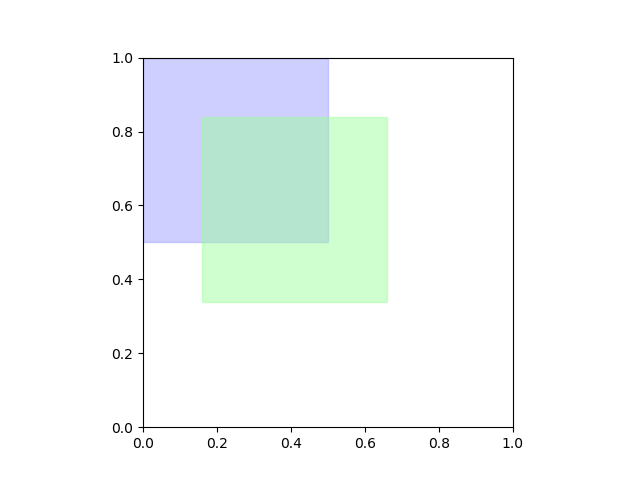
IoU == 0.5
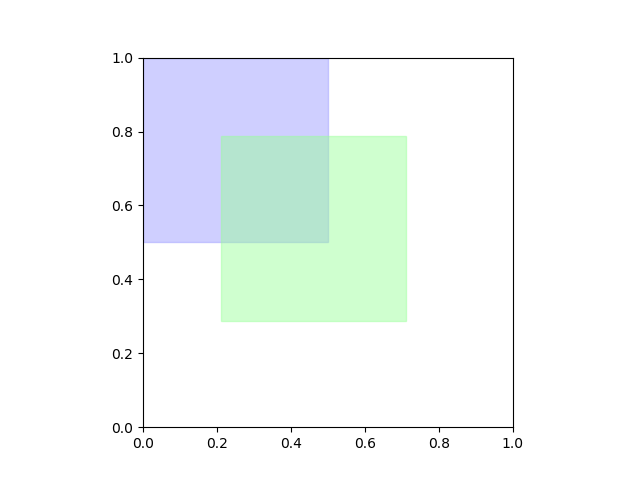
IoU == 0.4

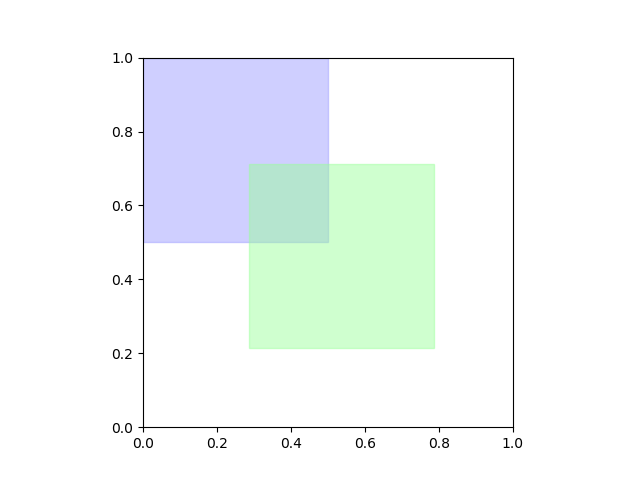
IoU == 0.3
IoU == 0.2
IoU == 0.1
コード
plot_iou.py
import matplotlib
import matplotlib.pyplot as plt

import numpy as np

for i, iou in enumerate(np.linspace(1, 0, 11)):
    #   ↓t
    # □□□
    # □□□
    # □□■□□
    #   □□□
    #   □□□

    # inter = (1 - t) ** 2
    # union = 2 - inter
    # iou = inter / union
    # https://www.wolframalpha.com/input/?dataset=&i=Solve%5Bu+%3D%3D+(1+-+t)%5E2+%2F+(2+-+(1+-+t)%5E2)+%26%26+0+<%3D+t+%26%26+t+<%3D+1+%26%26+0+<%3D+u+%26%26+u+<%3D+1,+t%5D
    # → t = 1 - sqrt(2) sqrt(u/(1 + u))
    t = 1 - np.sqrt(2 * iou / (1 + iou))
    print(f'#{i} iou={iou:.2f}, offset={t:.2f}')

    fig = plt.figure()
    ax = plt.axes()
    ax.add_patch(matplotlib.patches.Rectangle(xy=(0 / 2, 0.5 + 0 / 2), width=0.5, height=0.5, color='#9999ff77'))
    ax.add_patch(matplotlib.patches.Rectangle(xy=(t / 2, 0.5 - t / 2), width=0.5, height=0.5, color='#99ff9977'))
    ax.set_aspect('equal')
    plt.savefig(f'#{i} iou={iou:.2f}, offset={t:.2f}.png')
    plt.close()