


Serverless Framework を利用して AWS Lambda を雰囲気で使ってきましたが、初歩的な仕組みを理解できていませんでした…。
誤解していたこと
コンテナは使い回してもランタイムプロセス(?)は使い回さない(キリッ
今の認識
コンテナを使い回してランタイムプロセスも使い回す(キリッ
注) 正確(厳密)ではありません。イメージです。
- AWS Lambda 関数をデプロイ
- AWS Lambda 関数をリクエスト
- 初回のためコンテナを作成(コールドスタート)
- コンテナ上でランタイムプロセスが生成される
- ランタイムプロセスが関数を実行し結果を返す
- ランタイムプロセスは次のリクエストを待つ ← ここ、終了するものだと思っていた。
- 時間を空けずに AWS Lambda 関数をリクエスト
- 前回作成したコンテナが使えるので使い回す
- コンテナではランタイムプロセスが待機中 ← ここ、毎回生成されるものだと思っていた。
- ランタイムプロセスが関数を実行し結果を返す
- ランタイムプロセスは次のリクエストを待つ ← ここ、終了するものだと思っていた。
※ あと、コールドスタートにかかった時間は、 REPORT のログに記録されている Billed Duration には含まれていない、という点も正しく理解できていなかった。
確認
以下のハンドラファイルをデプロイして、ランタイムプロセスが生き続ける事を確認する。
print("Handler file loaded.")

import os
import subprocess

counter = 0

def hello(event, context):
    global counter
    counter += 1

    print("$ uptime")
    print(subprocess.check_output(["uptime"]).decode('UTF-8').rstrip())

    print(f"$ ps u {os.getpid()}")
    print(subprocess.check_output(["ps", "u", str(os.getpid())]).decode('UTF-8').rstrip())

    return {"counter": counter}
適当に、1分間隔で関数を呼び出していく。
-
uptimeでシステムの稼働時間を確認する -
psでランタイムプロセスの開始時間を確認する - グローバル変数で同一プロセスであることを確認する
$ seq 1 10 | xargs -n1 -I% bash -c '{ sls invoke -f hello -l ; sleep 60; }'
{
    "counter": 1
}
--------------------------------------------------------------------
START RequestId: 4f67b37f-c60d-11e7-bf2a-df09c904a01a Version: $LATEST
$ uptime
 11:50:13 up  1:29,  0 users,  load average: 0.03, 0.01, 0.00
$ ps u 1
USER       PID %CPU %MEM    VSZ   RSS TTY      STAT START   TIME COMMAND
478          1 12.0  0.4 170480 19184 ?        Ss   11:50   0:00 /var/lang/bin/python3.6 /var/runtime/awslambda/bootstrap.py
END RequestId: 4f67b37f-c60d-11e7-bf2a-df09c904a01a
REPORT RequestId: 4f67b37f-c60d-11e7-bf2a-df09c904a01a  Duration: 49.17 ms      Billed Duration: 100 ms         Memory Size: 128 MB     Max Memory Used: 22 MB


{
    "counter": 2
}
--------------------------------------------------------------------
START RequestId: 74d1a410-c60d-11e7-8dcf-39cccc39d67a Version: $LATEST
$ uptime
 11:51:15 up  1:30,  0 users,  load average: 0.01, 0.00, 0.00
$ ps u 1
USER       PID %CPU %MEM    VSZ   RSS TTY      STAT START   TIME COMMAND
478          1  0.1  0.4 170480 19192 ?        Rs   11:50   0:00 /var/lang/bin/python3.6 /var/runtime/awslambda/bootstrap.py
END RequestId: 74d1a410-c60d-11e7-8dcf-39cccc39d67a
REPORT RequestId: 74d1a410-c60d-11e7-8dcf-39cccc39d67a  Duration: 179.24 ms     Billed Duration: 200 ms         Memory Size: 128 MB     Max Memory Used: 22 MB


{
    "counter": 3
}
--------------------------------------------------------------------
START RequestId: 99fa6e49-c60d-11e7-a48c-c30a58fa8fe6 Version: $LATEST
$ uptime
 11:52:17 up  1:31,  0 users,  load average: 0.00, 0.00, 0.00
$ ps u 1
USER       PID %CPU %MEM    VSZ   RSS TTY      STAT START   TIME COMMAND
478          1  0.0  0.4 170480 19192 ?        Ss   11:50   0:00 /var/lang/bin/python3.6 /var/runtime/awslambda/bootstrap.py
END RequestId: 99fa6e49-c60d-11e7-a48c-c30a58fa8fe6
REPORT RequestId: 99fa6e49-c60d-11e7-a48c-c30a58fa8fe6  Duration: 221.70 ms     Billed Duration: 300 ms         Memory Size: 128 MB     Max Memory Used: 23 MB


{
    "counter": 4
}
--------------------------------------------------------------------
START RequestId: beea7400-c60d-11e7-8613-f14355ee452d Version: $LATEST
$ uptime
 11:53:19 up  1:32,  0 users,  load average: 0.00, 0.00, 0.00
$ ps u 1
USER       PID %CPU %MEM    VSZ   RSS TTY      STAT START   TIME COMMAND
478          1  0.0  0.4 170480 19192 ?        Ss   11:50   0:00 /var/lang/bin/python3.6 /var/runtime/awslambda/bootstrap.py
END RequestId: beea7400-c60d-11e7-8613-f14355ee452d
REPORT RequestId: beea7400-c60d-11e7-8613-f14355ee452d  Duration: 218.70 ms     Billed Duration: 300 ms         Memory Size: 128 MB     Max Memory Used: 23 MB


{
    "counter": 5
}
--------------------------------------------------------------------
START RequestId: e3d7e1d3-c60d-11e7-a7b2-dd75a5557d07 Version: $LATEST
$ uptime
 11:54:21 up  1:33,  0 users,  load average: 0.00, 0.00, 0.00
$ ps u 1
USER       PID %CPU %MEM    VSZ   RSS TTY      STAT START   TIME COMMAND
478          1  0.0  0.4 170480 19192 ?        Ss   11:50   0:00 /var/lang/bin/python3.6 /var/runtime/awslambda/bootstrap.py
END RequestId: e3d7e1d3-c60d-11e7-a7b2-dd75a5557d07
REPORT RequestId: e3d7e1d3-c60d-11e7-a7b2-dd75a5557d07  Duration: 212.90 ms     Billed Duration: 300 ms         Memory Size: 128 MB     Max Memory Used: 23 MB


{
    "counter": 6
}
--------------------------------------------------------------------
START RequestId: 090280cf-c60e-11e7-908b-fb62b83e79bf Version: $LATEST
$ uptime
 11:55:24 up  1:34,  0 users,  load average: 0.00, 0.00, 0.00
$ ps u 1
USER       PID %CPU %MEM    VSZ   RSS TTY      STAT START   TIME COMMAND
478          1  0.0  0.4 170480 19192 ?        Ss   11:50   0:00 /var/lang/bin/python3.6 /var/runtime/awslambda/bootstrap.py
END RequestId: 090280cf-c60e-11e7-908b-fb62b83e79bf
REPORT RequestId: 090280cf-c60e-11e7-908b-fb62b83e79bf  Duration: 198.22 ms     Billed Duration: 200 ms         Memory Size: 128 MB     Max Memory Used: 23 MB


{
    "counter": 7
}
--------------------------------------------------------------------
START RequestId: 2de7fefe-c60e-11e7-b46e-117670d5c3cc Version: $LATEST
$ uptime
 11:56:26 up  1:35,  0 users,  load average: 0.00, 0.00, 0.00
$ ps u 1
USER       PID %CPU %MEM    VSZ   RSS TTY      STAT START   TIME COMMAND
478          1  0.0  0.4 170480 19192 ?        Ss   11:50   0:00 /var/lang/bin/python3.6 /var/runtime/awslambda/bootstrap.py
END RequestId: 2de7fefe-c60e-11e7-b46e-117670d5c3cc
REPORT RequestId: 2de7fefe-c60e-11e7-b46e-117670d5c3cc  Duration: 232.23 ms     Billed Duration: 300 ms         Memory Size: 128 MB     Max Memory Used: 23 MB


{
    "counter": 8
}
--------------------------------------------------------------------
START RequestId: 532b2e07-c60e-11e7-908b-fb62b83e79bf Version: $LATEST
$ uptime
 11:57:28 up  1:36,  0 users,  load average: 0.00, 0.00, 0.00
$ ps u 1
USER       PID %CPU %MEM    VSZ   RSS TTY      STAT START   TIME COMMAND
478          1  0.0  0.4 170480 19192 ?        Ss   11:50   0:00 /var/lang/bin/python3.6 /var/runtime/awslambda/bootstrap.py
END RequestId: 532b2e07-c60e-11e7-908b-fb62b83e79bf
REPORT RequestId: 532b2e07-c60e-11e7-908b-fb62b83e79bf  Duration: 201.68 ms     Billed Duration: 300 ms         Memory Size: 128 MB     Max Memory Used: 23 MB


{
    "counter": 9
}
--------------------------------------------------------------------
START RequestId: 78025558-c60e-11e7-8c38-ade05bfd80af Version: $LATEST
$ uptime
 11:58:30 up  1:37,  0 users,  load average: 0.00, 0.00, 0.00
$ ps u 1
USER       PID %CPU %MEM    VSZ   RSS TTY      STAT START   TIME COMMAND
478          1  0.0  0.4 170480 19192 ?        Ss   11:50   0:00 /var/lang/bin/python3.6 /var/runtime/awslambda/bootstrap.py
END RequestId: 78025558-c60e-11e7-8c38-ade05bfd80af
REPORT RequestId: 78025558-c60e-11e7-8c38-ade05bfd80af  Duration: 185.42 ms     Billed Duration: 200 ms         Memory Size: 128 MB     Max Memory Used: 23 MB


{
    "counter": 10
}
--------------------------------------------------------------------
START RequestId: 9d0e47dd-c60e-11e7-bb2e-9b3c16936470 Version: $LATEST
$ uptime
 11:59:32 up  1:38,  0 users,  load average: 0.00, 0.00, 0.00
$ ps u 1
USER       PID %CPU %MEM    VSZ   RSS TTY      STAT START   TIME COMMAND
478          1  0.0  0.4 170480 19192 ?        Ss   11:50   0:00 /var/lang/bin/python3.6 /var/runtime/awslambda/bootstrap.py
END RequestId: 9d0e47dd-c60e-11e7-bb2e-9b3c16936470
REPORT RequestId: 9d0e47dd-c60e-11e7-bb2e-9b3c16936470  Duration: 172.61 ms     Billed Duration: 200 ms         Memory Size: 128 MB     Max Memory Used: 23 MB
1行目の print("Handler file loaded.") の結果は sls invoke コマンドの出力では見られないが、 CloudWatch Logs の方には記録されている。
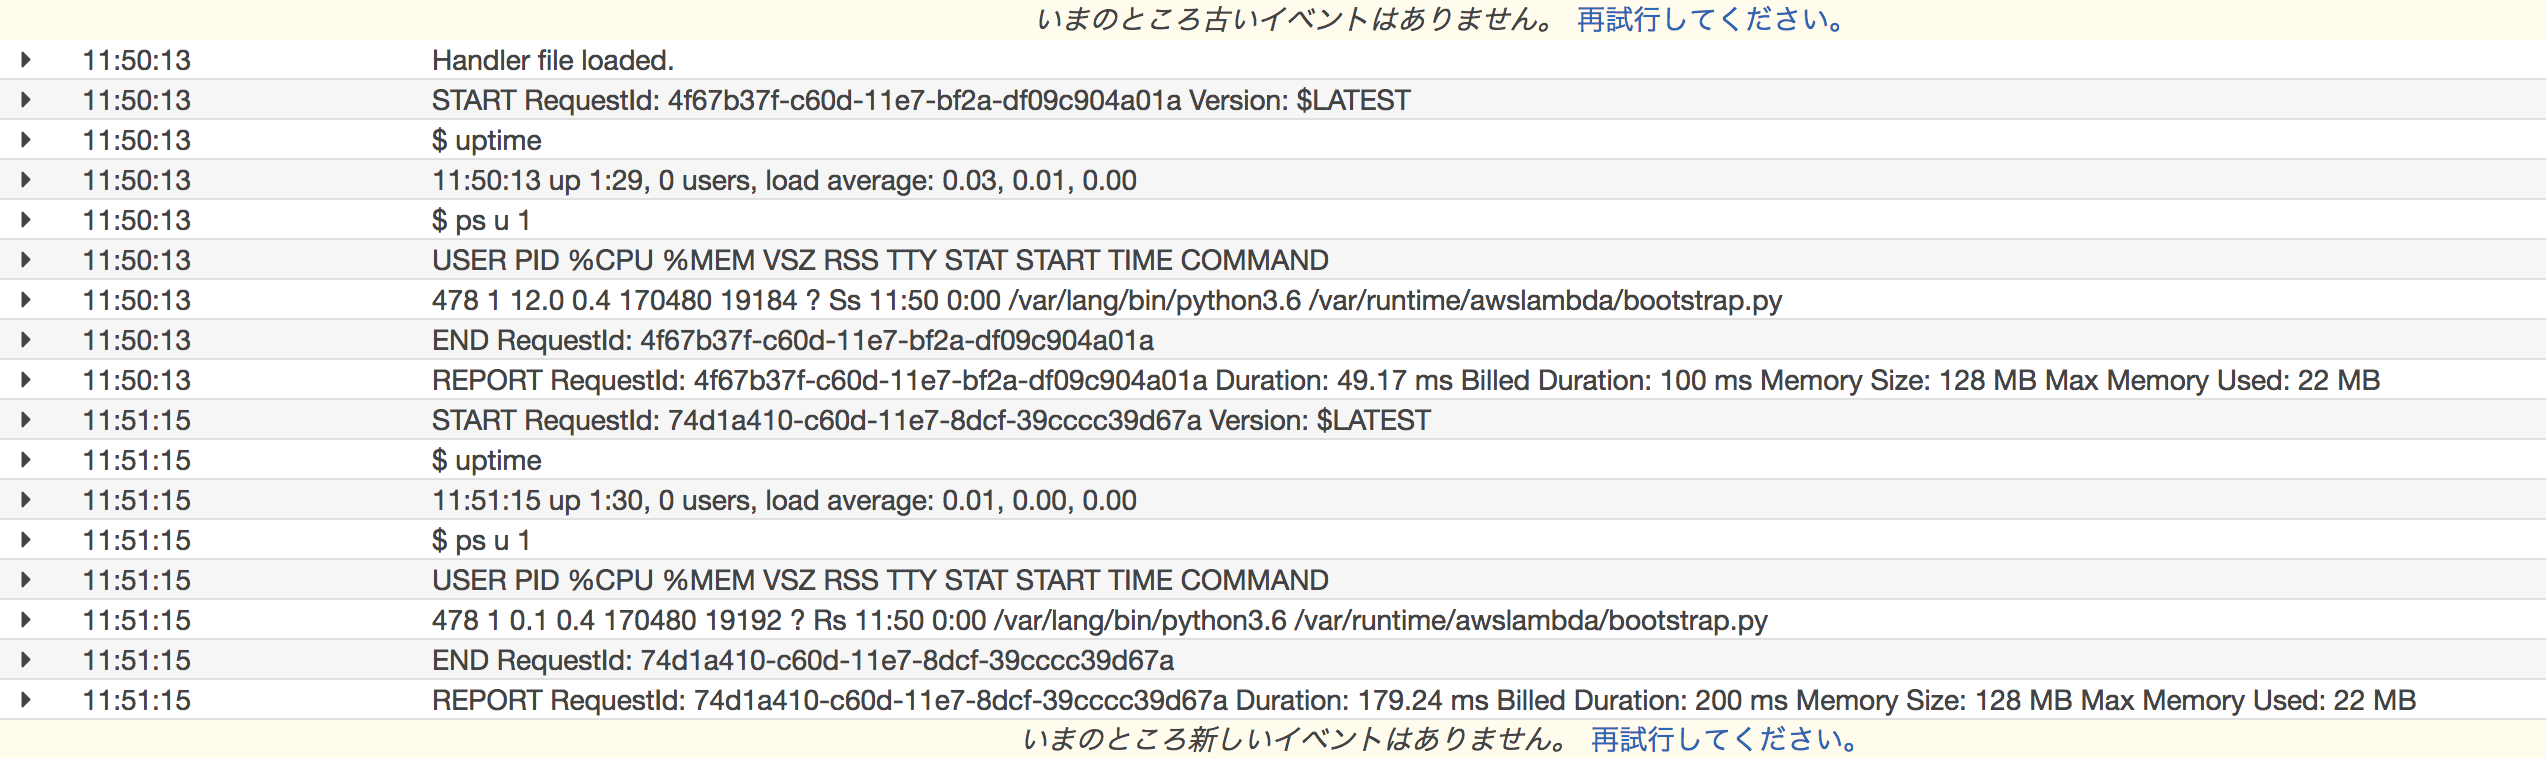
初回リクエストのランタイムプロセスが生成され、ハンドラモジュールがロードされたタイミングで評価される。そのため、二回目以降は評価されていない。
