When it comes to race and IQ debate, a popular theory proposed as an explanation of the persistent black-white IQ gap (of 1 SD, or 15 IQ points) is the so-called stereotype threat (ST). Briefly, ST creates anxiety among individuals who belong to the negatively stereotyped group. Supposedly, after confirming a negative stereotype as a self-characterization, the performance of this group (e.g., ethnic minorities, women…) on IQ tests will be artificially reduced.
A widely cited paper is from Steele and Aronson (1995). A fatal flaw that has gone unnoticed by the media is that the authors have found no difference between whites and blacks on the “no-threat condition” simply because the prior SAT scores were adjusted. As Sackett et al. (2004, p. 9) noted :
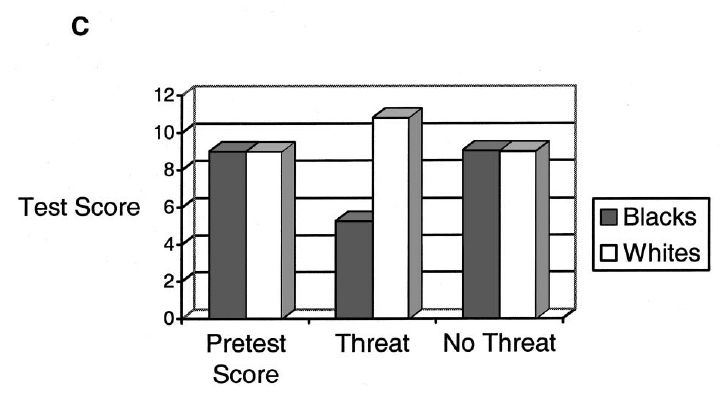
Figure 1C can be interpreted as follows: “In the sample studied, there are no differences between groups in prior SAT scores, as a result of the statistical adjustment. Creating stereotype threat produces a difference in scores; eliminating threat returns to the baseline condition of no difference.” This casts the work in a very different light: Rather than suggesting stereotype threat as the explanation for SAT differences, it suggests that the threat manipulation creates an effect independent of SAT differences.
Thus, rather than showing that eliminating threat eliminates the large score gap on standardized tests, the research actually shows something very different. Specifically, absent stereotype threat, the African American–White difference is just what one would expect based on the African American–White difference in SAT scores, whereas in the presence of stereotype threat, the difference is larger than would be expected based on the difference in SAT scores.
Suppose an examiner was telling them that the test does not matter. How hard will they try ? This is exactly the same problem arisen from Duckworth’s flawed study (2011) on motivation. When test-takers are told that they will earn more money by doing well on the test, they will obviously put much more effort than what they would have done otherwise even though their real abilities remain unchanged. This does not mean that women and ethnic minorities are anxious all the time or that their performance in school and job are constantly depressed over the course of their lifetime. The score differences arisen from stereotype threat experiments are situation-specific. It is irrelevant to g. This is what we would expect if ST is just driving the level of anxiety. Consider Jensen’s words (1998, pp. 514-515) here :
In fact, the phenomenon of stereotype threat can be explained in terms of a more general construct, test anxiety, which has been studied since the early days of psychometrics. [111a] Test anxiety tends to lower performance levels on tests in proportion to the degree of complexity and the amount of mental effort they require of the subject. The relatively greater effect of test anxiety in the black samples, who had somewhat lower SAT scores, than the white subjects in the Stanford experiments constitutes an example of the Yerkes-Dodson law. [111b] It describes the empirically observed nonlinear relationship between three variables: (1) anxiety (or drive) level, (2) task (or test) complexity and difficulty, and (3) level of test performance. According to the Yerkes-Dodson law, the maximal test performance occurs at decreasing levels of anxiety as the perceived complexity or difficulty level of the test increases (see Figure 12.14). If, for example, two groups, A and B, have the same level of test anxiety, but group A is higher than group B in the ability measured by the test (so group B finds the test more complex and difficult than does group A), then group B would perform less well than group A. The results of the Stanford studies, therefore, can be explained in terms of the Yerkes-Dodson law, without any need to postulate a racial group difference in susceptibility to stereotype threat or even a difference in the level of test anxiety. The outcome predicted by the Yerkes-Dodson law has been empirically demonstrated in large groups of college students who were either relatively high or relatively low in measured cognitive ability; increased levels of anxiety adversely affected the intelligence test performance of low-ability students (for whom the test was frustratingly difficult) but improved the level of performance of high-ability students (who experienced less difficulty). [111c]
This more general formulation of the stereotype threat hypothesis in terms of the Yerkes-Dodson law suggests other experiments for studying the phenomenon by experimentally manipulating the level of test difficulty and by equating the tests’ difficulty levels for the white and black groups by matching items for percent passing the item within each group. Groups of blacks and whites should also be matched on true-scores derived from g-loaded tests, since equating the groups statistically by means of linear covariance analysis (as was used in the Stanford studies) does not adequately take account of the nonlinear relationship between anxiety and test performance as a function of difficulty level.
What’s more, the ST theory tells us nothing about the direction of causality. ST researchers, like Steele and Aronson, are just assuming that ST depresses IQs among blacks. A question often neglected is how these negative stereotypes get started in the first place. These stereotypes have likely emerged after decades and decades of poor black performance at school and on job. Stereotypes, in general, have a base logic because they do not emerge without a chain of causality. There is no magic force behind it, generally. See Jussim et al. (2009).
A pernicious assumption is what Steele and Aronson (1995, p. 798) write here :
For African American students, the act of taking a test purported to measure intellectual ability may be enough to induce this threat. But we assume that this is most likely to happen when the test is also frustrating. It is frustration that makes the stereotype – as an allegation of inability – relevant to their performance and thus raises the possibility that they have an inability linked to their race. This is not to argue that the stereotype is necessarily believed; only that, in the face of frustration with the test, it becomes more plausible as a self-characterization and thereby more threatening to the self.
The last sentence is crystal clear. They interpret stereotype threat as an invisible force affecting ethnic minorities even when a member of a stereotyped group is not consciously aware of the threat. In other words, a magic spell, sorcery, witchcraft, evil spirit.
But how can ST theory explain the black-white IQ gap found in cognitive tests such as digit span or reaction time tasks ? To this matter, it is worth recalling Herrnstein and Murray’s discussion (1994, pp. 282-285) on the digit span and the reaction time task to understand why the pervasive effect of stereotype threat is hard to conceive :
The technical literature is again clear. In study after study of the leading tests, the hypothesis that the B/W difference is caused by questions with cultural content has been contradicted by the facts. [31] Items that the average white test taker finds easy relative to other items, the average black test taker does too; the same is true for items that the average white and black find difficult. … Here, we restrict ourselves to the conclusion: The B/W difference is wider on items that appear to be culturally neutral than on items that appear to be culturally loaded. […]
The first involves the digit span subtest, part of the widely used Wechsler intelligence tests. It has two forms: forward digit span, in which the subject tries to repeat a sequence of numbers in the order read to him, and backward digit span, in which the subject tries to repeat the sequence of numbers backward. The test is simple in concept, uses numbers that are familiar to everyone, and calls on no cultural information besides knowing numbers. The digit span is especially informative regarding test motivation not just because of the low cultural loading of the items but because the backward form is twice as g-loaded as the forward form, it is a much better measure of general intelligence. The reason is that reversing the numbers is mentally more demanding than repeating them in the heard order, as readers can determine for themselves by a little self-testing.
… Several psychometricians, led by Arthur Jensen, have been exploring the underlying nature of g by hypothesizing that neurologic processing speed is implicated, akin to the speed of the microprocessor in a computer. Smarter people process faster than less smart people. The strategy for testing the hypothesis is to give people extremely simple cognitive tasks – so simple that no conscious thought is involved – and to use precise timing methods to determine how fast different people perform these simple tasks. One commonly used apparatus involves a console with a semicircle of eight lights, each with a button next to it. In the middle of the console is the “home” button. At the beginning of each trial, the subject is depressing the home button with his finger. One of the lights in the semicircle goes on. The subject moves his finger to the button closest to the light, which turns it off. There are more complicated versions of the task … but none requires much thought, and everybody gets every trial “right.” The subject’s response speed is broken into two measurements: reaction time (RT), the time it takes the subject to lift his finger from the home button after a target light goes on, and movement time (MT), the time it takes to move the finger from just above the home button to the target button. [36]
… The consistent result of many studies is that white reaction time is faster than black reaction time, but black movement time is faster than white movement time. [39] One can imagine an unmotivated subject who thinks the reaction time test is a waste of time and does not try very hard. But the level of motivation, whatever it may be, seems likely to be the same for the measures of RT and MT. The question arises: How can one be unmotivated to do well during one split-second of a test but apparently motivated during the next split-second?
Suppose our society is so steeped in the conditions that produce test bias that people in disadvantaged groups underscore their cognitive abilties on all the items on tests, thereby hiding the internal evidence of bias. At the same time and for the same reasons, they underperform in school and on the job in relation to their true abilities, thereby hiding the external evidence. In other words, the tests may be biased against disadvantaged groups, but the traces of bias are invisible because the bias permeates all areas of the group’s performance […]
… First, the comments about the digit span and reaction time results apply here as well. How can this uniform background bias suppress black reaction time but not the movement time? How can it suppress performance on backward digit span more than forward digit span? Second, the hypothesis implies that many of the performance yardsticks in the society at large are not only biased, they are all so similar in the degree to which they distort the truth – in every occupation, every type of educational institution, every achievement measure, every performance measure – that no differential distortion is picked up by the data. Is this plausible?
Of course, not. It is obviously inconceivable that anxiety would affect some tasks (e.g., reaction time) without affecting the others (e.g., movement time). The heterogeneity of its effect casts doubt on the pervasiveness of ST.
Now, to deal more directly with the studies on ST, a meta-analysis by Stoet and Geary (2012, pp. 96-99) shows that ST effect with regard to women in mathematics is very weak. A finding of particular interest if that previous studies are deeply flawed because the preexisting differences in math scores, the outcome of interest, have been adjusted, which would create confounds. Among the 20 studies (see Table 1) aimed to replicate the original study by Spencer et al. (1999), “Stereotype Threat and Women’s Math Performance”, 11 succeeded in replicating the result, but for 8 of them the scores were adjusted for previous math scores. Only 3 of the 20 studies did replicate the study without adjusting for the previous scores.
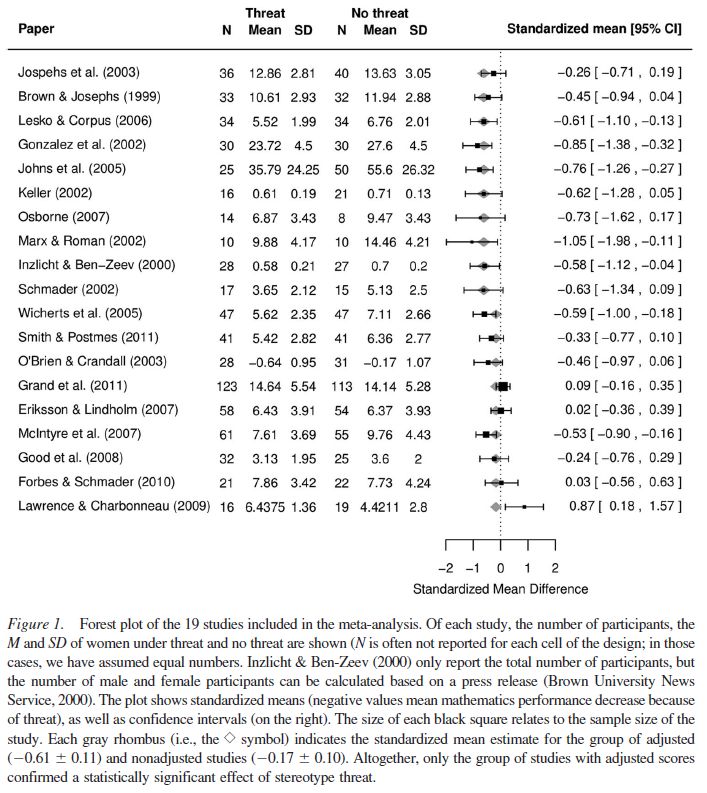
We calculated the model estimates using a random effects model (k = 19) with a restricted likelihood function (Viechtbauer, 2010). We found that for the adjusted data sets, there was a significant effect of stereotype threat on women’s mathematics performance (estimated mean effect size ± 1 SEM; -0.61 ± 0.11, p < .001), but this was not the case for the unadjusted data sets (-0.17 ± 0.10, p = .09). In other words, the moderator variable “adjustment” played a role; the residual heterogeneity after including the moderator variable equals τ² = 0.038 (±0.035), Qresidual (17) = 28.058, p = .04, Qmoderator (2) = 32.479, p < .001 (compared to τ² = 0.075 (±0.047), Q(18) = 43.095, p < .001 without a moderator), which means that 49% of the residual heterogeneity can be explained by including this moderator.
Mischaracterization of the Role of Stereotype Threat in the Gender Gap in Mathematics Performance
The available evidence suggests some women’s performance on mathematics tests can sometimes be negatively influenced by an implicit or explicit questioning of their mathematical competence, but the effect is not as robust as many seem to assume. This is in and of itself not a scientific problem, it simply means that we do not yet fully understand the intrapersonal (e.g., degree of identification with mathematics) and social mechanisms that produce the gender by threat interactions when they are found.
The issue is whether there has been a rush to judgment. It is possible that academic researchers understand that the phenomenon is unstable, with much left to be discovered, and it is reporters and other members of the popular press who have overinterpreted the scientific literature, and as a result mischaracterized the phenomenon as a well established cause of the gender differences in mathematics performance. No doubt this is indeed the case for many researchers but in many other cases there is undo optimism about the stability and generalizability of this phenomenon. An example of this idea can be found in a recent publication by Grand, Ryan, Schmitt, and Hmurovic (2011), which did not replicate the stereotype threat effect on women’s mathematics performance and downplayed the importance of replication as follows: “However, Nguyen and Ryan (2008) emphasized that the important question for future research in addressing this issue is not whether the results of the theory can be replicated consistently, as meta-analytic evidence across multiple comparison groups have clearly demonstrated its robustnes (p. 22).” We do not share this enthusiasm, given the just described failures to replicate the original effect unambiguously. […]
We think there are two possible reasons for the misrepresentation of the strength and robustness of the effect. On the one hand, we assume that there has simply been a cascading effect of researchers citing each other, rather than themselves critically reviewing evidence for the stereotype threat hypothesis. For example, if one influential author describes an effect as robust and stable, others might simply accept that as fact.
Another reason for the overenthusiastic support of the stereotype hypothesis is that many of the associated studies only assessed the presumably stigmatized group rather than including a control group. For example, Wraga, Helt, Jacobs, and Sullivan (2008) aimed to dispel the idea that women’s underperformance in mathematics relative to men might be related to biological factors and did so using functional MRI (fMRI). Their study only included female participants and concludes that “By simply altering the context of a spatial reasoning task to create a more positive message, women’s performance accuracy can be increased substantially through greater neural efficiency.” Krendl, Richeson, Kelley, and Heatherton (2008) carried out another fMRI study of stereotype threat in women only and concluded that “The present study sheds light on the specific neural mechanisms affected by stereotype threat, thereby providing considerable promise for developing methods to forestall its unintended consequences.” The results of these studies are interesting and potentially important, but in the absence of a male control group it is difficult, if not logically impossible, to draw conclusions about gender differences in performance. [Note 7 : If we would accept that a study merely with female participants would reveal something unique about women, one could make the same argument for any other group category unique to all participants. The mistake of lacking a control group becomes clearer if one would conclude that a study with people who all wear cloths says something unique about people wearing clothes. We can only draw such conclusions by including a control group (i.e., men in studies that aim to draw conclusions about women in comparison to men, or naked people in studies that aims to draw conclusions about people wearing clothes).] Some of these studies do not explicitly state that their findings tell us something about women (in comparison to men), but the focus on the gender of the female participants when describing the data, and the discussions within these studies about social policy imply that is exactly what the authors mean. At the very least, we cannot expect that the general public would understand this distinction.
It seems likely that the strong conclusions of these latter studies again lead to other studies claiming that there is strong support for women being disadvantaged by social stereotyping. For example, Derks, Inzlicht, and Kang (2008) cite the Krendl et al. (2008) study and amplify the stereotype threat hypothesis as follows: “The incremental benefit of the fMRI work here is in the ability to test a behavioral theory at the biological level of action, the brain. This can serve as a springboard for further theory-testing investigations. The fact that these results converge with the behavioral work of others provides consistency across different levels of analysis and organization, an important step toward the broad understanding of any complex phenomenon (p. 169).” And Stewart, Latu, Kawakami, and Myers (2010) cite the Krendl et al. (2008) article to support the following statement: “In 2005, Harvard President Lawrence Summers publicly suggested that innate gender differences were probably the primary reason for women’s underrepresentation in math and science domains. His remarks caused a stir in academic and nonacademic communities and are at odds with considerable research suggesting that women’s underperformance in math and science is linked to situational factors (p. 221).” The problem here is that although the neuroscientific studies are interesting and important in and of themselves, they do not inform us about whether women are at a disadvantage in comparison to men on the tasks used in these studies. This is critical if we are to fully assess the stereotype threat explanation of the gender gap in mathematics performance.
Finally, we also felt that there were some potential problems with the presentation and interpretation of data. There was often an incomplete description of results (e.g., only figures with no reported Ms or SDs), alpha values were relaxed when it matched the hypothesis, and the analyses of different representations of the same data, such as number correct and percent correct. Granted, it can be reasonable to explore different dependent measures, but it was sometimes the case that significant or marginally significant effects (e.g., percentage correct) were reported in the text and nonsignificant effects (of the same data) in a footnote. Moreover, there was no consistency in the dependent measure of choice, except that the significant one was highlighted in the text and abstract and the nonsignificant one placed in a footnote.
The authors speculate about the possibility that unpublished data will more likely find null result. This is plausible, since the number of publications having “significant” effect size inceases over time. More worrisome is that Wicherts & de Haan (2009) have detected publication bias :
Numerous laboratory experiments have been conducted to show that African Americans’ cognitive test performance suffers under stereotype threat, i.e., the fear of confirming negative stereotypes concerning one’s group. A meta-analysis of 55 published and unpublished studies of this effect shows clear signs of publication bias. The effect varies widely across studies, and is generally small. Although elite university undergraduates may underperform on cognitive tests due to stereotype threat, this effect does not generalize to non-adapted standardized tests, high-stakes settings, and less academically gifted test-takers. Stereotype threat cannot explain the difference in mean cognitive test performance between African Americans and European Americans.
What publication bias denotes is that when a study fails to find a positive impact of stereotype threat, the study is not published. Simply. But why is this scandal so surprising when it comes to race debate ? Suspicions raised by Stoet were justified.
Another line of attack is provided by Gottfredson (2000, p. 139). She says that if stereotype threat represents a significant source of racial differences in IQ scores, then “one should find, among other things, that mental tests generally underestimate Blacks’ later performance in school and work, that test results are sensitive to race and the emotional supportiveness of the tester but not to the mental complexity of the task, and that racial gaps in test scores rise and fall with changes in the racial climate. Accumulated research, however, reveals quite the opposite (e.g., Jensen, 1980, 1998)”. A further evidence is provided by Sackett et al. (2008, pp. 222-223). It was a common belief that when equating for IQ scores, black people would have outperformed whites on, say, scholastic achievement or performance, thus evidencing black underprediction. The empirical evidence shows otherwise. Herrnstein & Murray (1994, Appendix 5, pp. 650-654) have an interesting discussion on this matter.
Predictive bias happens when a given predictor (e.g., IQ test) has differential intercept or regression slope with regard to a criterion variable (e.g., academic achievement, job performance). So, if stereotype is harmful to black people when they are taking an intelligence test, and that the subjects are aware about what the examiners are trying to measure (i.e., their intelligence), then the IQ test will be under-estimated for blacks. Insofar as the IQ is biased against blacks but the criterion is not, the necessary implication is that when blacks and whites are equated for IQ, the blacks will outperform the whites on the criterion. That is, blacks would do better on the outcome measures than the IQ measure would lead one to expect.
When IQ is biased against blacks, the intercept (the point at which the regression line crosses the vertical axis) should be greater for blacks. And if there is only intercept difference, the black slope should be higher than the white slope and no one will interact or cross each other, as depicted below.

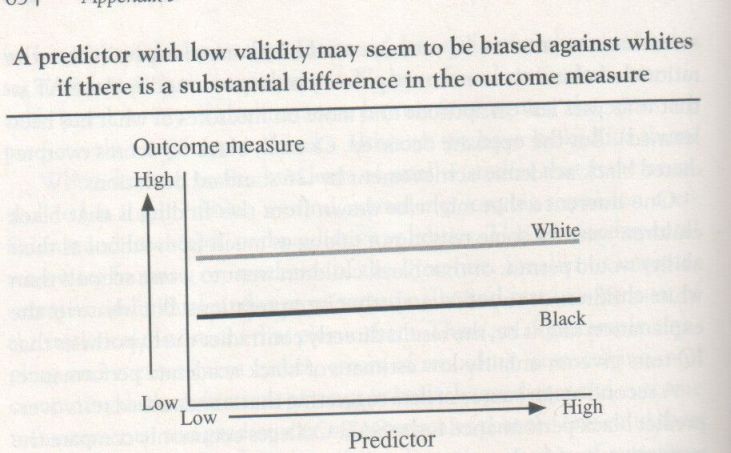
There is another kind of predictive bias, which happens in a situation of differential validity (slope). This can be accompanied (or not) by a difference in the intercept. If the slope is different so that blacks have a smaller coefficient, the picture will look like the graph below.

All three black lines have the same coefficient but they are smaller than the white line, which is why the white line is steeper. The consequence is that a low IQ, the whites may underperform blacks on the criterion (outcome), but they outperform blacks on the criterion as IQ goes up.
In general, when there is predictive bias, it is that blacks underperform whites on the criterion. In that situation, the IQ test is biased against whites, i.e., IQ overpredicts black performance on the criterion, whether achievement or job performance. Herrnstein & Murray write :
Insofar as the many individual studies show a pattern at all, it points to overprediction for blacks. More simply, this body of evidence suggests that IQ tests are biased in favor of blacks, not against them. The single most massive set of data bearing on this issue is the national sample of more than 645,000 school children conducted by sociologist James Coleman and his associates for their landmark examination of the American educational system in the mid-1960s. Coleman’s survey included a standardized test of verbal and nonverbal IQ, using the kinds of items that characterize the classic IQ test and are commonly thought to be culturally biased against blacks: picture vocabulary, sentence completion, analogies, and the like. The Coleman survey also included educational achievement measures of reading level and math level that are thought to be straightforward measures of what the student has learned. If IQ item are culturally biased against blacks, it could be predicted that a black student would do better on the achievement measures than the putative IQ measure would lead one to expect (this is the rationale behind the current popularity of steps to modify the SAT so that it focuses less on aptitude and more on measures of what has been learned). But the opposite occurred. Overall, black IQ scores overpredicted black academic achievement by .26 standard deviations. …
A second major source of data suggesting that standardized tests overpredict black performance is the SAT. Colleges commonly compare the performance of freshmen, measured by grade point average, against the expectations of their performance as predicted by SAT scores. A literature review of studies that broke down these data by ethnic group revealed that SAT scores overpredicted freshman grades for blacks in fourteen of fifteen studies, by a median of .20 standard deviation. In five additional studies where the ethnic classification was “minority” rather than specifically “black,” the SAT score overpredicted college performance in all five cases, by a median of .40 standard deviation.
For job performance, the most thorough analysis is provided by the Hartigan Report, assessing the relationship between the General Aptitude Test Battery (GATB) and job performance measures. Out of seventy-two studies that were assembled for review, the white intercept was higher than the black intercept in sixty of them – that is, the GATB overpredicted black performance in sixty out of the seventy-two studies. Of the twenty studies in which the intercepts were statistically significantly different (at the .01 level), the white intercept was greater than the black intercept in all twenty cases.
However, overprediction can be a misleading term when the predictor is not correlated with the criterion and that blacks and whites differ on that criterion. This scenario is illustrated below.
The intercepts are different but the slopes are both flat. In other words, there are missing predictors that can make the intercept difference to disappear if they were included. In general, IQ test alone is not sufficient to explain the black-white difference in outcome measures. In light of this, Herrnstein & Murray argue that IQ tests are more often biased (in a predictive sense) against whites.
The absence of underprediction does not imply the absence of measurement bias, however (Wicherts and Millsap, 2009), because it tells us nothing about the probabilities of a particular group to obtain a given score. Indeed, measurement bias is revealed when two persons with the same latent abilities have different probabilities of attaining the same score on the test. Therefore, an observed score is considered measurement invariant (MI) when the observed score does not depend on the person’s group membership after being equated on latent ability score. To this matter, Wicherts et al. (2005) use the Multigroup Confirmatory Factor Analysis (MGCFA) to test the above assumption. Measurement invariance does not hold with regard to ST experiments.
It is interesting to note that they have critized the use of ANCOVA when controlling for prior test scores (like Steele and Aronson did), on the grounds that “stereotype threat may lower the regression weight of the dependent variable on the covariate in the stereotype threat condition, which violates regression weight homogeneity over all experimental cells” (p. 698). There is no reason to suppose, they say, that ST effect is homogeneous : “Higher SAT scores would imply higher domain identification and therefore stronger ST effects” (Wicherts, 2005).
Invrariance can be expressed as follows :
f (Y| η, v) = f (Y| η)
Y is the observed score on a given subtest, η is latent factor score, v is group membership. Invariance holds if group membership does not make any contribution to observed subtest scores above what is accounted for by latent scores. Otherwise, it is said that the unidimensionality of the subtest is violated.
The first study analyzed involves comparison on three DAT subtests between ethnic minority (n=138) and majority (n=157) dutch students. Table 3 shows that factor loading invariance (step 2) was rejected. The misfit was entirely due to Numerical Ability (NA) subtest. When this parameter is freed, the model fits well and not worse than the baseline model. Setting residual variances to be equal across groups largely decreases the model fit. Modification indices show that it is again due to NA subtest. When residuals of NA is allow to differ across groups, the model fit better but still largely worse than the baseline.

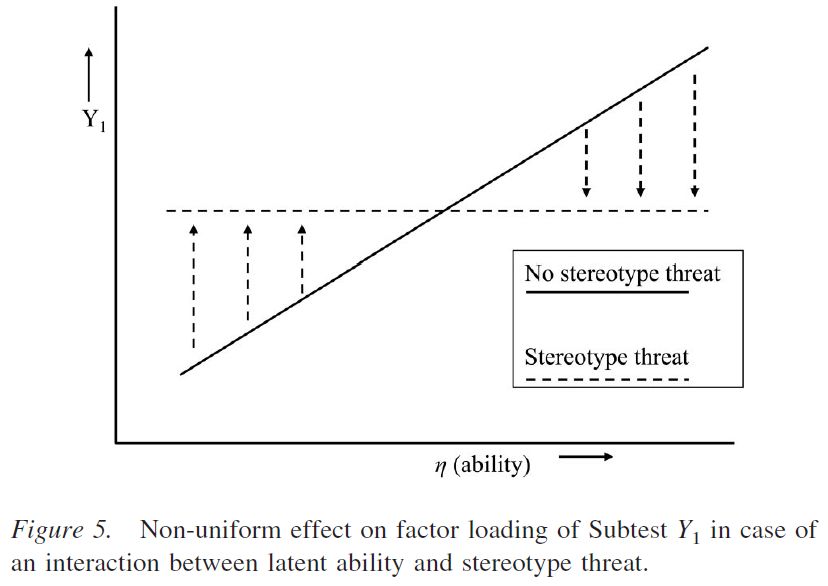
When factor loading invariance is not tenable, the importance of a given subtest to the latent factor score differ across groups. Wicherts et al. (2005, pp. 703-705) suspect ST effects to differ according to the ability of the individuals.
The measurement bias due to stereotype threat was related to the most difficult NA subtest. An interesting finding is that, because of stereotype threat, the factor loading of this subtest did not deviate significantly from zero. This change in factor loading suggests a non-uniform effect of stereotype threat. This is consistent with the third scenario discussed above (cf. Appendix B) and with the idea that stereotype threat effects are positively associated with latent ability (cf. Cullen et al., 2004). Such a scenario could occur if latent ability and domain identification are positively associated. This differential effect may have led low-ability (i.e., moderately identified) minority students to perform slightly better under stereotype threat (cf. Aronson et al., 1999), perhaps because of moderate arousal levels, whereas the more able (i.e., highly identified) minority students performed worse under stereotype threat. Such a differential effect is displayed graphically in Figure 5.
In their discussion of the first study (on Dutch minority students) they have examined, Wicherts et al. write : “The intelligence factor explains approximately 0.1% of the variance in the NA subtest, as opposed to 30% in the other groups. To put it differently, because of stereotype threat, the NA test has become completely worthless as a measure of intelligence in the minority group”. In conclusion (p. 711), the authors consider stereotype threat as a source of measurement bias. Therefore, stereotype threat does not affect real (i.e., latent) abilities.
However, constructs such as intelligence and mathematic ability are stable characteristics, and stereotype threat effects are presumably shortlived effects, depending on factors such as test difficulty (e.g., O’Brien & Crandall, 2003; Spencer et al., 1999). Furthermore, stereotype threat effects are often highly task specific. For instance, Seibt and Förster (2004) found that stereotype threat leads to a more cautious and less risky test-taking style (i.e., prevention focus), the effects of which depend on whether a particular task is speeded or not, or whether a task demands creative or analytical thinking (cf. Quinn & Spencer, 2001). In light of such task specificity, we view stereotype threat effects as test artifacts, resulting in measurement bias.
Then, Rushton and Jensen (2005, pp. 249-250; 2010, pp. 16-17) reviewed several studies contradicting the stereotype theory. No factor X, that is, an environmental or cultural variable (racism, stereotype and the like) that specifically targets one ethnic group, has been found.
Another way of answering the question is to compare their psychometric factor structures of kinship patterns, background variables, and subtest correlations. If there are minority-specific developmental processes [i.e., stereotype threat, race stigma, white racism, history of slavery, lowered expectations, heightened stress, etc.] arising from cultural background differences between the races at work, they should be reflected in the correlations between the background variables and the outcome measures. Rowe (1994; Rowe, Vazsonyi, & Flannery, 1994, 1995) examined this hypothesis in a series of studies using structural equation models. One study of six data sources compared cross-sectional correlational matrices (about 10 x 10) for a total of 8,528 Whites, 3,392 Blacks, 1,766 Hispanics, and 906 Asians (Rowe et al., 1994). These matrices contained both independent variables (e.g., home environment, peer characteristics) and developmental outcomes (e.g., achievement, delinquency). A LISREL goodness-of-fit test found each ethnic group’s covariance matrix equal to the matrix of the other groups. Not only were the Black and White matrices nearly identical, but they were as alike as the covariance matrices computed from random halves within either group. There were no distortions in the correlations between the background variables and the outcome measures that suggested any minority-specific developmental factor.
Another study examined longitudinal data on academic achievement (Rowe et al., 1995). Again, any minority-specific cultural processes affecting achievement should have produced different covariance structures among ethnic and racial groups. Correlations were computed between academic achievement and family environment measures in 565 full-sibling pairs from the National Longitudinal Survey of Youth, each tested at ages 6.6 and 9.0 years (White N = 296 pairs; Black N = 149 pairs; Hispanic N = 120 pairs). Each racial group was treated separately, yielding three 8 x 8 correlation matrices, which included age as a variable. Because LISREL analysis showed the matrices were equal across the three groups, there was no evidence of any special minority-specific developmental process affecting either base rates in academic achievement or any changes therein over time.
The series of studies conducted by Rowe (1994, pp. 408-410; 1995, pp. 35-38) actually show that the hypothesis of unique causal process responsible for the lower achievement in one ethnic group but not in the others does not hold. The contrary would imply that the pattern of correlations (1) between environment and achievement, (2) between siblings, (3) between different ages, should be distinct for that particular group (e.g., africans). The absence of a factor X is a definitive rejection of the assumption underlying the ST theory. SEM analyses further demonstrate (Rowe & Cleveland, 1996) that the genetic and environmental factors causing variation within group were also causing variation between groups, thus meaning that the default hypothesis is confirmed. All factor loadings (genetic as well as shared environment) being fixed, the black-white mean differences keep track of the factor loadings, denoting identical etiologies.
That the usual B-W IQ difference appears to have the same cause is further supported by Dolan (2000), Dolan & Hamaker (2001), Lubke et al. (2003). The B-W difference was not due to differing levels of difficulty (across groups) at the subtest level while the equality of factor loadings also holds. They demonstrate that B-W difference does not arise from measurement bias, implying that the within-group difference and the between-group difference with regard to cognitive abilities have the same cause. Here’s Lubke’s enlightening discussion :
Suppose observed mean differences between groups are due to entirely different factors than those that account for the individual differences within a group. The notion of ‘‘different factors’’ as opposed to ‘‘same factors’’ implies that the relation of observed variables and underlying factors is different in the model for the means as compared with the model for the covariances, that is, the pattern of factor loadings is different for the two parts of the model. If the loadings were the same, the factors would have the same interpretation. In terms of the multigroup model, different loadings imply that the matrix Λ in Eq. (9) differs from the matrix Λ in Eq. (10) (or Eqs. (5) and (6)). However, this is not the case in the MI model. Mean differences are modeled with the same loadings as the covariances. Hence, this model is inconsistent with a situation in which between-group differences are due to entirely different factors than within-group differences. In practice, the MI model would not be expected to fit because the observed mean differences cannot be reproduced by the product of α and the matrix of loadings, which are used to model the observed covariances. Consider a variation of the widely cited thought experiment provided by Lewontin (1974), in which between-group differences are in fact due to entirely different factors than individual differences within a group. The experiment is set up as follows. Seeds that vary with respect to the genetic make-up responsible for plant growth are randomly divided into two parts. Hence, there are no mean differences with respect to the genetic quality between the two parts, but there are individual differences within each part. One part is then sown in soil of high quality, whereas the other seeds are grown under poor conditions. Differences in growth are measured with variables such as height, weight, etc. Differences between groups in these variables are due to soil quality, while within-group differences are due to differences in genes. If an MI model were fitted to data from such an experiment, it would be very likely rejected for the following reason. Consider between-group differences first. The outcome variables (e.g., height and weight of the plants, etc.) are related in a specific way to the soil quality, which causes the mean differences between the two parts. Say that soil quality is especially important for the height of the plant. In the model, this would correspond to a high factor loading. Now consider the within-group differences. The relation of the same outcome variables to an underlying genetic factor are very likely to be different. For instance, the genetic variation within each of the two parts may be especially pronounced with respect to weight-related genes, causing weight to be the observed variable that is most strongly related to the underlying factor. The point is that a soil quality factor would have different factor loadings than a genetic factor, which means that Eqs. (9) and (10) cannot hold simultaneously. The MI model would be rejected.
In the second scenario, the within-factors are a subset of the between-factors. For instance, a verbal test is taken in two groups from neighborhoods that differ with respect to SES. Suppose further that the observed mean differences are partially due to differences in SES. Within groups, SES does not play a role since each of the groups is homogeneous with respect to SES. Hence, in the model for the covariances, we have only a single factor, which is interpreted in terms of verbal ability. To explain the between-group differences, we would need two factors, verbal ability and SES. This is inconsistent with the MI model because, again, in that model the matrix of factor loadings has to be the same for the mean and the covariance model. This excludes a situation in which loadings are zero in the covariance model and nonzero in the mean model.
As a last example, consider the opposite case where the between-factors are a subset of the within-factors. For instance, an IQ test measuring three factors is administered in two groups and the groups differ only with respect to two of the factors. As mentioned above, this case is consistent with the MI model. The covariances within each group result in a three-factor model. As a consequence of fitting a three-factor model, the vector with factor means, α in Eq. (9), contains three elements. However, only two of the element corresponding to the factors with mean group differences are nonzero. The remaining element is zero. In practice, the hypothesis that an element of α is zero can be investigated by inspecting the associated standard error or by a likelihood ratio test (see below).
In summary, the MI model is a suitable tool to investigate whether within- and between-group differences are due to the same factors. The model is likely to be rejected if the two types of differences are due to entirely different factors or if there are additional factors affecting between-group differences. Testing the hypothesis that only some of the within factors explain all between differences is straightforward. Tenability of the MI model provides evidence that measurement bias is absent and that, consequently, within- and between-group differences are due to factors with the same conceptual interpretation.
To the extent that the black-white IQ difference does not violate MI, with ST violating MI, we are left with the conclusion that race differences in IQ arise from common factors, that is, have the same causes. Ad hoc theories are not needed. To quote Gottfredson (2004), “According to social privilege theory, there would be no racial inequality in a fair, non-discriminatory society. The continuing existence of racial inequality is therefore proof of continuing discrimination” (p. 37) with race denialism being a social construct. Egalitarian ideology is not needed.
References :
- Dolan Conor. V., 2000, Investigating Spearman’s hypothesis by means of multi-group confirmatory factor analysis.
- Dolan Conor V., and Hamaker Ellen L., 2001, Investigating black–white differences in psychometric IQ: Multi-group confirmatory factor analysis of the WISC-R and K-ABC and a critique of the method of correlated vectors.
- Duckworth Angela Lee, Quinn Patrick D., Lynam Donald R., Loeber Rolf, and Stouthamer-Loeber Magda, 2011, Role of test motivation in intelligence testing.
- Gottfredson Linda S., 2000, Skills Gaps, Not Tests, Make Racial Proportionality Impossible.
- Gottfredson Linda S., 2004, Social Consequences of Group Differences in Cognitive Ability.
- Grand James A., Ryan Ann Marie, Schmitt Neal, and Hmurovic Jillian, 2011, How Far Does Stereotype Threat Reach? The Potential Detriment of Face Validity in Cognitive Ability Testing.
- Herrnstein Richard J., and Murray Charles, 1994, The Bell Curve: Intelligence and Class Structure in American Life, With a New Afterword by Charles Murray.
- Jensen Arthur R., 1998, The g Factor: The Science of Mental Ability.
- Jussim Lee, Cain Thomas R., Crawford Jarret T., Harber Kent, Cohen Florette, 2009, The Unbearable Accuracy of Stereotypes.
- Lubke Gitta H., Dolan Conor V., Kelderman Henk, Mellenbergh Gideon J., 2003, On the relationship between sources of within- and between-group differences and measurement invariance in the common factor model.
- Nguyen Hannah-Hanh D., and Ryan Ann Marie, 2008, Does Stereotype Threat Affect Test Performance of Minorities and Women? A Meta-Analysis of Experimental Evidence.
- Rowe David C., Vazsonyi Alexander T., and Flannery Daniel J., 1994, No More Than Skin Deep: Ethnic and Racial Similarity in Developmental Process.
- Rowe David C., Vazsonyi Alexander T., and Flannery Daniel J., 1995, Ethnic and Racial Similarity in Developmental Process: A Study of Academic Achievement.
- Rowe David C., and Cleveland Hobard H., 1996, Academic Achievement in Blacks and Whites: Are the Developmental Processes Similar?.
- Rushton J. Philippe, and Jensen Arthur R., 2005, Thirty Years of Research on Race Differences in Cognitive Ability.
- Rushton J. Philippe, and Jensen Arthur R., 2010, Race and IQ: A Theory-Based Review of the Research in Richard Nisbett’s Intelligence and How to Get It.
- Sackett Paul R., Hardison Chaitra M., and Cullen Michael J., 2004, On Interpreting Stereotype Threat as Accounting for African American-White Differences on Cognitive Tests.
- Sackett Paul R., Borneman Matthew J., and Connelly Brian S., 2008, High-Stakes Testing in Higher Education and Employment.
- Steele Claude M., and Aronson Joshua, 1995, Stereotype Threat and the Intellectual Test Performance of African Americans.
- Steele Claude M., and Aronson Joshua, 1998, Stereotype Threat and the Test Performance of Academically Successful African Americans, pp. 401-426, in The Black-White Test Score Gap, by Jencks Christopher and Phillips Meredith (1998).
- Stoet Gijsbert, and Geary David C., 2012, Can Stereotype Threat Explain the Gender Gap in Mathematics Performance and Achievement?.
- Wicherts Jelte M., 2005, Stereotype Threat Research and the Assumptions Underlying Analysis of Covariance.
- Wicherts Jelte M., Dolan Conor V., and Hessen David J., 2005, Stereotype Threat and Group Differences in Test Performance: A Question of Measurement Invariance.
- Wicherts Jelte M., and Millsap Roger E., 2009, The Absence of Underprediction Does Not Imply the Absence of Measurement Bias.
- Wicherts Jelte M., and de Haan Cor, 2009, unpublished, Stereotype threat and the cognitive test performance of African Americans.