Swearing varies a lot from place to place, even within the same country, in the same language. But how do we know who swears what, where, in the big picture? We turn to data – damn big data. With great computing power comes great cartography.
Jack Grieve, lecturer in forensic linguistics at Aston University in Birmingham, UK, has created a detailed set of maps of the US showing strong regional patterns of swearing preferences. The maps are based on an 8.9-billion-word corpus of geo-coded tweets collected by Diansheng Guo in 2013–14 and funded by Digging into Data. Here’s fuck:

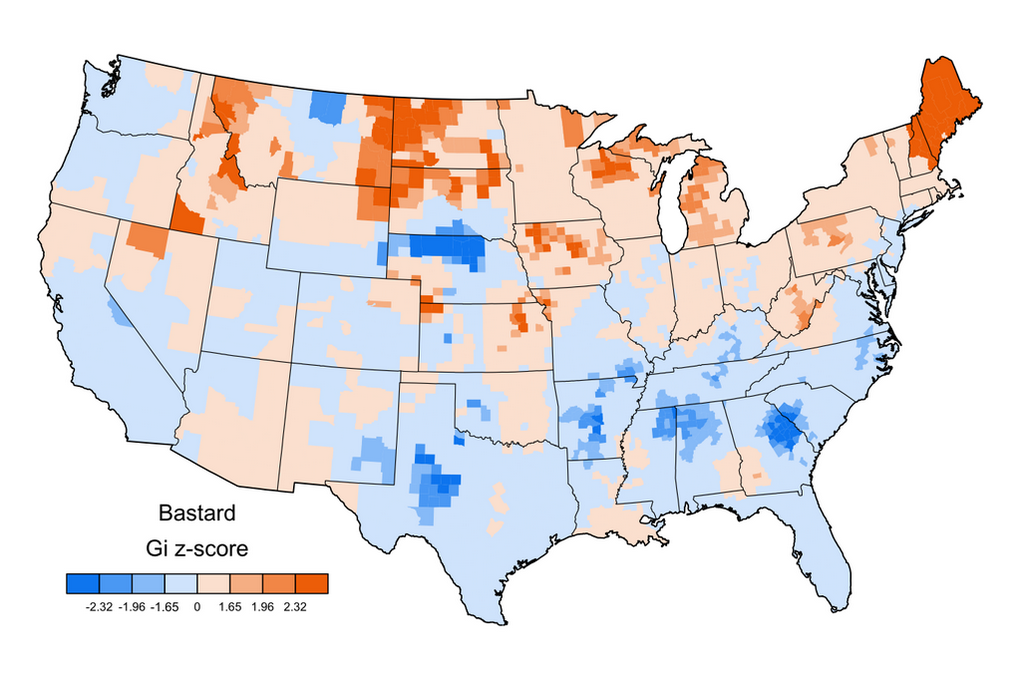
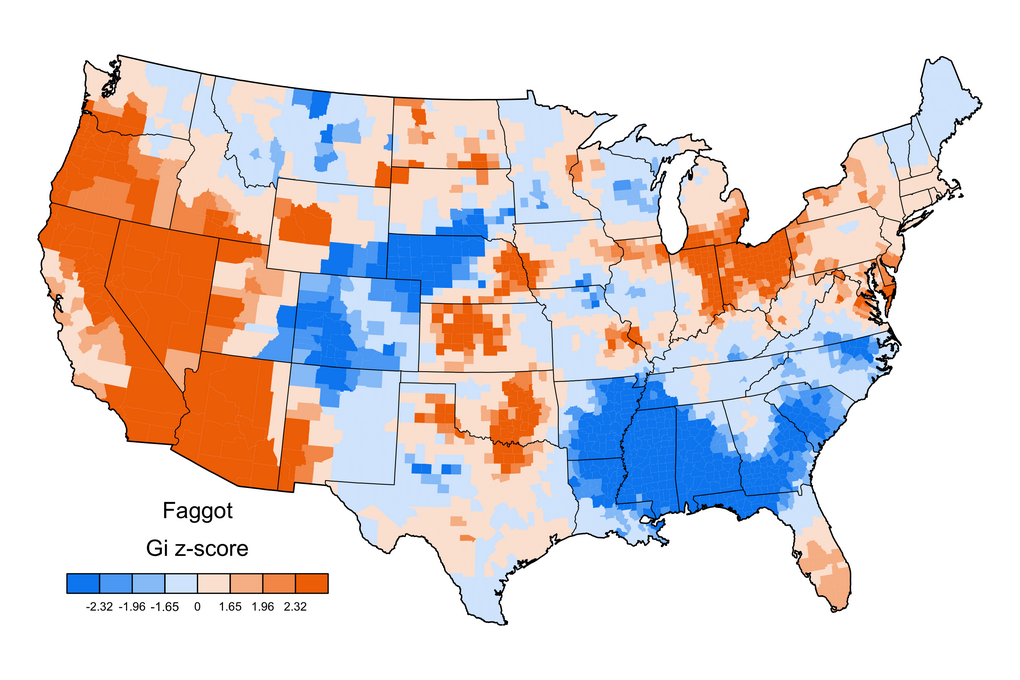
The red–blue scale shows relative frequency. The frequency of a word in the tweets from a given county is divided by the total number of words from that county (which correlates strongly with population density). The result is then smoothed using spatial autocorrelation analysis, with Getis-Ord z-scores mapped to identify clusters. Alaska and Hawaii are not included.
Polysemy – a word’s multiple meanings – has not been controlled in the graphs, so the hell map includes straight religious uses as well as sweary ones, the pussy map includes cat references, and so on. But the graphs are nonetheless highly suggestive of differential swearword (and minced oath) clustering in different parts of the country.
Hell, damn and bitch are especially popular in the south and southeast. Douche is relatively common in northern states. Bastard is beloved in Maine and New Hampshire, and those states – together with a band across southern Arizona, New Mexico, and Texas – are the areas of particular motherfucker favour. Crap is more popular inland, fuck along the coasts. Fuckboy – a rising star* – is also mainly a coastal thing, so far.
Here’s the full glorious set in alphabetical order (click to enlarge):


As Grieve put it, ‘pretty much everyone’s swearing. We just don’t all prefer the same words’. You can see more word-maps on his research blog and various publications elsewhere on his website. He and colleagues have been measuring the 100,000 most common words in American English (as manifested in the tweet corpus), so additional maps will be appearing, and he tells me Diansheng is also collecting UK data.
For more on the method of spatial analysis used to create the maps, see for example Grieve’s ‘A regional analysis of contraction rate in written Standard American English’ (PDF), or ‘A statistical method for the identification and aggregation of regional linguistic variation’ (PDF) (co-written with Dirk Speelman and Dirk Geeraerts), both from 2011.
Updates:
See my follow-up post, Sweary maps 2: Swear harder, for ~60 more sweary heat maps and a link to Jack Grieve’s Word Mapper app, where you can run your own searches.
Some composite maps, including swears not covered above, are now available on Grieve’s blog. Here’s one with bollocks, bloody, piss, and crap:

Picked up by Washington Post, Kottke, Fusion, MetaFilter, Discovery, AJC, Mental Floss, WaPo again.
*
* Grieve’s presentation ‘Mapping lexical spread in American English’ (PDF) has data on the fastest growing words on Twitter in 2014, among other delights. Four of the top 10 are based on fuck. We’re becoming sweary asf.

This is some fucking bullshit.
LikeLike
I fucking love this site! I thought I knew how to swear until I joined the Marine Corps! I learned a whole new level and heard fantastic swearing from all over the country!
LikeLiked by 1 person
I read this : http://www.usnews.com/news/articles/2015-12-17/study-people-who-swear-more-are-smarter-have-larger-vocabulary and it made me feel so much better about my inability to refrain from swearing–now this site underscores that!
LikeLike
Anybody besides me bothered by the inclusion of hate language (faggot, slut, etc) with “swears”? I don’t just mean made uncomfortable – but also questioning the methodology.
LikeLike
We use ‘swear’ on this blog as a convenient catch-all term for taboo vocabulary in its many forms: this includes slurs and epithets. It’s not clear how this relates to Grieve and colleagues’ research methodology.
LikeLike
Gotcha. Still wondering why these terms and not others – maybe some of the more “loaded” terms get blocked by Twitter as hate speech and so don’t show up in their sample. Maybe I’ll take a look at the original study.
LikeLike
I’m not unbothered.
LikeLike
I notice a trend of low z-score for Colorado and specifically the Denver metropolitan area. Is there a way to substantiate that across the board with a single graphic that there are indeed some places that just don’t “swear” much online?
LikeLike
where’s Dang?
LikeLike
You must have skipped the bit where I wrote:
See my follow-up post, Sweary maps 2: Swear harder, for ~60 more sweary heat maps.
Dang is among them.
LikeLike
A small note: I think you mean spatial autocorrelation in your third paragraph instead of spatial autocorrection. Spatial autocorrelation means that the z value (e.g. elevation, Getis-Ord) for any one point (or pixel/cell) is similar to those cells near to it because they are close to each other, and the process driving that z value is not independent at that scale.
LikeLike
Thanks for pointing this out. It’s fixed now.
LikeLike