Someone who prefers to remain anonymous asks for my thoughts on this post by Michael Corrigan and Robert Whitaker, “Lancet Psychiatry Needs to Retract the ADHD-Enigma Study: Authors’ conclusion that individuals with ADHD have smaller brains is belied by their own data,” which begins:
Lancet Psychiatry, a UK-based medical journal, recently published a study titled Subcortical brain volume differences in participants with attention deficit hyperactivity disorder in children and adults: A cross-sectional mega-analysis. According to the paper’s 82 authors, the study provides definitive evidence that individuals with ADHD have altered, smaller brains. But as the following detailed review reveals, the study does not come close to supporting such claims.
Below are tons of detail, so let me lead with my conclusion, which is that the criticisms coming from Corrigan and Whitaker seem reasonable to me. That is, based on my quick read, the 82 authors of that published paper seem to have made a big mistake in what they wrote.
I’d be interested to see if the authors have offered any reply to these criticisms. The article has just recently come out—the journal publication is dated April 2017—and I’d like to see what the authors have to say.
OK, on to the details. Here are Corrigan and Whitaker:
The study is beset by serious methodological shortcomings, missing data issues, and statistical reporting errors and omissions. The conclusion that individuals with ADHD have smaller brains is contradicted by the “effect-size” calculations that show individual brain volumes in the ADHD and control cohorts largely overlapped. . . .
Their results, the authors concluded, contained important messages for clinicians: “The data from our highly powered analysis confirm that patients with ADHD do have altered brains and therefore that ADHD is a disorder of the brain.” . . .
The press releases sent to the media reflected the conclusions in the paper, and the headlines reported by the media, in turn, accurately summed up the press releases. Here is a sampling of headlines:
Given the implications of this study’s claims, it deserves to be closely analyzed. Does the study support the conclusion that children and adults with ADHD have “altered brains,” as evidenced by smaller volumes in different regions of the brain? . . .
Alternative Headline: Large Study Finds Children with ADHD Have Higher IQs!
To discover this finding, you need to spend $31.50 to purchase the article, and then make a special request to Lancet Psychiatry to send you the appendix. Then you will discover, on pages 7 to 9 in the appendix, a “Table 2” that provides IQ scores for both the ADHD cohort and the controls.
Although there were 23 clinical sites in the study, only 20 reported comparative IQ data. In 16 of the 20, the ADHD cohort had higher IQs on average than the control group. In the other four clinics, the ADHD and control groups had the same average IQ (with the mean IQ scores for both groups within two points of each other.) Thus, at all 20 sites, the ADHD group had a mean IQ score that was equal to, or higher than, the mean IQ score for the control group. . . .
And why didn’t the authors discuss the IQ data in their paper, or utilize it in their analyses? . . . Indeed, if the IQ data had been promoted in the study’s abstract and to the media, the public would now be having a new discussion: Is it possible that children diagnosed with ADHD are more intelligent than average? . . .
They Did Not Find That Children Diagnosed with ADHD Have Smaller Brain Volumes . . .
For instance, the authors reported a Cohen’s d effect size of .19 for differences in the mean volume of the accumbens in children under 15. . . in this study, for youth under 15, it was the largest effect size of all the brain volume comparisons that were made. . . . Approximately 58% of the ADHD youth in this convenience sample had an accumbens volume below the average in the control group, while 42% of the ADHD youth had an accumbens volume above the average in the control group. Also, if you knew the accumbens volume of a child picked at random, you would have a 54% chance that you could correctly guess which of the two cohorts—ADHD or healthy control—the child belonged to. . . . The diagnostic value of an MRI brain scan, based on the findings in this study, would be of little more predictive value than the toss of a coin. . . .
The authors reported that the “volumes of the accumbens, amygdala, caudate, hippocampus, putamen, and intracranial volume were smaller in individuals with ADHD compared with controls in the mega-analysis” (p. 1). If this is true, then smaller brain volumes should show up in the data from most, if not all, of the 21 sites that had a control group. But that was not the case. . . . The problem here is obvious. If authors are claiming that smaller brain regions are a defining “abnormality” of ADHD, then such differences should be consistently found in mean volumes of ADHD cohorts at all sites. The fact that there was such variation in mean volume data is one more reason to see the authors’ conclusions—that smaller brain volumes are a defining characteristic of ADHD—as unsupported by the data. . . .
And now here’s what the original paper said:
We aimed to investigate whether there are structural differences in children and adults with ADHD compared with those without this diagnosis. In this cross-sectional mega-analysis [sic; see P.P.S. below], we used the data from the international ENIGMA Working Group collaboration, which in the present analysis was frozen at Feb 8, 2015. Individual sites analysed structural T1-weighted MRI brain scans with harmonised protocols of individuals with ADHD compared with those who do not have this diagnosis. . . .
Our sample comprised 1713 participants with ADHD and 1529 controls from 23 sites . . . The volumes of the accumbens (Cohen’s d=–0·15), amygdala (d=–0·19), caudate (d=–0·11), hippocampus (d=–0·11), putamen (d=–0·14), and intracranial volume (d=–0·10) were smaller in individuals with ADHD compared with controls in the mega-analysis. There was no difference in volume size in the pallidum (p=0·95) and thalamus (p=0·39) between people with ADHD and controls.
The above demonstrates some forking paths, and there are a bunch more in the published paper, for example:
Exploratory lifespan modelling suggested a delay of maturation and a delay of degeneration, as e ect sizes were highest in most subgroups of children (<15 years) versus adults (>21 years): in the accumbens (Cohen’s d=–0·19 vs –0·10), amygdala (d=–0·18 vs –0·14), caudate (d=–0·13 vs –0·07), hippocampus (d=–0·12 vs –0·06), putamen (d=–0·18 vs –0·08), and intracranial volume (d=–0·14 vs 0·01). There was no di erence between children and adults for the pallidum (p=0·79) or thalamus (p=0·89). Case-control differences in adults were non-signi cant (all p>0·03). Psychostimulant medication use (all p>0·15) or symptom scores (all p>0·02) did not in uence results, nor did the presence of comorbid psychiatric disorders (all p>0·5). . . .
Outliers were identified at above and below one and a half times the interquartile range per cohort and group (case and control) and were excluded . . . excluding collinearity of age, sex, and intracranial volume (variance in ation factor <1·2) . . . The model included diagnosis (case=1 and control=0) as a factor of interest, age, sex, and intracranial volume as fixed factors, and site as a random factor. In the analysis of intracranial volume, this variable was omitted as a covariate from the model. Handedness was added to the model to correct for possible effects of lateralisation, but was excluded from the model when there was no significant contribution of this factor. . . . stratified by age: in children aged 14 years or younger, adolescents aged 15–21 years, and adults aged 22 years and older. We removed samples that were left with ten patients or fewer because of the stratification. . . .
Forking paths are fine; I have forking paths in every analysis I’ve ever done. But forking paths render published p-values close to meaningless; in particular I have no reason to take seriously a statement such as, “p values were significant at the false discovery rate corrected threshold of p=0·0156,” from the summary of the paper.
So let’s forget about p-values and just look at the data graphs, which appear in the published paper:
Unfortunately these are not raw data or even raw averages for each age; instead they are “moving averages, corrected for age, sex, intracranial volume, and site for the subcortical volumes.” But we’ll take what we’ve got.
From the above graphs, it doesn’t seem like much of anything is going on: the blue and red lines cross all over the place! So now I don’t understand this summary graph from the paper:
I mean, sure, I see it for Accumbens, I guess, if you ignore the older people. But, for the others, the lines in the displayed age curves cross all over the place.
The article in question has the following list of authors: Martine Hoogman, Janita Bralten, Derrek P Hibar, Maarten Mennes, Marcel P Zwiers, Lizanne S J Schweren, Kimm J E van Hulzen, Sarah E Medland, Elena Shumskaya, Neda Jahanshad, Patrick de Zeeuw, Eszter Szekely, Gustavo Sudre, Thomas Wolfers, Alberdingk M H Onnink, Janneke T Dammers, Jeanette C Mostert, Yolanda Vives-Gilabert, Gregor Kohls, Eileen Oberwelland, Jochen Seitz, Martin Schulte-Rüther, Sara Ambrosino, Alysa E Doyle, Marie F Høvik, Margaretha Dramsdahl, Leanne Tamm, Theo G M van Erp, Anders Dale, Andrew Schork, Annette Conzelmann, Kathrin Zierhut, Ramona Baur, Hazel McCarthy, Yuliya N Yoncheva, Ana Cubillo, Kaylita Chantiluke, Mitul A Mehta, Yannis Paloyelis, Sarah Hohmann, Sarah Baumeister, Ivanei Bramati, Paulo Mattos, Fernanda Tovar-Moll, Pamela Douglas, Tobias Banaschewski, Daniel Brandeis, Jonna Kuntsi, Philip Asherson, Katya Rubia, Clare Kelly, Adriana Di Martino, Michael P Milham, Francisco X Castellanos, Thomas Frodl, Mariam Zentis, Klaus-Peter Lesch, Andreas Reif, Paul Pauli, Terry L Jernigan, Jan Haavik, Kerstin J Plessen, Astri J Lundervold, Kenneth Hugdahl, Larry J Seidman, Joseph Biederman, Nanda Rommelse, Dirk J Heslenfeld, Catharina A Hartman, Pieter J Hoekstra, Jaap Oosterlaan, Georg von Polier, Kerstin Konrad, Oscar Vilarroya, Josep Antoni Ramos-Quiroga, Joan Carles Soliva, Sarah Durston, Jan K Buitelaar, Stephen V Faraone, Philip Shaw, Paul M Thompson, Barbara Franke.
I also found a webpage for their research group, featuring this wonderful map:
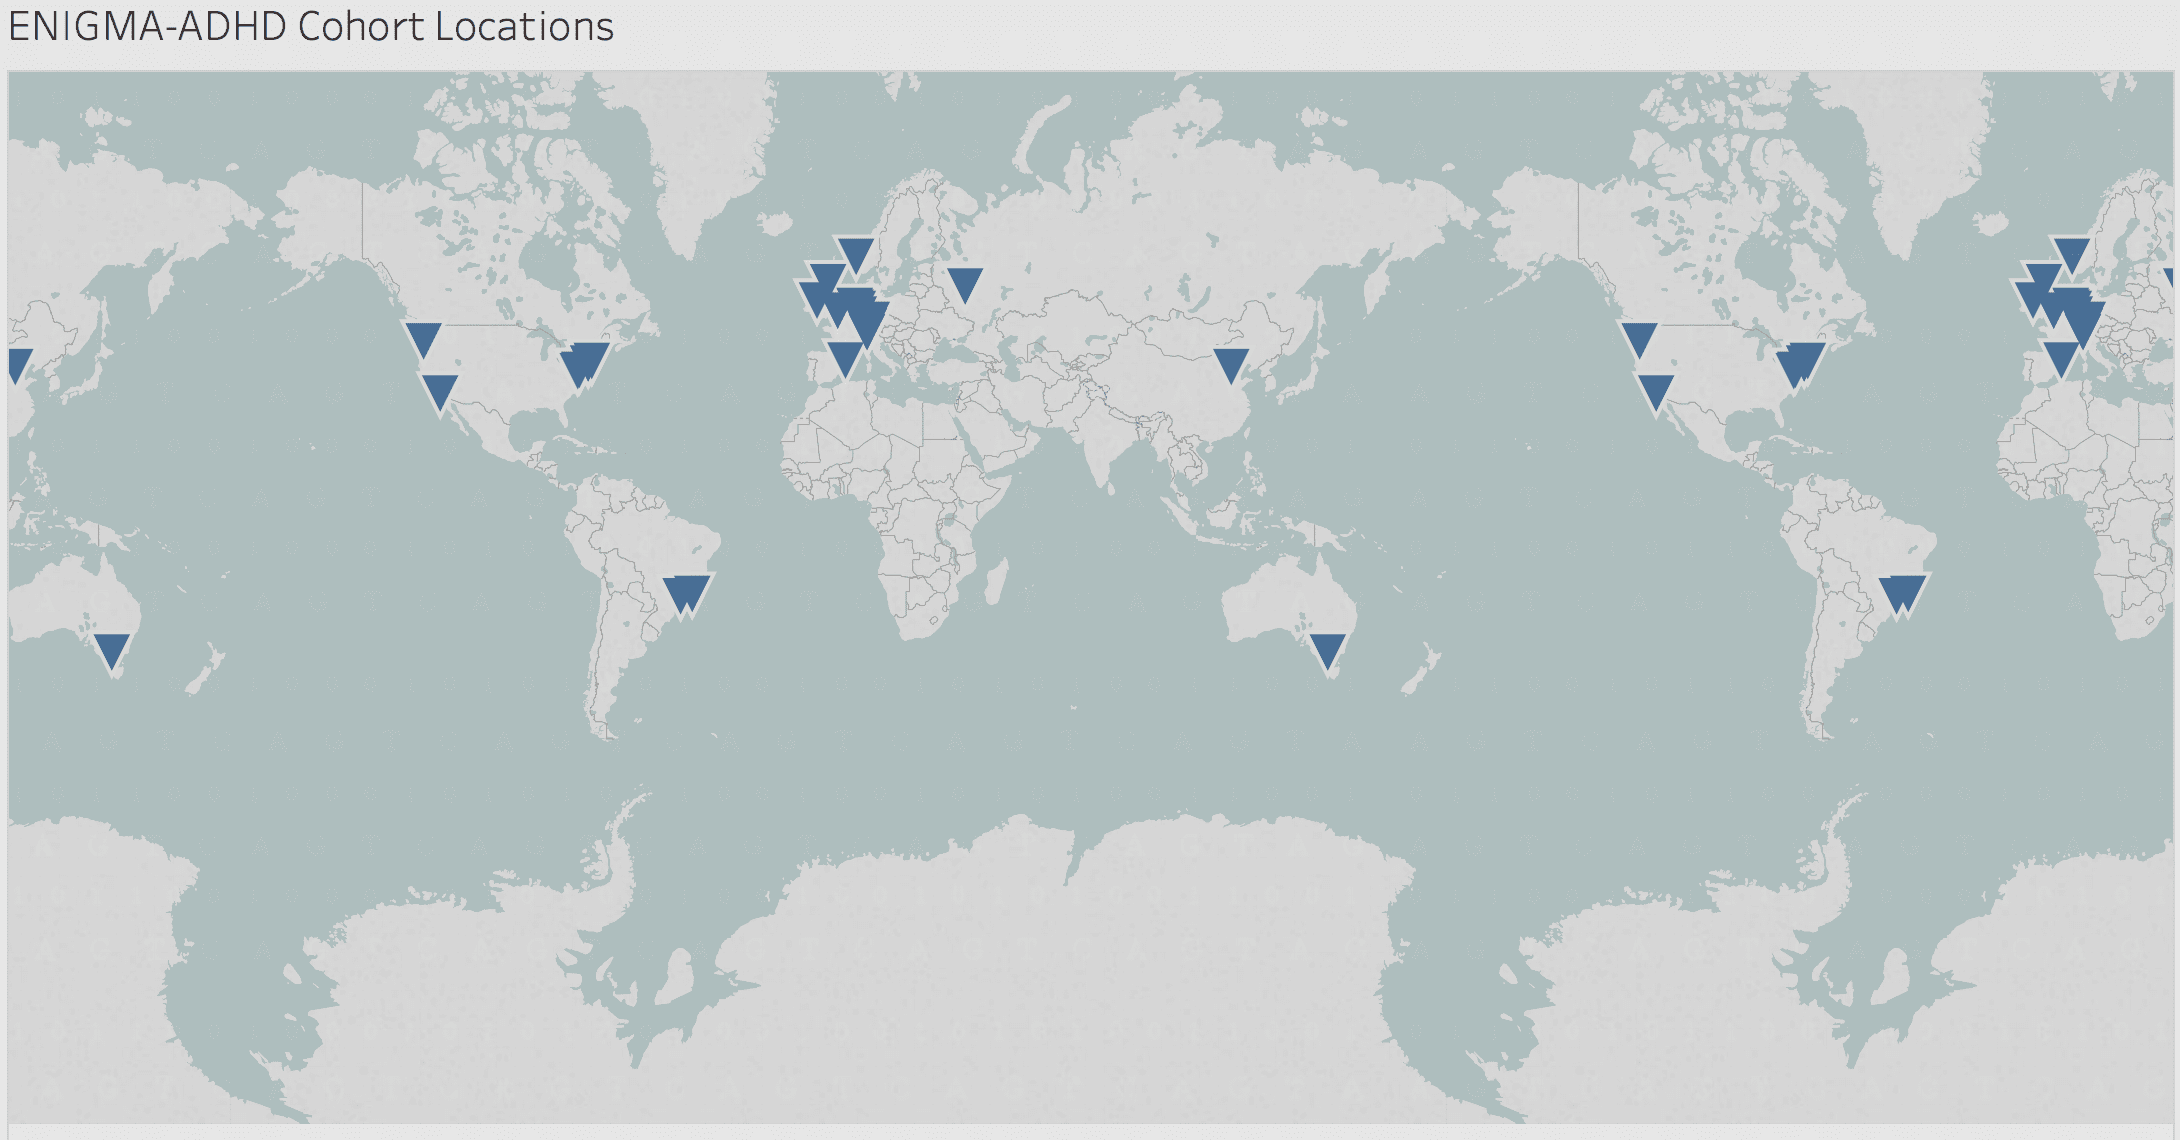
The number of sites looks particularly impressive when you include each continent twice like that. But they should really do some studies in Antarctica, given how huge it appears to be!
P.S. Following the links, I see that Corrigan and Whitaker come into this with a particular view:
Mad in America’s mission is to serve as a catalyst for rethinking psychiatric care in the United States (and abroad). We believe that the current drug-based paradigm of care has failed our society, and that scientific research, as well as the lived experience of those who have been diagnosed with a psychiatric disorder, calls for profound change.
This does not mean that the critics are wrong—presumably the authors of the original paper came into their research with their own strong views—; it can just be helpful to know where they’re coming from.
P.P.S. The paper discussed above uses the term “mega-analysis.” At first I thought this might be some sort of typo, but apparently the expression does exist and has been around for awhile. From my quick search, it appears that the term was first used by James Dillon in a 1982 article, “Superanalysis,” in Evaluation News, where he defined mega-analysis as “a method for synthesizing the results of a series of meta-analyses.”
But in the current literature, “mega-analysis” seems to simply refer to a meta-anlaysis that uses the raw data from the original studies.
If so, I’m unhappy with the term “mega-analysis” because: (a) The “mega” seems a bit hypey, (b) What if the original studies are small? Then even all the data combined might not be so “mega”?, and (c) I don’t like the implication that plain old “meta-analysis” doesn’t use the raw data. I’m pretty sure that the vast majority of meta-analyses use only published summaries, but I’ve always thought of it as the preferred version of meta-anlaysis to use the original data.
I bring up this mega-analysis thing not as a criticism of the Hoogman et al. paper—they’re just using what appears to be a standard term in their field—but just as an interesting side-note.
P.P.P.S. The above post represents my current impression. As I wrote, I’d be interested to see the original authors’ reply to the criticism. Lancet does have a pretty bad reputation—it’s known for publishing flawed, sensationalist work—but I’m sure they run the occasional good article too. So I wouldn’t want to make any strong judgments in this case before hearing more.
P.P.P.P.S. Regarding the title of this post: No, I don’t think Lancet would ever retract this paper, even if all the above criticisms are correct. It seems that retraction is used only in response to scientific misconduct, not in response to mere error. So when I say “retraction,” I mean what one might call “conceptual retraction.” The real question is: Will this new paper join the list of past Lancet papers which we would not want to take seriously, and which we regret were ever published?