Today we’re very pleased to announce the availability of RStudio Version 1.0! Version 1.0 is our 10th major release since the initial launch in February 2011 (see the full release history below), and our biggest ever! Highlights include:
- Authoring tools for R Notebooks.
- Integrated support for the sparklyr package (R interface to Spark).
- Performance profiling via integration with the profvis package.
- Enhanced data import tools based on the readr, readxl and haven packages.
- Authoring tools for R Markdown websites and the bookdown package.
- Many other miscellaneous enhancements and bug fixes.
We hope you download version 1.0 now and as always let us know what you think.
R Notebooks
R Notebooks add a powerful notebook authoring engine to R Markdown. Notebook interfaces for data analysis have compelling advantages including the close association of code and output and the ability to intersperse narrative with computation. Notebooks are also an excellent tool for teaching and a convenient way to share analyses.
Interactive R Markdown
As an authoring format, R Markdown bears many similarities to traditional notebooks like Jupyter and Beaker. However, code in notebooks is typically executed interactively, one cell at a time, whereas code in R Markdown documents is typically executed in batch.
R Notebooks bring the interactive model of execution to your R Markdown documents, giving you the capability to work quickly and iteratively in a notebook interface without leaving behind the plain-text tools, compatibility with version control, and production-quality output you’ve come to rely on from R Markdown.
Iterate Quickly
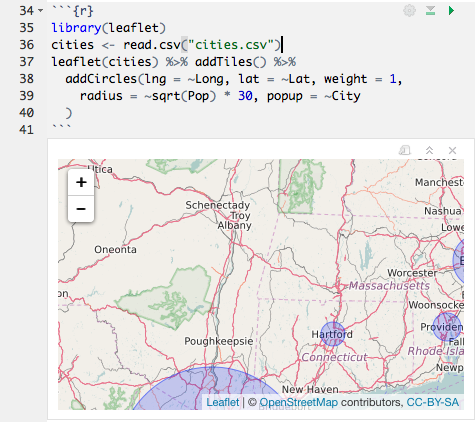
In a typical R Markdown document, you must re-knit the document to see your changes, which can take some time if it contains non-trivial computations. R Notebooks, however, let you run code and see the results in the document immediately. They can include just about any kind of content R produces, including console output, plots, data frames, and interactive HTML widgets.
You can see the progress of the code as it runs:

You can preview the results of individual inline expressions, too:

Even your LaTeX equations render in real-time as you type:

This focused mode of interaction doesn’t require you to keep the console, viewer, or output panes open. Everything you need is at your fingertips in the editor, reducing distractions and helping you concentrate on your analysis. When you’re done, you’ll have a formatted, reproducible record of what you’ve accomplished, with plenty of context, perfect for your own records or sharing with others.
Spark with sparklyr
The sparklyr package is a new R interface for Apache Spark. RStudio now includes integrated support for Spark and the sparklyr package, including tools for:
- Creating and managing Spark connections
- Browsing the tables and columns of Spark DataFrames
- Previewing the first 1,000 rows of Spark DataFrames
Once you’ve installed the sparklyr package, you should find a new Spark pane within the IDE. This pane includes a New Connection dialog which can be used to make connections to local or remote Spark instances:
Once you’ve connected to Spark you’ll be able to browse the tables contained within the Spark cluster:
The Spark DataFrame preview uses the standard RStudio data viewer:
Profiling with profvis
“How can I make my code faster?”
If you write R code, then you’ve probably asked yourself this question. A profiler is an important tool for doing this: it records how the computer spends its time, and once you know that, you can focus on the slow parts to make them faster.
RStudio now includes integrated support for profiling R code and for visualizing profiling data. R itself has long had a built-in profiler, and now it’s easier than ever to use the profiler and interpret the results.
To profile code with RStudio, select it in the editor, and then click on Profile -> Profile Selected Line(s). R will run that code with the profiler turned on, and then open up an interactive visualization.

In the visualization, there are two main parts: on top, there is the code with information about the amount of time spent executing each line, and on the bottom there is a flame graph, which shows what R was doing over time. In the flame graph, the horizontal direction represents time, moving from left to right, and the vertical direction represents the call stack, which are the functions that are currently being called. (Each time a function calls another function, it goes on top of the stack, and when a function exits, it is removed from the stack.)

The Data tab contains a call tree, showing which function calls are most expensive:

Armed with this information, you’ll know what parts of your code to focus on to speed things up!
Data Import
RStudio now integrates with the readr, readxl, and haven packages to provide comprehensive tools for importing data from many text file formats, Excel worksheets, as well as SAS, Stata, and SPSS data files. The tools are focused on interactively refining an import then providing the code required to reproduce the import on new datasets.
For example, here’s the workflow we would use to import the Excel worksheet at http://www.fns.usda.gov/sites/default/files/pd/slsummar.xls.
First provide the dataset URL and review the import in preview mode (notice that this file contains two tables and as a result requires the first few rows to be removed):
We can clean this up by skipping 6 rows from this file and unchecking the “First Row as Names” checkbox:
The file is looking better but some columns are being displayed as strings when they are clearly numerical data. We can fix this by selecting “numeric” from the column drop-down:
The final step is to click “Import” to run the code displayed under “Code Preview” and import the data into R. The code is executed within the console and imported dataset is displayed automatically:
Note that rather than executing the import we could have just copied and pasted the import code and included it within any R script.
RStudio Release History
We started working on RStudio in November of 2008 (8 years ago!) and had our first public release in February of 2011. Here are highlights of the various releases through the years:
| Version | Date | Highlights |
|---|---|---|
| 0.92 | Feb 2011 |
|
| 0.93 | Apr 2011 |
|
| 0.94 | Jun 2011 |
|
| 0.95 | Jan 2012 |
|
| 0.96 | May 2012 |
|
| 0.97 | Oct 2012 |
|
| 0.98 | Dec 2013 |
|
| 0.98b | Jun 2014 |
|
| 0.99 | May 2015 |
|
| 0.99b | Feb 2016 |
|
| 1.0 | Nov 2016 |
|
The RStudio Release History page on our support website provides a complete history of all major and minor point releases.
10 comments
Comments feed for this article
November 1, 2016 at 12:10 pm
Nasir
Waw – excellent achievement! Have used these exciting features in review version – glad to have this GA version. Thanks RStudio!
November 1, 2016 at 12:23 pm
Forest
This is awesome and I enjoyed every bit of Rnotebook. I have a question though: when I run a function that prints progress bar, it shows beneath the chunk inline, which is nice but also show up in the rendered in notebook output, which is bad. I know I can hide them altogether but is there a way to show it interactively but not in the doc?
November 1, 2016 at 1:39 pm
Jonathan
There is not currently a way to do this with notebooks alone — what you see is what you get. However, you can always add another output format (such as html_document) and knit to that format when you want to produce something to publish; then you can use interactive() to determine whether or not to show the progress bar. Would that do what you want?
November 1, 2016 at 2:47 pm
saurfang86
Thanks Jonathan! I think this is an okay workaround for now. It is not ideal because the `html_document` format has different behavior with `html_notebook` e.g. table rendering, chart, and etc. Excited to see the future enhancements of R notebook.
November 1, 2016 at 12:24 pm
saurfang86
This is awesome and I enjoyed every bit of Rnotebook. I have a question though: when I run a function that prints progress bar, it shows beneath the chunk inline, which is nice but also show up in the rendered in notebook output, which is bad. I know I can hide them altogether but is there a way to show it interactively but not in the doc?
November 1, 2016 at 1:54 pm
Washington S. Silva (@twssecn)
Thank you for this excellent version!
Unfortunately, I have experienced a fatal error during installation since the preview version:
error message:
JavaScript Alert – 127.0.0.1
A fatal error encountered. The session was terminated.
Any hint?
OS: Windows 10 Pro 64-bit
Congratulations!
November 1, 2016 at 3:04 pm
Jonathan
Sorry you’re having trouble! Could you post a diagnostic report on our support forum?
https://support.rstudio.com/hc/en-us/articles/200321257-Running-a-Diagnostics-Report
https://support.rstudio.com/hc/en-us/community/topics/200022748-RStudio-IDE
November 1, 2016 at 3:11 pm
Washington S. Silva (@twssecn)
Thanks Jonathan.
I (re)installed the version 0.99.903, it works fine.
I believe that I can not make the diagnosis in version 1.0, because the program crashes at startup, but I’ll try …
Thanks.
November 1, 2016 at 2:35 pm
Announcing RStudio v1.0! | RStudio Blog | Raony Guimarães
[…] Source: Announcing RStudio v1.0! | RStudio Blog […]
November 1, 2016 at 3:48 pm
Dave.apter@gmail.com
Well done. 1!
Been all the way.
Many thanks.