Linux Performance
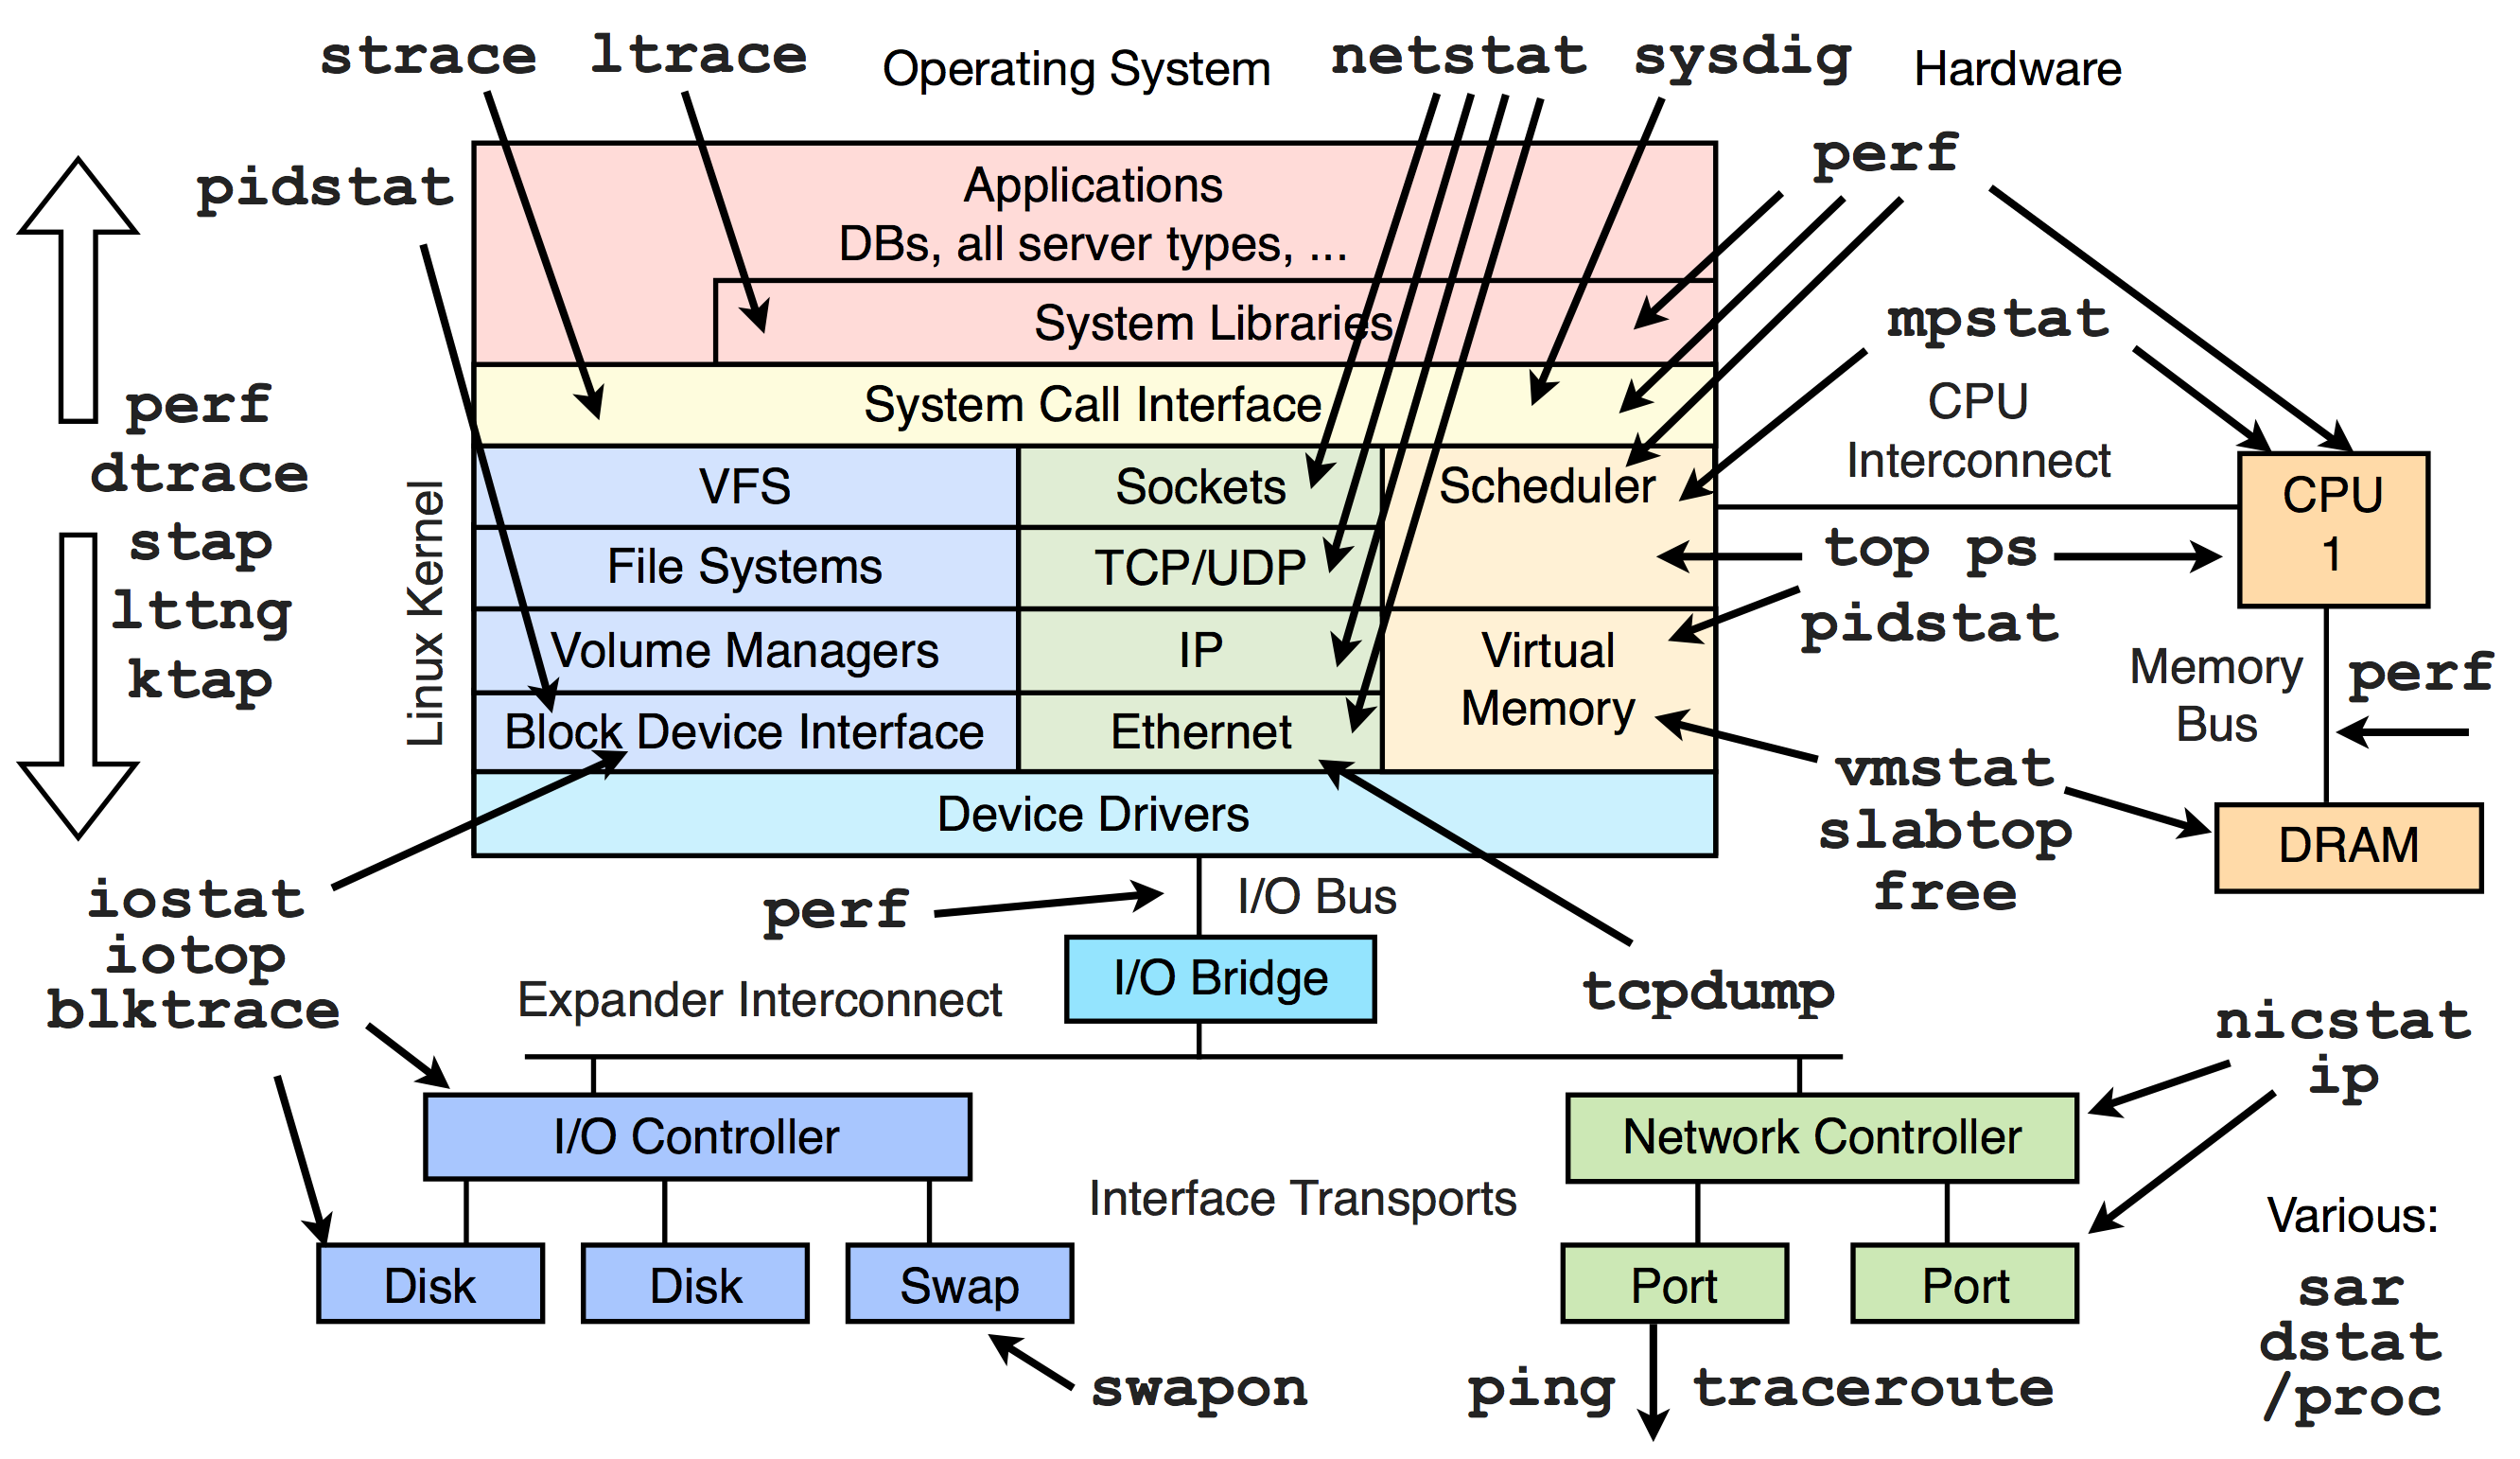
This page links to various Linux performance material I've created, including the tools map on the right.
Tools
- perf_events: one-liners, examples, flame graphs, and heat maps.
- ktap: one-liners, examples, and scripts.
- Flame Graphs: using perf, SystemTap, and ktap.
Documentation
- Systems Performance: Enterprise and the Cloud (Prentice Hall, 2013) uses Linux distributions as the primary example.
- USE Method: Linux Performance Checklist; also see the USE Method page for the description of this methodology.
- The blog post strace Wow Much Syscall discusses strace(1) for production use, and compares it to advanced tracing tools.
Talks
Previous talks on Linux performance.
SCaLE12x
At SCaLE 12x (Southern California Linux Expo, 2014) I gave the keynote on What Linux can learn from Solaris performance and vice-versa. This drew on my experience analyzing Linux vs SmartOS performance, and my work for the Systems Performance book. SmartOS is an OS based on the illumos kernel, which is the active fork of the OpenSolaris kernel.
The slides are on slideshare and as a PDF:
I've never seen a good talk comparing performance features of both, I suspect in part because it's hard to know them both in enough depth, and also hard to choose from the many differences which should be highlighted.
This presentation also contains ponies. Lots of ponies. These are the unofficial mascots for DTrace, perf_events, SystemTap, ktap, and LTTng, and were designed by the same person (Deirdré) who designed the original (and popular) DTrace ponycorn.
SCaLE11x
At SCaLE 11x (2013) I gave a talk on Linux Performance Analysis and Tools, and described over twenty tools, and then methodologies for using them. During this talk I introduced the Linux performance tools diagram, which I've put at the top of this page (an updated version).
A video of the talk is on youtube, and the slides are available on slideshare and as a PDF:
I've used pretty much everything for solving performance issues, including advanced tools like perf, DTrace, and SystemTap, and I was able to explain their role and how they fit together. It was pretty dense: you can treat this as a 60 minute crash course into Linux performance analysis and tools.
Thanks Deirdré Straughan for filming it and then spreading the word afterwards.