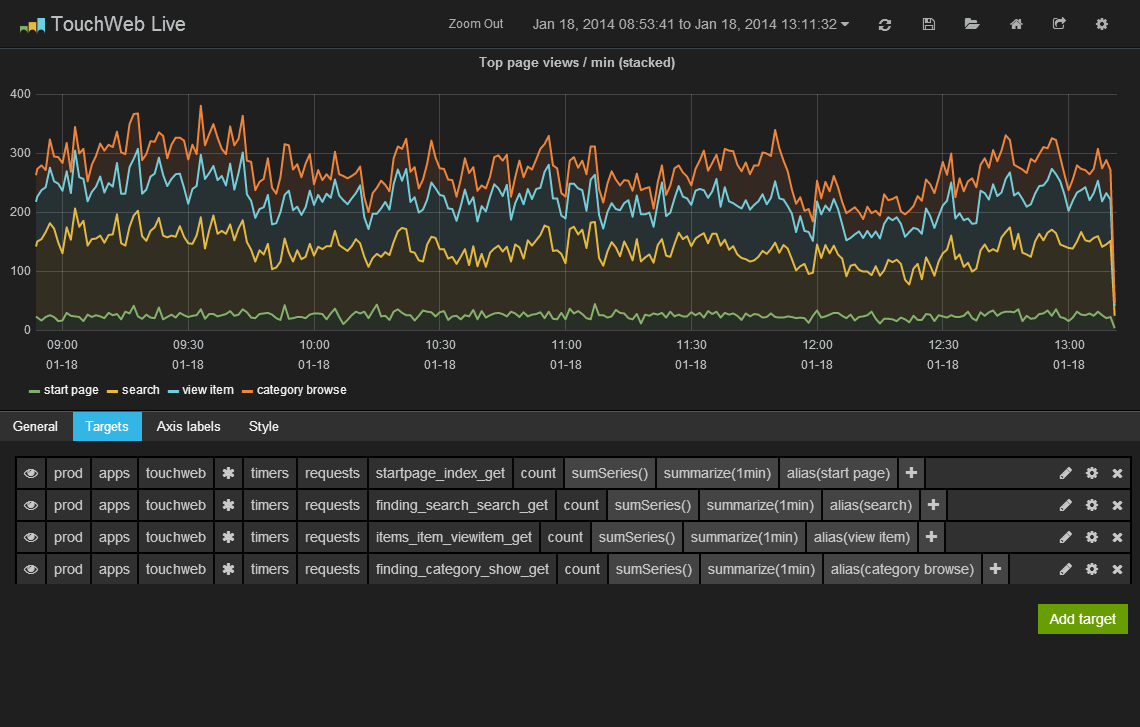
Grafana

A beautiful, easy to use and feature rich Graphite dashboard replacement and graph editor.

Download Github project

Graphing

  • Fast rendering, even over large timespans.
  • Click and drag to zoom.
  • Multiple Y-axis.
  • Bars, Lines, Points, Annotations
  • Smart Y-axis formating
  • Series toggles & color selector
  • Grid thresholds, axis labels, more...
  • Supports graphite png graphs

Dashboards

  • Create and edit dashboards
  • Drag and drop graphs to rearrange
  • Set column spans and row heights
  • Save & search dashboards (ElasticSearch)
  • Import & export dashboard (json file)
  • Import dashboard from Graphite
  • Templating
  • Scripted dashboards

Graphite Target Editor

  • Graphite target expression parser
  • Quickly add / edit / remove function
  • Function parameters can be easily changed
  • Quickly navigate graphite metric structure
  • Templating
  • Integrated function documentation
  • Click & drag functions to rearrange order
  • Much more...

Design goal

Grafana is meant to be a general purpose dashboard replacement for Graphite. Graphite is an incredible time series database and metric visualization tool. However the default dashboard and graph editor leaves much to be desired. The goal for Grafana is to be a dashboard and graph editor that is flexible, feature rich, easy to use and beautiful with low noice and clutter in its visual presentation.

Grafana Video tour

This video will show you a quick intro and a tour of some of the many features in Grafana. It also a good getting started guide for getting know the interface and learning how to create and edit dashboards and graphs.

Target editor

Click on the graph title to open any graph in edit mode. Edit mode quickly fills the entire page with a clear view of the graph being edited. Grafana includes a built in target parser, it can help with syntax errors but most importantly it can visualize the expression in other ways. For example unwrap the method calls and presents the inner metric expression as a series of clickable segments followed by a chain of functions.

The parser and the unwrapping of functions has some current limitations (will be improved). By clicking on the pen icon you can edit the expression in a text box instead.

Metric & function editing

Click on a metric path segment and a dropdown with other segments and wildcard option is shown. Click on a function and easily change function parameters. Click on a series legend and change series color and Y-axis.

Graph Style Editor

In the style editor you have a lot of control of how the graph should be drawn. Grafana uses the plotting library Flot and many of its options are exposed in the style editor.

Dashboards

In the dashboard view you can easily edit, view in fullscreen, duplicate, change column span of any graph by clicking the graph label. Click and select region to zoom in on any graph. Click and drag the graph label to rearrange graphs. Ctrl+F opens up a search bar to quickly search and open another dashboard. Ctrl+S saves the current dashboard.

Templating

Create templated metric segments. This enabled reuse of a single dashboard for multiple servers, apps, clusters etc.